USD_CHF BEARISH BREAKOUT|SHORT|
✅USD_CHF broke the key structure level of 0.8050
While trading in a strong downtrend
Which makes me bearish
And I think that after the retest of the broken level is complete
A bearish continuation will follow
SHORT🔥
✅Like and subscribe to never miss a new idea!✅
Disclosure: I am part of Trade Nation's Influencer program and receive a monthly fee for using their TradingView charts in my analysis.
USDCHF trade ideas

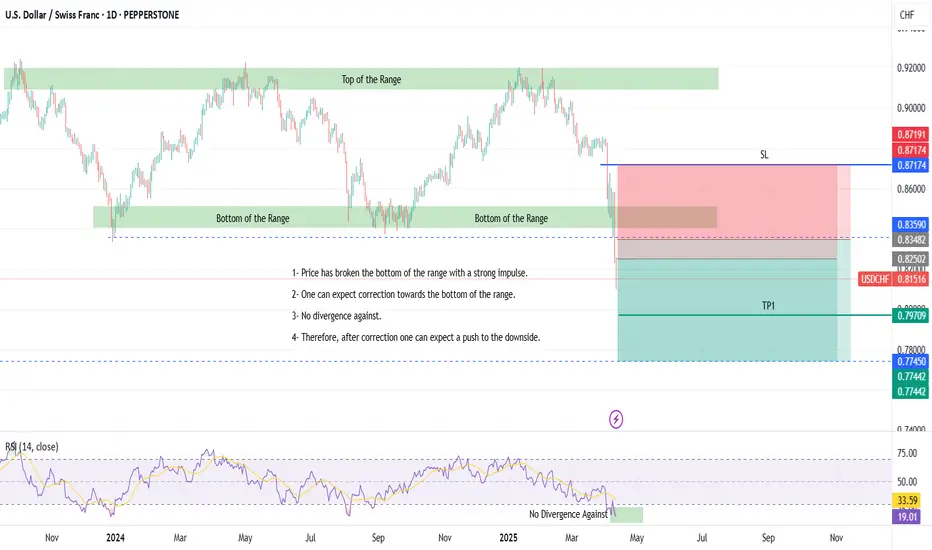
14-04-2025 _ Short Term Bearish Idea _ USDCHF D11- Price has broken the bottom of the range with a strong impulse.
2- One can expect correction towards the bottom of the range.
3- No divergence against.
4- Therefore, after correction one can expect a push to the downside.
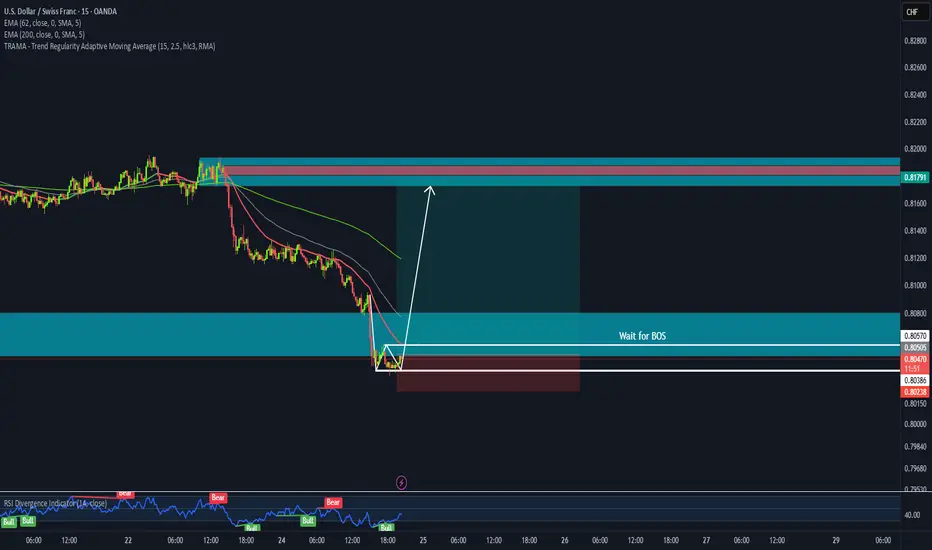
USDCHF → Hunting for liquidity before the fallFX:USDCHF , against the backdrop of the falling dollar and the exit from consolidation, is forming another ‘bos’, which only confirms the market sentiment.
The fall of the dollar only increases pressure on the currency pair. The price has broken out of consolidation and is trading below the key level. USDCHF has broken through a fairly strong support level, which only confirms the bearish market structure. A correction is forming ahead of a possible decline (liquidity capture).
Resistance levels: 0.803, 0.8042
Support levels: 0.798, 0.79
Fundamentally and technically, the currency pair looks weak. The decline may continue after the liquidity capture phase and a retest of resistance. A false breakout of resistance will be a strong signal.
Best regards, R. Linda!

USD/CHF SENDS CLEAR BULLISH SIGNALS|LONG
Hello, Friends!
The BB lower band is nearby so USD-CHF is in the oversold territory. Thus, despite the downtrend on the 1W timeframe I think that we will see a bullish reaction from the support line below and a move up towards the target at around 0.801.
Disclosure: I am part of Trade Nation's Influencer program and receive a monthly fee for using their TradingView charts in my analysis.
LIKE AND COMMENT MY IDEAS

USD/CHF 4H Chart – Bullish Rebound Within Downtrend ChannelUSD/CHF is currently trading within a well-defined descending channel, with price bouncing off the lower boundary near support at 0.80387. The chart suggests a potential short-term bullish move toward the upper channel resistance and target zone at 0.81338. A clear support level is holding, offering a low-risk entry with a stop loss just below 0.8000. The move remains counter-trend, so caution is needed unless a breakout above the channel confirms further upside.

USD/CHF H1 | Pullback resistance at 61.8% Fibonacci retracementUSD/CHF is rising towards a pullback resistance and could potentially reverse off this level to drop lower.
Sell entry is at 0.8041 which is a pullback resistance that aligns with the 61.8% Fibonacci retracement.
Stop loss is at 0.8090 which is a level that sits above a swing-high resistance.
Take profit is at 0.7979 which is a multi-swing-low support.
High Risk Investment Warning
Trading Forex/CFDs on margin carries a high level of risk and may not be suitable for all investors. Leverage can work against you.
Stratos Markets Limited (tradu.com ):
CFDs are complex instruments and come with a high risk of losing money rapidly due to leverage. 63% of retail investor accounts lose money when trading CFDs with this provider. You should consider whether you understand how CFDs work and whether you can afford to take the high risk of losing your money.
Stratos Europe Ltd (tradu.com ):
CFDs are complex instruments and come with a high risk of losing money rapidly due to leverage. 63% of retail investor accounts lose money when trading CFDs with this provider. You should consider whether you understand how CFDs work and whether you can afford to take the high risk of losing your money.
Stratos Global LLC (tradu.com ):
Losses can exceed deposits.
Please be advised that the information presented on TradingView is provided to Tradu (‘Company’, ‘we’) by a third-party provider (‘TFA Global Pte Ltd’). Please be reminded that you are solely responsible for the trading decisions on your account. There is a very high degree of risk involved in trading. Any information and/or content is intended entirely for research, educational and informational purposes only and does not constitute investment or consultation advice or investment strategy. The information is not tailored to the investment needs of any specific person and therefore does not involve a consideration of any of the investment objectives, financial situation or needs of any viewer that may receive it. Kindly also note that past performance is not a reliable indicator of future results. Actual results may differ materially from those anticipated in forward-looking or past performance statements. We assume no liability as to the accuracy or completeness of any of the information and/or content provided herein and the Company cannot be held responsible for any omission, mistake nor for any loss or damage including without limitation to any loss of profit which may arise from reliance on any information supplied by TFA Global Pte Ltd.
The speaker(s) is neither an employee, agent nor representative of Tradu and is therefore acting independently. The opinions given are their own, constitute general market commentary, and do not constitute the opinion or advice of Tradu or any form of personal or investment advice. Tradu neither endorses nor guarantees offerings of third-party speakers, nor is Tradu responsible for the content, veracity or opinions of third-party speakers, presenters or participants.

USDCHF- Buy Now on 15 minute time FrameUSDCHF- Buy Now setup based on TBS and M1 confirmation alongside bullish diverence created. accordingly atleast 50% target is set to be acheived while expecting it to acheive 100%. whats are your thoughts?

Bearish continuation?The Swissie (USD/CHF) has rejected off the pivot which has been identified as a pullback resistance and could drop to the 1st support.
Pivot: 0.8070
1st Support: 0.7962
1st Resistance: 0.8104
Risk Warning:
Trading Forex and CFDs carries a high level of risk to your capital and you should only trade with money you can afford to lose. Trading Forex and CFDs may not be suitable for all investors, so please ensure that you fully understand the risks involved and seek independent advice if necessary.
Disclaimer:
The above opinions given constitute general market commentary, and do not constitute the opinion or advice of IC Markets or any form of personal or investment advice.
Any opinions, news, research, analyses, prices, other information, or links to third-party sites contained on this website are provided on an "as-is" basis, are intended only to be informative, is not an advice nor a recommendation, nor research, or a record of our trading prices, or an offer of, or solicitation for a transaction in any financial instrument and thus should not be treated as such. The information provided does not involve any specific investment objectives, financial situation and needs of any specific person who may receive it. Please be aware, that past performance is not a reliable indicator of future performance and/or results. Past Performance or Forward-looking scenarios based upon the reasonable beliefs of the third-party provider are not a guarantee of future performance. Actual results may differ materially from those anticipated in forward-looking or past performance statements. IC Markets makes no representation or warranty and assumes no liability as to the accuracy or completeness of the information provided, nor any loss arising from any investment based on a recommendation, forecast or any information supplied by any third-party.

USDCHF LONG FORECAST Q2 W26 D26 Y25USDCHF LONG FORECAST Q2 W26 D26 Y25
Professional Risk Managers👋
HTF BOS REQUIRED
Welcome back to another FRGNT chart update📈
Diving into some Forex setups using predominantly higher time frame order blocks alongside confirmation breaks of structure.
Let’s see what price action is telling us today!
💡Here are some trade confluences📝
✅Daily order block
✅Weekly order block
✅Intraday breaks of structure Required
✅4H Order block
🔑 Remember, to participate in trading comes always with a degree of risk, therefore as professional risk managers it remains vital that we stick to our risk management plan as well as our trading strategies.
📈The rest, we leave to the balance of probabilities.
💡Fail to plan. Plan to fail.
🏆It has always been that simple.
❤️Good luck with your trading journey, I shall see you at the very top.
🎯Trade consistent, FRGNT X

USDCHF ACCUMULATION AND DISTRIBUTION AT THE STRONGEST SUPPORTRepeated liquidity sweeps (marked with arrows) indicate smart money absorbing sell pressure.
Consolidation is happening after a significant downtrend, suggesting potential reversal.
The volume stays steady — no major breakdowns or explosive exits.
What you see here is a textbook accumulation phase forming on the USD/CHF chart — not just because of the sideways structure, but due to the repeated liquidity sweeps and smart money behavior around a long-term support level.
🔹 Major Support:
The yellow horizontal line marks a critical support level, originally established on April 21, 2025. Price has respected this level repeatedly, making it a strong base.
🔹 Liquidity Sweeps:
Multiple deep wicks below support (highlighted by blue arrows) are signs of stop-loss hunting, where price dips below key levels only to sharply recover. This is classic smart money accumulation behavior.
🔹 Volume Profile:
Volume remains stable throughout the consolidation zone — no significant exit volume, which suggests this is not distribution.
🔹 Failed Breakdowns:
Every time price breaks the range low, it’s met with quick rejections and reversals, absorbing selling pressure instead of following through → further validation of accumulation.
🔹 Historical Significance:
The concerning part? The next major support on this pair isn’t until August 8, 2011 — over a decade back! That makes this level extremely critical to hold.

USDCHF | Comp. Trade 04USDCHF is shpowing bearish trend and swiss franc is gaining strength against USD.It is not a bad setup to take a new short trade since there is no divergence on RSI.

USD/CHF At Perfect Place For Buy , 250 Pips Easy To Get !Here is my opinion on USD/CHF , The price at support area that forced the price to go up last time more than 500 pips , so it`s a very strong Area to buy it again from the same support cuz it`s the lowest place the price can go up from it , and we can targeting 250 pips .

Expect a bullish reversal on USDCHFExpecting a bullish movement seen a valid supply zone with a brake of structure and a run of liquidity. And CHF has also been bearish for weeks now

USD/CHF – Rejection at Key Fib Confluence, Bearish Continuation We’re seeing a beautiful textbook rejection off the 0.79Fib zone (0.8200), precisely where price tapped into a previous structure break and minor supply block. Price surged into the red zone, wicked just above the 200 EMA, and was instantly met with heavy sell-side pressure — a strong signal of institutional distribution.
📌 Technical Confluences at Play:
Price failed to break the 200 EMA cleanly — acting as dynamic resistance.
0.79 Fib levels aligning with prior supply.
Rising wedge structure broken to the downside.
Entry candle printing a solid engulfing rejection — institutional footprint.
📉 Target Zone:
Primary TP sits at the 0.236 Fib level (0.8101), but the full measured move of this wedge gives us a final downside target near 0.8038, with intermediate stops at key Fibs. Invalidation above 0.82294
🧠 Trader’s Insight:
“Patience is power. You don’t chase moves, you position for moments.”
Let the market come to your zone of interest, validate your thesis, and then strike with precision. The best trades come from areas where multiple confirmations stack in your favor.
📉 Trade Plan:
Entry: 0.81933 rejection zone
TP1: 0.8130
TP2: 0.8101
Final TP: 0.8038
SL: Above 0.82294 (tight invalidation)
@WrightWayInvestments
@WrightWayInvestments
@WrightWayInvestments

USDCHF GREAT SELLSCHF really been impressive with their currency strength. TRUMPs USA is slowly crumbing into disaster. It’s only right the fundaments stay like this from GEO political view.
Use the technical charting for your entry on short. This is my one!

USDCHF Inverse flag and pole pattern USDCHF Trade Setup –
Bearish Flag & Pole Pattern (1H Time Frame)
🔍 Market Overview:
Currently observing a bearish flag & pole formation on USDCHF, paired with a bullish FVG retracement. Price is approaching a potential supply zone at 0.81700, presenting a high-probability short opportunity.
📌 Sell Zone:
🔹 Supply Zone: 0.81700
🔹 Stop Loss: Above Bearish Order Block at 0.82300
🎯 Bearish Targets:
1️⃣ First Target: 0.81200 (Demand Zone)
2️⃣ Second Target: 0.80900 (Demand Zone)
3️⃣ Final Target: 0.80600 (Major Support)
✨ Bullish Fair Value Gap remains unfilled at 0.80700 — watch for potential reaction once filled.
📊 Technical Confluence:
✅ Bearish flag & pole
✅ Supply zone reaction
✅ FVG retracement
✅ Multiple demand zones for scaling out profits
📣 Like, Follow, Comment & Join the community for more real-time setups and updates!
— Livia 😜 | Trade Smart. Stay Sharp.

USDCHF ShortUSDCHF is now net short on the regression break.
I am not taking this trade as it has terrible roll short. Wait the break upwards in coming days and weeks.

usdchflong idea if price break the line I mentioned if not do not recommend but I'm expecting price will break it and go long

USDCHFPotential long opportunity
- Reached weekly demand zone and swept liquidity
- Exhausted bearish wicks - are the buyers stepping in
- potential double bottom forming ( W patter ) shown by the arrows
- RSI divergent showing bullish momentum
- possible swing trade to our next major supply zone
UsdChf moving down on retracement. Looking for Impulse Down.
"USD/CHF seems to be in a bearish trend after breaking major support. Price is expected to bounce back to the 4H supply zone (0.81400-0.81750), then drop more toward the sell-side liquidity level of 0.80400."
Learn & Earn!
Wave Trader Pro

USDCHF TRADE UPDATE Remember our trade idea posted sometime ago on USDCHF.
The trade has gotten to our profit target

USDCHF: Bullish Continuation & Long Trade
USDCHF
- Classic bullish formation
- Our team expects growth
SUGGESTED TRADE:
Swing Trade
Buy USDCHF
Entry Level - 0.8046
Sl - 0.8013
Tp - 0.8118
Our Risk - 1%
Start protection of your profits from lower levels
Disclosure: I am part of Trade Nation's Influencer program and receive a monthly fee for using their TradingView charts in my analysis.
❤️ Please, support our work with like & comment! ❤️

USDCHF UPDATE🔥 Quick update on the move...
USDCHF rolled over just like mapped — clean lower highs, sharp drop, volume kicked in late. But I froze and didn’t pull the trigger.
It played out without me. No revenge, no chasing. Just a missed shot 🎯
Now back to neutral. Watching, not forcing.
⚡
Sell idea worked — I didn’t. On to the next setup.
