USDCNH trade ideas
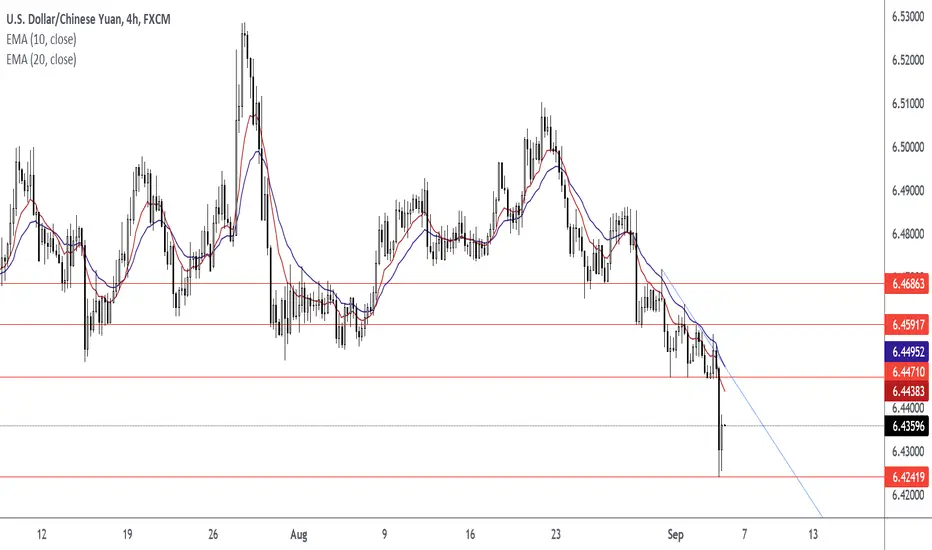
USDCNH CRITICAL NEWS ALERT Tomorrow morning the USD will see massive movement off job numbers dropping. Personally I am short on USD. Long on GBP and CAD against USD. CNH has seen 200 ema cross over 50 ema so we will see the movement down. Price has also came to retracement on 4hr time period. BIG Ws. Stay tuned will be updating tmr when news drop 8:30am EST New York session

USDCNH top-down analysis Hello traders, this is the full breakdown of this pair. We will take this trade if all the conditions are satisfied as discussed in the analysis. Smash the like button if you find value in this analysis and drop a comment if you have any questions or let me know which pair to cover in my next analysis.

USDCNH | Perspective for the new week | Follow-up detailsEven though we held on to a 400pips move in our direction since my last publication on this pair; a sudden breakdown of Channel and Trendline coupled with the appearance of a Head & Shoulder pattern (see previous publication in the link below for reference purposes) insinuates a bearish momentum is imminent.
Further consolidation amidst a mixed outlook remains the perspective of the market in the last couple of months and the momentum garnered by the buyers (correction phase) appears to be thinning out as the successful breakdown of Bullish Trendline insinuates a risk of further decline for the Greenback in the coming week(s).
Tendency: Downtrend (Bearish)
Structure: Breakdown | Trendline | Reversal pattern (Head & Shoulder/61.8% retracement)
Observation: i. The Bearish Impulse which started in April 2021 went through a correction phase in the last 3 months to culminate @ CNY6.5300 area - an area that coincides with a 61.8% retracement of AB Leg.
ii. The appearance of a baseline with three peaks, where the outside two are close in height and the middle is highest reveals a Head & Shoulders pattern describing a formation that predicts a bullish-to-bearish trend reversal.
iii. During the course of last week trading session, we witnessed a significant rejection of CNY6.51000 level (2nd Head) which led to a confluence characterized by a breakdown of both Trendline and Key level @ CNY6.48500 hereby inciting a Bearish potential for me.
iv. In as much as I am comfortable taking a sell position anywhere below my Key level, the degree of accuracy to this bias is expected to be confirmed once the price breaks down the Neckline @ CNY6.45000.
v. A further breakdown of the Neckline might transpose into a Harmonic pattern (AB = CD) with extensions of CD leg aiming at CNY6.28000 area (127.2%) and a window to add to our existing position at Breakdown/Retest of CNY6.42000... Trade consciously!😊
Trading plan: SELL confirmation with a minimum potential profit of 750 pips.
Risk/Reward : 1:6
Potential Duration: 7 to 14days
NB: This speculation might be considered to make individual decisions on the lower timeframe.
Watch this space for updates as price action is been monitored.
Risk Disclaimer:
Margin trading in the foreign exchange market (including commodity trading, CFDs, stocks etc.) has a high risk and is not suitable for all investors. The content of this speculation (including all data) is organized and published by me for the sole purpose of education and assistance in making independent investment decisions. All information herein is for your reference only and I take no responsibility.
You are hereby advised to carefully consider your investment experience, financial situation, investment objective, risk tolerance level, and consult your independent financial adviser as to the suitability of your situation prior to making any investment.
I do not guarantee its accuracy and is not liable for any loss or damage which may result directly or indirectly from such content or the receipt of any instruction or notification therewith.
Past performance is not necessarily indicative of future results.

ridethepig | CNH Market Commentary 22.08.2021Buyers position marks (5) as a soft and temporary floor.
Other events can cause the base to appear a lot stronger than it does, so the transfer of the attack from one direction to the other can be subtle, although not a matter of pure chance.
It has been a relatively straight forward flow, but one that has not seen much light thrown on the subject thanks to noisy explanations. As can be seen in the charts below, @ridethepig was concerned at the highs.
The said possibility of a temporary floor is much rather a natural profit taking move in the struggle against sentiment. A considered judgement about the perverse signally from PBOC and Xi ought to look something like; base at 6.35xx is strong support (after the powerful legs lower it is very sensitive). That is the real truth, we are inside a multi-year decline that could go a lot. lot lower, for now, we shall have to content ourselves with limiting adding short positions till we are back above (4) highs at 6.587x for another test of the lows in our current range (6.58x - 6.40x).

USDCNH Facing bullish pressure | 25 Aug 2021USDCNH reacting above ascending trendline support. With price breaking above moving average, we see a possibility of a further push up above our entry at 6.47452 towards graphical overlap resistance at 61.8% Fibonacci retracement and our take profit at 6.49267
Any opinions, news, research, analyses, prices, other information, or links to third-party sites contained on this website are provided on an "as-is" basis, as general market commentary and do not constitute investment advice. The market commentary has not been prepared in accordance with legal requirements designed to promote the independence of investment research, and it is therefore not subject to any prohibition on dealing ahead of dissemination. Although this commentary is not produced by an independent source, FXCM takes all sufficient steps to eliminate or prevent any conflicts of interests arising out of the production and dissemination of this communication. The employees of FXCM commit to acting in the clients' best interests and represent their views without misleading, deceiving, or otherwise impairing the clients' ability to make informed investment decisions. For more information about the FXCM's internal organizational and administrative arrangements for the prevention of conflicts, please refer to the Firms' Managing Conflicts Policy. Please ensure that you read and understand our Full Disclaimer and Liability provision concerning the foregoing Information, which can be accessed on the website.

USDCNH-Expecting 3 wave structure and now we are in C wave of 2)Market Commentary:
LEARNING ELLIOTT WAVES IS LITTLE BIT TOUGH (FOR ME IN BEGINNING) BUT I TOOK IT AS A CHALLENGE AND THAT IS NOT IMPOSSIBLE ALSO...
First have an look for the positional trend i shared here previous....if you are a follower of me...and sometimes i will share the counter trend trade also in 15 mins and 1hr...but that is risky ones...so if the trend is bearish or bullish, if i am expecting the correction...book the profit there and wait the correction to end and again go with the trend....DONT TRADE THE COUNTER TRADE SETUP...you will took loss too...try to identify the short term pull back and the long term pull back after that took small lots in the short term PB with strict stop and go with big lots in the trend side that is long term. I WONT TOOK ALL THE TRADE PLAN SHARED HERE...
Read the market commentary inside the chart what i shared here carefully and try to learn Elliott waves...otherwise its tough to understand the market commentary and my analysis. I wont give a entry, stop loss and take profit in my chart...it is only for EDUCATIONAL PURPOSE and i am sharing how i am analysing the pair and labelling them according to the Elliott wave theory...I AM JUST SHOWING THE TREND HOW IT MAY GO AND MY VIEW(it may wrong too)..so DON'T FOLLOW BLINDLY MY CHART. Take this as a reference and if it correlate to you strategy took the trade as per your strategy...DON'T ASK ABOUT YOUR RUNNING TRADES i wont comment on them and I WONT SUGGEST TO TAKE MY TRADE SETUP.
I am a technical analyst based on trendline, channel, fib retracements, expansion, stochastic for divergence, EMA's and MA's are finding the pull backs and MAJOR IS ELLIOTT WAVES...those mentioned above are using as a TOOLS only. I am not a fundamental, sentimental trader...but only the fundamental will boost my technical analysis to reach my target or sometimes it will go against me and then i will manage the trade according to the Elliott waves alternate views...Each and every trade plan i am sharing here has a alternate view and i am sharing only the most probabilities(70-80%) here...sometimes the other (20-30%) may market do..then i will change the wave counts and labelling according to the price action.
All labelling and wave counts done by me by manually and i will keep change according to the LIVE MARKET PRICE ACTION. So dont bias, hope on my trade plans...try to learn and make your own strategy...Following is not that much easy...I AM NOT RESPONSIBLE FOR ANY LOSSES IF U TOOK THE TRADE ACCORDING TO MY TRADE PLANS....THANKS LOT..CHEERS

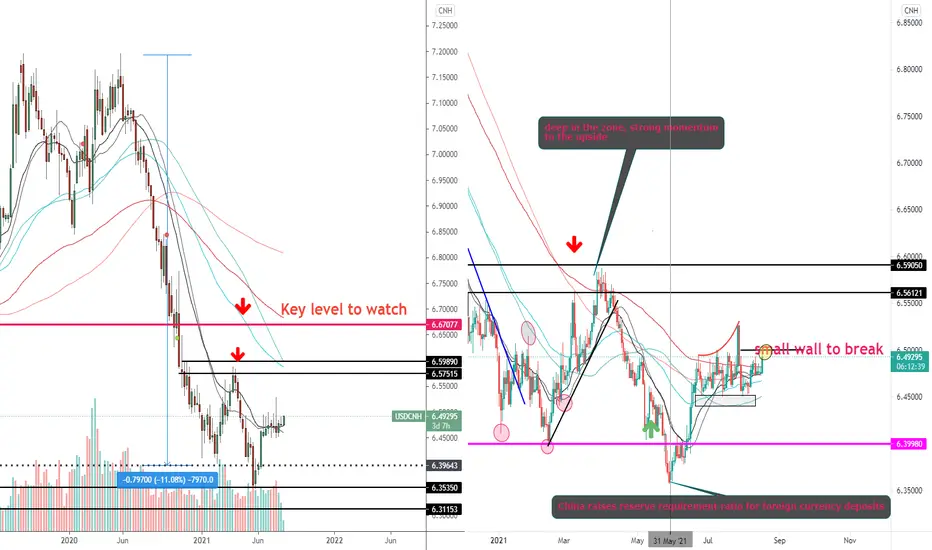
JICPT| USDCNH rising with small wall to break! Hello everyone. No need to mention the impact of the recent weak China data. We already saw the fall of its domestic stock markets, HK stock market, crude oil and commodity currencies, e.g. AUD.
On the weekly chart of USDCNH, if formed a nice bullish structure with trouble zone around 6.57.
On the daily timeframe, the bullish flag formation plus the neck retest are really odds-enhancer. Targets are 6.52 followed by 6.57 aligned with the weekly chart.
Give me a like if you're with me.
USDCNH - Dollar The KingUSDCNH breaking out from the box! I am expecting a huge rise incoming, and USDCNH would probably extent all the way to 6.58ish level! Let's see what happens next!

Best future investment comes with a criteria We been following this pair since the beginning unfortunately we missed the best opportunity in the currency to sell the high here n is very bitter over it and waited for a retest n which it never did so we didn’t chance the market even though it preformed unbelievable well and is the most bearish currency pair. Thus it’s a easy 3k pip drop lower but we are more interested in a possible reversal giving us the cheapest price. In which we’ll need to see all these factors play to the tee on the monthly. I
1. Monthly trading in oversold of 33.3 on the rsi
2. Price to trade in the oversold at least between the zone here which is the rsi extreme of the pair
3. A push out the stochastic mom, making a failure high and then a drop back low to its oversold but with a less duration giving a failure swing
4. Where we want to see a double bottom materialize on the rsi and on price
Then we will buy this market with no risk and all rewards
Outside if this any buying will slap you in the face for all the buy posts here trying to buy the strongest bearish market in forex. When there are bears waiting for a pullback.
And what happen at each buy up?
But gl

USDCNH is likely to breakdown Hi Traders, USDCNH has made a false breakout to the upside and then return back. It has made another consolidation below support and tested as a resistance and likely breakdown to continue it's donwtrend.

BUY USDCHN FOR SHORT TERM TARGETSBUY USDCHN AT CURRENT LEVELS AS IT IS FORMING ASCENDING CHANNEL FROM ITS LOWER LOW AND HONOURING THE TRENDLINE SUPPORT AS WELL.
TRADE WITH STRICT SL.

USDCNH | Perspective for the new week | Follow-up detailsAfter been stopped out of the bearish expectation on my last speculation on this pair (see link below for reference purposes); the price found bullish potentials as it broke out of descending channel to find a new high.
Despite the new digital yuan tendency of increasing the international usage of China’s national fiat, I am of the opinion that the positive momentum noticed during the Breakout of Bullish rectangle (CNY6.45000 and CNY6.50000 range) on the 27th of July 2021 is a bullish sign and has the potential of extending to the CNY6.5500 level and beyond in the next couple of weeks.
Tendency: Uptrend (Bullish)
Structure: Breakout | Supply & Demand | Channel
Observation: i. CNY6.5000 level which has been a significant zone that resisted price action in the last 3 months was finally broken with a bullish engulfing candle and I suppose this event reveals a bullish momentum building up behind the scenes.
ii. Bullish Rectangle: In the last 40days, the price has been moving between horizontal support and resistance levels (CNY6.45000 and CnY6.50000), a feat indicating there has been no trend.
iii. The Breakout of the rectangle on the 27th of July is presently considered a false one considering the two bearish engulfing candles that followed it.
iv. Despite the bearish run following the breakout, price is still contained within the rectangle hereby fortifying hopes of a second breakout.
v. Above Key level @ CNY6.46000 remains a comfortable zone for selling the Chinese Yuan in the coming week with possibilities of the second breakout of CNY6.495000 welcoming an opportunity to add a position.
vi. I have also noticed that since finding a bottom @ CNY6.35000, there is the appearance of an Ascending channel where price formed two positive sloping trend lines drawn above and below a price series (resistance and support levels) detailing an uptrend in price.
vii. It is also worthy to note that, the Key level @ CNY6.46000 is a significant level for bullish momentum as it has a memory for buying power as far back as 2016 (see weekly chart below).
viii. A further Breakdown/Retest of CNY6.53000 might welcome addition to the existing position... Trade consciously!😊
Trading plan: BUY confirmation with a minimum potential profit of 800 pips.
Risk/Reward : 1:4
Potential Duration: 7 to 15days
NB: This speculation might be considered to make individual decisions on the lower timeframe.
Watch this space for updates as price action is been monitored.
Risk Disclaimer:
Margin trading in the foreign exchange market (including commodity trading, CFDs, stocks etc.) has a high risk and is not suitable for all investors. The content of this speculation (including all data) is organized and published by me for the sole purpose of education and assistance in making independent investment decisions. All information herein is for your reference only and I take no responsibility.
You are hereby advised to carefully consider your investment experience, financial situation, investment objective, risk tolerance level, and consult your independent financial adviser as to the suitability of your situation prior to making any investment.
I do not guarantee its accuracy and is not liable for any loss or damage which may result directly or indirectly from such content or the receipt of any instruction or notification therewith.
Past performance is not necessarily indicative of future results.

USDCNH top-down analysisHello traders, this is the full breakdown of this pair. We will take this trade if all the conditions are satisfied as discussed in the analysis. Smash the like button if you find value in this analysis and drop a comment if you have any questions or let me know which pair to cover in my next analysis.

USD/CNH Ichimoku Cloud AnalysisLong positions above 6.4940 with targets at 6.5795 & 6.6650 in extension.
Pivot: 6.4940
Comments: Chikou breakout, tenkan kijun cross, kumo cloud twist

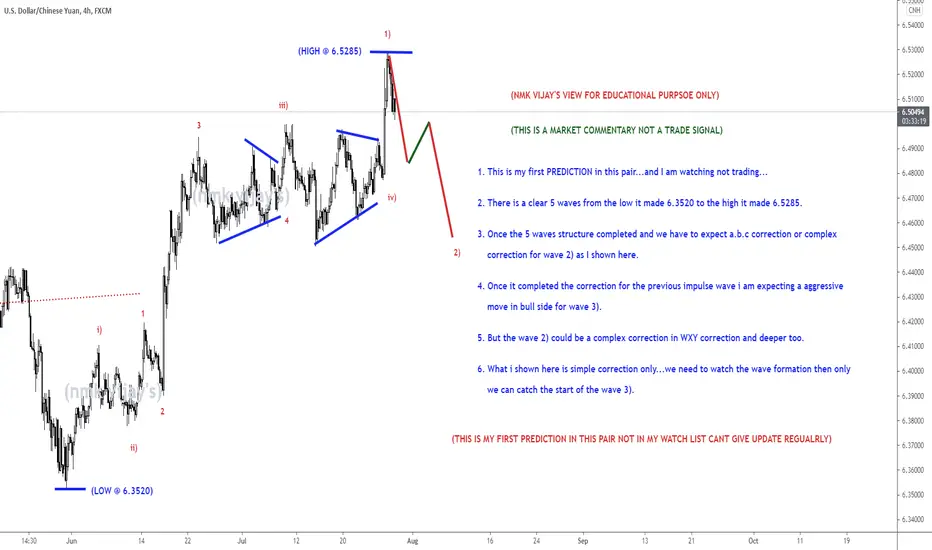
USDCNH-5 waves completed for wave 1) and expecting wave 2) ...Market Commentary:
LEARNING ELLIOTT WAVES IS LITTLE BIT TOUGH (FOR ME IN BEGINNING) BUT I TOOK IT AS A CHALLENGE AND THAT IS NOT IMPOSSIBLE ALSO...
First have an look for the positional trend i shared here previous....if you are a follower of me...and sometimes i will share the counter trend trade also in 15 mins and 1hr...but that is risky ones...so if the trend is bearish or bullish, if i am expecting the correction...book the profit there and wait the correction to end and again go with the trend....DONT TRADE THE COUNTER TRADE SETUP...you will took loss too...try to identify the short term pull back and the long term pull back after that took small lots in the short term PB with strict stop and go with big lots in the trend side that is long term. I WONT TOOK ALL THE TRADE PLAN SHARED HERE...
Read the market commentary inside the chart what i shared here carefully and try to learn Elliott waves...otherwise its tough to understand the market commentary and my analysis. I wont give a entry, stop loss and take profit in my chart...it is only for EDUCATIONAL PURPOSE and i am sharing how i am analysing the pair and labelling them according to the Elliott wave theory...I AM JUST SHOWING THE TREND HOW IT MAY GO AND MY VIEW(it may wrong too)..so DON'T FOLLOW BLINDLY MY CHART. Take this as a reference and if it correlate to you strategy took the trade as per your strategy...DON'T ASK ABOUT YOUR RUNNING TRADES i wont comment on them and I WONT SUGGEST TO TAKE MY TRADE SETUP.
I am a technical analyst based on trendline, channel, fib retracements, expansion, stochastic for divergence, EMA's and MA's are finding the pull backs and MAJOR IS ELLIOTT WAVES...those mentioned above are using as a TOOLS only. I am not a fundamental, sentimental trader...but only the fundamental will boost my technical analysis to reach my target or sometimes it will go against me and then i will manage the trade according to the Elliott waves alternate views...Each and every trade plan i am sharing here has a alternate view and i am sharing only the most probabilities(70-80%) here...sometimes the other (20-30%) may market do..then i will change the wave counts and labelling according to the price action.
All labelling and wave counts done by me by manually and i will keep change according to the LIVE MARKET PRICE ACTION. So dont bias, hope on my trade plans...try to learn and make your own strategy...Following is not that much easy...I AM NOT RESPONSIBLE FOR ANY LOSSES IF U TOOK THE TRADE ACCORDING TO MY TRADE PLANS....THANKS LOT..CHEERS

USDCNHUSDCNH in the descending channel. It forms the small bullish triangle and bearish ascending wedge inside.
☝🏻 More and more countries have trading relationships with China. It may:
- make the yuan more and more popular;
- put the dollar under structural pressure;
- increase tensions between China and the United States.
Best regards EXCAVO

Is USDCNH starting to build an inverse Head & Shoulders Pattern?After forming a beautiful double-top formation above 7 coming into 2020, we saw a fabulous downtrend in line with the USD weakness of 2020. But as Echo & The Bunnymen sang " Nothing ever last forever" and is that now the case with the USDCNH Monthly chart?
Do we see the start of a possible inverse Head & Shoulders pattern building here? Or just the start of summer malaise?
Id like to see price trade through 6.58 first, and then slide to approx 6.45 region which would back my theory. Watch and shoot over the next few months!

USDCNH top-down analysisHello traders, this is the full breakdown of this pair. We will take this trade if all the conditions are satisfied as discussed in the analysis. Smash the like button if you find value in this analysis and drop a comment if you have any questions or let me know which pair to cover in my next analysis.

USDCNH top-down analysisHello traders, this is the full breakdown of this pair. We will take this trade if all the conditions are satisfied as discussed in the analysis. Smash the like button if you find value in this analysis and drop a comment if you have any questions or let me know which pair to cover in my next analysis.


Weekly Out Look For USDCNH,FX:USDCNH
Same Process The MAEST Formula
#1 M = MARKET STRUCTURE ( Declining Stage USDCNH 1D-TF )
#2 A = AREA OF VALUE ( Price is at area of previous resistance, could potentially b resistance again )
#3 E = ENTRY TRIGGER ( Previous daily candle close fromed a tweezer top )
#4 S = STOP LOSS ( you set SL 1ATR avbove the daily range or 25pips above the daily range from entry )
#5 T = TAKE PROFITS ( Set a target 🎯 TP at the nearest swing lows )
More clues, as long as I'm concerned we are still in declining stage ( Market Structure ) so I will be looking for SHORT signals at daily areas of value
wait for it to act at those levls then I follow the Price.
And if price close below 6.45400level and sustain below it, the only thing I will be waiting for is a break of the daily trendline to finally go
SHORT.
With, Entry Stop Loss and Take Profits as shown.
Your HomeBoy
01Kim's FX
