USDCNH: UPDATE FROM LASTCALLPrevious posting of 3 of 3 down is negated because of overlap of minor ii exceeded the start of i. The structure now suggests a probable wave a and wave b are formed and a downswing for wave c.
There are other possible outcome from this current structure which is also a possible triangle pattern. if so, then the latest low must not be breached and has bullish implication.
Watch for development
USDCNH trade ideas

USDCNH: Triangle Pattern Targets 8.03 Consolidation on the weekly chart has shaped the well-known Triangular pattern (yellow).
Watch the breakout of the upside barrier around 7.3650 for confirmation.
The target is located at the height of the widest part of Triangle added to the upside of the pattern. It's 8.03 CNH/$1

USDCNH Going Up Hi there,
USDCNH is above the RSI level of 50 and the RSI moving average, indicating a bullish trend as it heads toward the supply area.
If the price breaks through the supply area, it could potentially rise even higher. However, I anticipate a possible rejection at that level, which may bring prices down to the 6.6-6.5 range.
Have a great week,
K.

USDCNY | Market outlook
The USD/CNY strengthened on Tuesday as a stronger U.S. dollar and concerns over a weak Chinese economy put pressure on the Yuan.
Recent data from China revealed that manufacturing activity fell to a six-month low in August, while growth in new home prices also slowed during the same period.
Additionally, the property sector has yet to respond positively to Beijing's series of stimulus measures, continuing to drag down the overall economy.

1 november 2024 11:10 AM Usdcnh chartTechnical Price action
time frame : 15 m
Technical approach : (resistance & support ) _ uptrend CHANNEL_
My idea is uptrend.
SUPPORT prices : 7.1200
RESISTANCE prices : 7.1450 & 7.1500

usdcnh analysistime frame 15 min
range cycle
31 october 2024
11:00 AM
Usdcnh chart
Technical Price action
time frame : 15 m
Technical approach : (resistance & support ) _ uptrend CHANNEL_resistance 7.1460_
My idea is uptrend.
SUPPORT prices : 7.1180
RESISTANCE prices : 7.1460 & 7.1600

usdcnh sidewayusdcnh
28 October 2024
Usdcnh chart
Technical Price action
time frame : 15 m
Technical approach : (resistance & support _ momentum ) _ FAKE BREAKOUT from 7.1450 - Reaction to dynamic trendline and break weak resistance (7.1450) - support (7.1250) midline. sell target is (7.1250) buy target is (7.1600).
My idea is downtrend yet. support area midline (7.1250) and strong bullish to target (7.1600)
Is in sideway yet.
SUPPORT prices : 7.1250 & 7.1100
RESISTANCE prices : 7.1600

Dollar-yuan might continue up but probably not immediatelyBeyond recent changes in monetary policy, the yuan has received some support from news that major Chinese banks have been actively selling dollars to try to support the currency. The market is waiting for further details on the fiscal stimulus announced last month.
The 38.2% weekly Fibonacci retracement around ¥7.11 seems likely to hold as a short-term support in the next few days unless significant news reaches markets or there’s further clear strengthening by yields from American bonds. The bounce from below ¥7 at the end of last month was quite vigorous and supported by volume; this would usually suggest the possibility of an ongoing uptrend. The golden cross of the 20 SMA above the 50 from Bands came with a fairly high angle.
Now that there’s some evidence of buying saturation, though, further immediate gains seem less clear. It’s still a fair way to go to reach the 23.6% Fibonacci retracement and the 100 and 200 SMAs are likely to be dynamic resistances to some extent before that. Consolidation seems to be possible ahead of American GDP on 30 October, but beyond that ongoing gains seem possible if the data support them.
This is my personal opinion which does not reflect the opinion of Exness. This is not a recommendation to trade.


What If China Recovery Isn't Happening Just Yet?Fundamentals & Sentiment
CNH:
- PBoC cut the rate; other stimulus measures
USD:
- Recent strong data
- Cautious, "balanced" approach by the Fed
Technical & Other
- Chinese equities struggle to keep the upward momentum
Setup: TC(RTF)
Setup timeframe: 4h
Trigger: 1h
Medium-term: Up
Long-term: Down
Min target: Local high
Stop loss: 0.28%
Position size: 0.66R

Yuan Strength ContinuationFundamentals & Sentiment
USD:
- Middle East tensions reaction seems exhausted
- Mixed recent economic data
CNH:
- Relaxed restrictions on home buying should stimulate yuan demand
- Chinese stock market should drive the demand for yuan
Technical & Other
Setup: Other - S(RTF), No Stop Hunt
Setup timeframe: 4h
Trigger: 1h
Medium-term: Down
Long-term: Down
Min target: Local lows
Stop loss: 0.27%
Position size: 0.5R

A Long Trade I am in from a couple of Hours Ago. USD CNH
This trade has only just poked through the bearish Icimocku cloud which would be a sort of breakout trade if you want to take it.
A lot of traders buying the USD today. Maybe a sign of the times ahead when a flight to safety may still be the good ol' USD Greenback.
I am Long in several USD currency trades for 2 reasons. For example, USD CNH huge rr trade potentially and its a flight to safety if the stock market gets rough I am already parked there with a lot of my cash

Yuan is getting stronger by the weeks........I posted my prediction about shorting the USDCNH pair sometimes in November last year.......
Please read it here
This is an update of that post......
After breaking down the important 7 dollars price point, if the sell down continues which I believe it will, then the next 2 support level is 6.71 and 6.83. How long will it takes ? I don't know but for those who had followed me to short this pair, you may want to take partial profits and adjust your SL accordingly....... Congratulations !
Please DYODD

USDCNH looks further downAlthough dollar-yuan has been in a fairly clear downtrend since last month, it has gained pace in the last few days as the probability of another double cut by the Fed in November has increased slightly and the Chinese government is expected to announce further stimulus. For the time being, the price seems to have broken ¥7 firmly and momentum remains high.
How much lower it might continue depends on seasonality next week but also on saturation given that there’s a strong oversold signal from both Bollinger Bands and the slow stochastic. The 61.8% weekly Fibonacci retracement around ¥6.955 seems to be an obvious potential support; this was also an important area in December 2022 and February 2023. ¥6.70 might be the ultimate target for many long-term sellers because this was the source of January 2023’s bounce.
Whether and when the price might push that low depends initially on markets’ reaction to Chinese manufacturing PMI early on Monday morning as well as next week’s NFP. To the upside, the 50% weekly Fibonacci retracement slightly above ¥7.03 might cap any short-term bounce.
This is my personal opinion which does not represent the opinion of Exness. This is not a recommendation to trade.

USDCNH - Technical Analysis [Long Setup]🔹 USDCNH Analysis on 1HR chart
- The current Trend is Bearish
- Bullish divergence is present
- If HH is break we will take long position
🔹 Trade Plan
- Entry Level = 7.10808
- Stop Loss = 7.09450
- TP1 = 7.12170
- TP2 = 7.13520
🔹 Risk Management
- First TP is 1:1
- Second TP is 1:2
🔹 How to Take Trade?
- Only risk 2% of your portfolio
- Take 1% risk entry with 1:1 RR
- Take 1% risk entry with 1:2 RR
Like and subscribe to never miss a new idea! ✌🏼

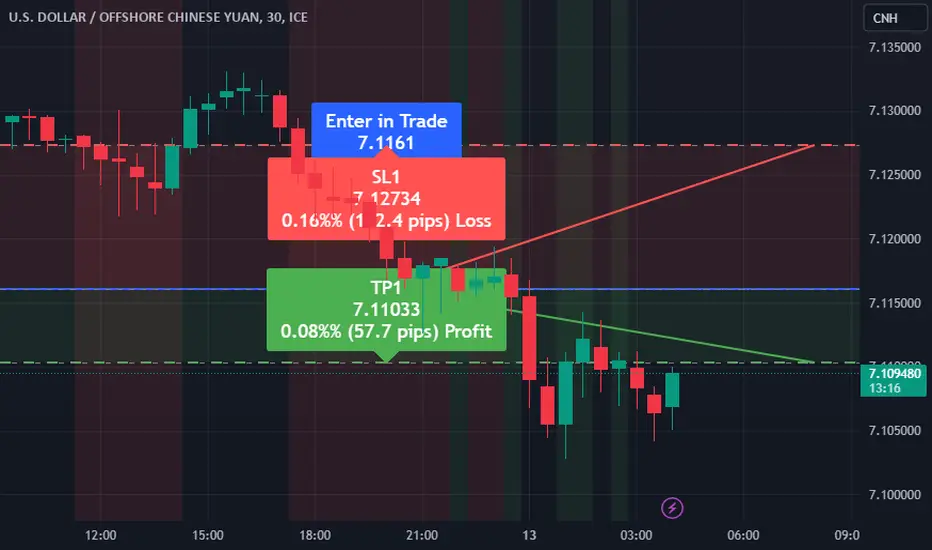
USDCNH Trade Signal: Sell RecommendationTraders,
We have a new signal for the USDCNH pair with the following details:
Direction: Sell
Enter Price: 7.1161
Take Profit: 7.11033
Stop Loss: 7.12734
Rationale:
This recommendation is based on our advanced analysis using the EASY Quantum Ai strategy. Several key factors have influenced our prediction:
1. Market Sentiment: Current market sentiment indicators suggest a bearish trend for the USDCNH pair.
2. Technical Analysis: Technical indicators such as moving averages and RSI (Relative Strength Index) are pointing towards a downward movement.
3. Economic Factors: Recent economic data and announcements related to both the US and Chinese economies have contributed to a weaker outlook for the USD against the CNY.
4. Recent Price Action: Observations in recent price action patterns also indicate potential for downside movement within the defined price range.
Please manage your risk accordingly and stick to the defined Stop Loss and Take Profit levels to optimize your trading strategy.
Trade safely,
EASY Quantum Ai Team
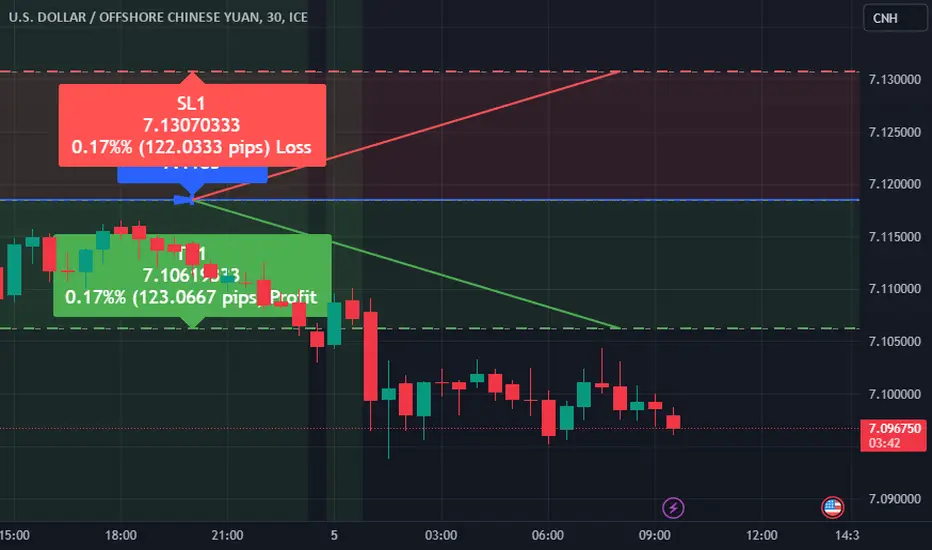
Trade Signal for USDCNHDirection: Sell
Enter Price: 7.1185
Take Profit: 7.10619333
Stop Loss: 7.13070333
We are issuing a Sell signal for the USDCNH currency pair. This decision is based on several critical factors analyzed by the EASY Quantum Ai strategy.
1. Technical Analysis: Recent chart patterns and indicators suggest a bearish momentum. Price action analysis shows a strong resistance near the 7.13070333 mark, facilitating a potential downturn.
2. Economic Data: Recent economic reports from the US and China indicate a strengthening of the Chinese Yuan. This strengthens the argument for selling USDCNH, as traders anticipate a shift in correcting overvaluation.
3. Market Sentiment: The current market sentiment appears to be risk-averse, which traditionally strengthens safer currencies like the Yuan over the US Dollar.
4. Algorithmic Forecasting: Our proprietary EASY Quantum Ai algorithm has signaled a high probability for a downward correction, aligning with other technical and fundamental factors.
Trade setup:
- Enter Price: 7.1185
- Take Profit: 7.10619333 ensures an optimized exit point based on expected downward momentum.
- Stop Loss: 7.13070333 safeguards against unpredicted volatility.
This configuration provides a balanced risk-reward ratio, making it a favorable setup for traders following our EASY Quantum Ai strategy.
Happy Trading!
USDCNH bearish outlooklooks like we could be heading to the downside on the weekly chart
what do you guys think?

China loses strength against the US with Trump (USDCNH)Today, Monday, the Asian market started lower against the US dollar following Donald Trump's shooting over the weekend. The Japanese "Ocean Day" holiday celebrated on the third Monday of July, which is very important for the Japanese country, has led to moderate trading volumes without the Japanese market active. The Yen weakened slightly and on the alert of possible interventions by the Bank of Japan governor. Friday's close spurred Asian currencies to advance against the dollar on optimism of interest rate cuts by the Fed, but today the market turned around with weak Chinese GDP data causing the Yuan to lose strength.
The Trump assassination attempt has encouraged a return to safe havens causing the Dollar Index to move positive with the current price at 104.087. The chart appears to be partially replicating the movement of the USDCNH, throughout the month, with a correlation very close to 1.
As for the USDCNH cross, if we look at the chart the dollar has been gaining strength since the July 1st releases until this Friday. Since the Asian opening the dollar has created a gap down opening giving strength to the renminbi, currently holding at 7.2737 yuan per dollar. The current high zone is around 7.3106 with a low zone of 7.2570. The area through which the price has resisted falling the most is 7.2488, very close to the current checkpoint (POC) of 7.2572. The current RSI is in the mid 50.73% zone so there does not appear to be excessive volatility.
If Trump's political move continues to gain strength we will see a dollar that will seemingly continue to gain strength seeing the effect of the political attack. So it would not be unusual to see an escalation of dollar power over the yuan from the US election.
Ion Jauregui – ActivTrades Analyst
*******************************************************************************************
The information provided does not constitute investment research. The material has not been prepared in accordance with the legal requirements designed to promote the independence of investment research and such should be considered a marketing communication.
All information has been prepared by ActivTrades ("AT"). The information does not contain a record of AT's prices, or an offer of or solicitation for a transaction in any financial instrument. No representation or warranty is given as to the accuracy or completeness of this information.
Any material provided does not have regard to the specific investment objective and financial situation of any person who may receive it. Past performance is not reliable indicator of future performance. AT provides an execution-only service. Consequently, any person acing on the information provided does so at their own risk.

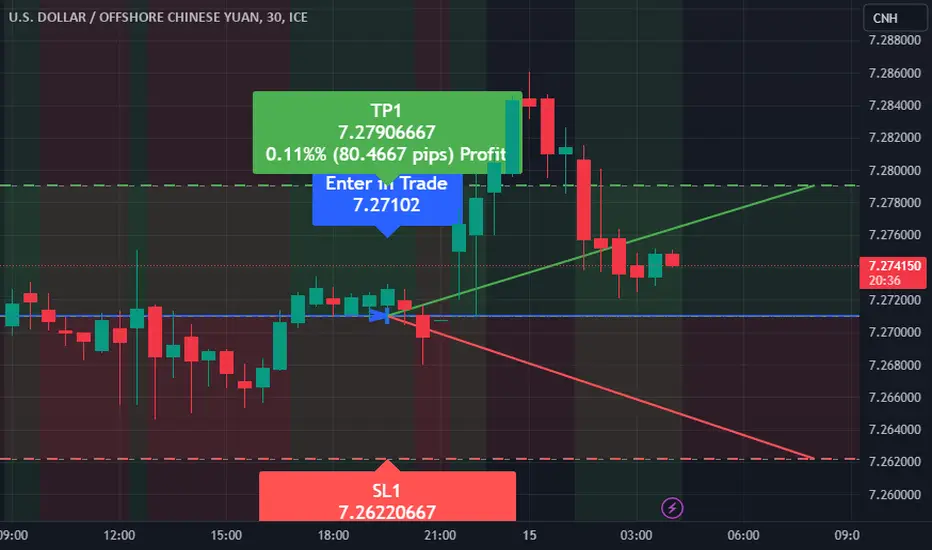
Trading Signal Alert: USDCNHAttention traders,
We have identified a buy opportunity for the currency pair USDCNH. Below are the trade details:
Direction: Buy
Enter Price: 7.27102
Take Profit: 7.27906667
Stop Loss: 7.26220667
This analysis is based on the EASY Quantum Ai strategy . The following factors contribute to this buy recommendation:
1. Momentum Indicator: Recent momentum indicators show an upward trend, suggesting strong bullish sentiment.
2. Support and Resistance Levels: Our analysis identified a strong support level close to the enter price, increasing the probability of an upward movement.
3. Market Sentiment: Market sentiment and trading volumes indicate a preference for buying within this price range.
4. Economic Data: Recent positive economic data from the U.S. compared to relatively stagnant data from China supports a stronger USD against the CNH.
Please, always apply proper risk management, and be mindful that no trading strategy guarantees success.
Happy trading!
Shorting USDCNH: Seizing the Opportunity Amidst Long Position...🚨 Shorting USDCNH: Seizing the Opportunity Amidst Long Position Surge 🚨
In this video, I explain why I'm shorting USDCNH due to a significant return of large long positions that we haven't seen in a long time. The 60-day bullish run seems to be over, and we're anticipating a potential drop.
Key points covered:
Analysis of the surge in long positions and its implications
Why the recent 60-day bullish trend is likely ending
Insights into the expected drop and its potential speed
Strategic approach to shorting USDCNH in this unique market scenario
While no one, including myself, can predict exactly how long this drop will last, I believe it will be quick. Join me as I break down the current market dynamics and share my strategy for capitalizing on this potential drop.
Don't forget to like, comment, and subscribe for more trading insights and expert analysis. Let's navigate this market opportunity together! 🚀💹 And remember to hit the Boost Button on this video to support our Trading View community!
Disclaimer: Forex trading involves significant risk and is not suitable for every investor. Carefully consider your financial situation and risk tolerance before entering any trade. Always perform your own research and seek advice from a licensed financial advisor if needed.

Sell USDCNHMACD H-A turning over
QQE crossover
Dragonfly doji into exhaustion candlestick pattern
Monthly Ichimoku cloud as profit target near $7.15

Hesitant PBoC and market disappointment Fundamentals & Sentiment
USD:
- "Wait and see" stance of the Fed
- Few positive data triggers
CNH:
- Not enough positive hard data to support China recovery narrative
- PBoC is ok with some depreciation of Yuan as long as it's gradual.
Technical & Other
Setup: TCB)
Setup timeframe: 4h
Trigger: 4h
Medium term: Sideways
Long-term: Down
Min target:
Risk: 0.28%
