USDCNH may have made a false breakout.This pair has already reached it's 2xATR while hitting this important daily key level. Watch 4H price action for long trade on this level
USDCNH trade ideas

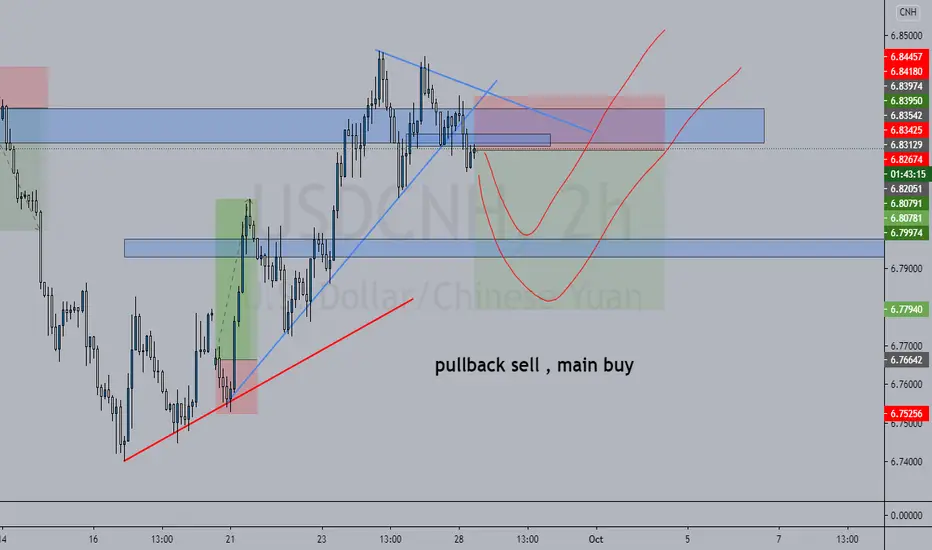
USDCNH path and direction Hello everyone
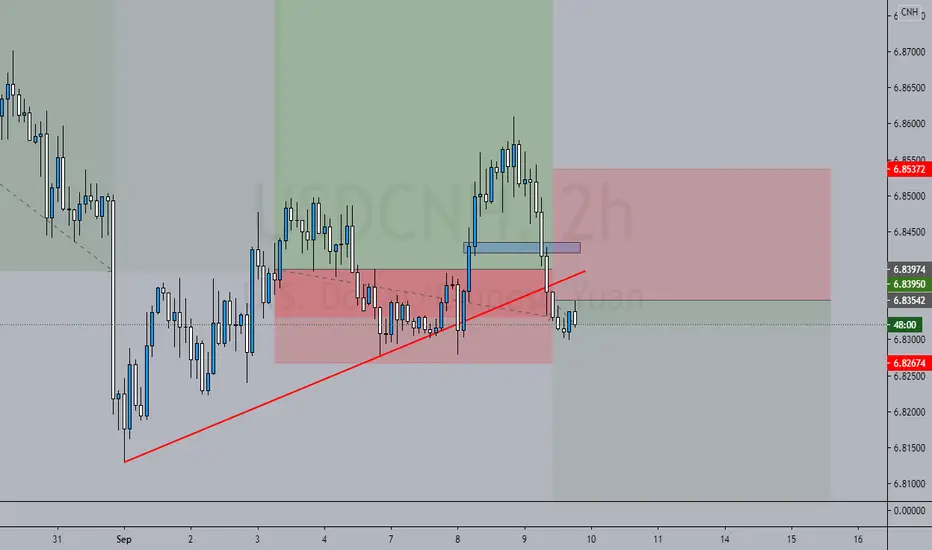
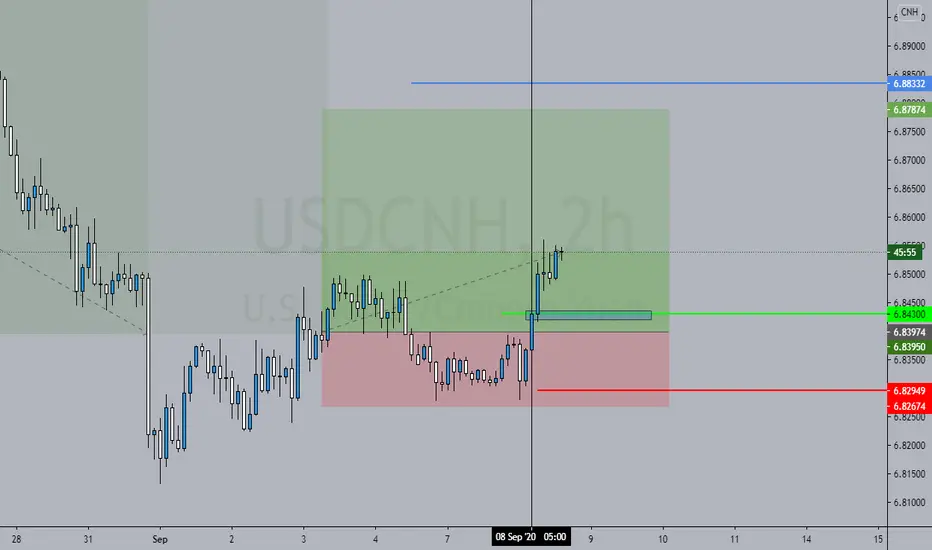
USDCNH broke a uptrend channel
and now we retested the broken uptrend we should expect a drop to the demand zones
or this could be a fake breakout and we head back into the channel
weekly candle close is very important
:) watch chart notes and feel free to ask any thing

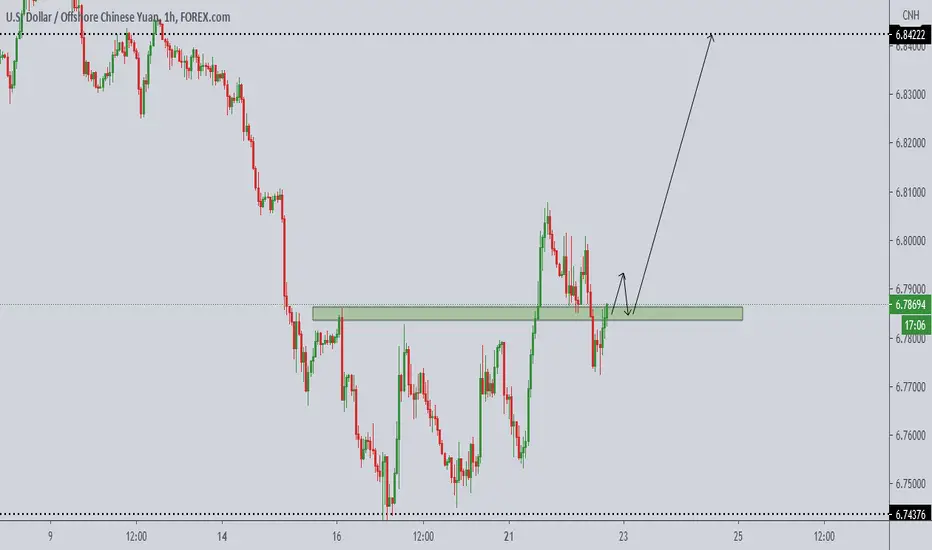
USD/CNH About to move higher.In this view of the chart we are eyeing an expansion on USD/CNH price gains. The lighter green line is the predicted price movement. Consolidation at current levels is nearly over.
Thanks for viewing ! This is not financial advice , please consider your own Due Diligence and Risk Management.

USDCNH trade long trade signalThis pair has given a opportunity to go long with a nice pin bar on the hourly and 4 hour has just closed above local trend line.

USDCNH is preparing for an explosive upward movementThis pair just have broken the local tend line and retested on 4H. It may start an explosive upward trend.

USD CNH BUY (US DOLLAR - CHINESE YUAN)Hi there. Price is forming a continuation pattern to the upside. Wait for the price to complete the pattern and watch strong price action for buy.

The CNH manages to force the USDCNH exchange rate to hold steadyAs evident on the chart, the Chinese yuan manages to force the USDCNH exchange rate to hold steady this Friday’s trading sessions. Despite that, the trading pair’s prices are still widely projected to continue its bullish route and gradually head on over to its resistance level in October. However, it’s worth noting that more experts are now getting convinced that Beijing is ready to let its currency strengthen against the US dollar. This raises speculations as to whether the yuan could actually become one of the biggest currencies in the coming months. On the other hand, the US dollar’s strength was strained by the latest news about Federal Reserve Chair Jerome Powell’s indication to aid or support small business and unemployed people in the United States. According to Powell, the US Congress should prioritize those groups if they were to reallocate the funds away from backstopping the central bank’s own emergency lending programs.
USD/CNH - Establishing the uptrendThanks for viewing! This is not financial advice , please consider your own Due diligence and Risk Management.


RidetheMacro| USDCNH Market Commentary 2020.09.22✅ The optimistic numbers have proved that the world’s second largest economy is steadily recovering from the virus slump. Notably, the pair has already been falling for the 6th week in a row, therefore the report has just added tailwinds to the yuan.
Moreover, the massive sell-off of the USD pushed the pair to the downside as well 📉.
📌 It’s impossible to ignore the US-China complicated relationship. There was some sign of improvement after the report of the successful phone call between two countries Recent weeks. China and the USA have promised to obey the phase-1 trade agreement, that encouraged investors.
Nevertheless, there is still some uncertainty ahead of the election of the US president in November, which may significantly affect Sino-American relations.
other side
📍 The Chinese central bank, the PBoC, kept the 1Y Loan Prime Rate at 3.85% and the 5Y Loan Prime Rate at 4.65%. The last time the central bank cut rates was in March.

USDCNH.... BE PREPARED!MULTI TIME-FRAME ANALYSIS DONE.
TRADE SHOULD ONLY BE TAKEN IF IT FITS YOUR IDEA OR PLAN.
TRADE SMART.
ridethepig | USDCNH Market Commentary 2020.09.22It is a well known phenomenon that the darling of 2020 has been the Yuan. An important difference operationally for China has allowed the sharp speculators to ride the flows in the endgame of an economic cycle.
We must first take a look at the outpost we spotted earlier in the year, the start of sellers activity. There are signs of some short-term dollar strength via risk which means the flows are becoming less simplistic in nature and will start to aggressively shake out the late retailers with awful entries.
The continuation from this position is also down to Fed. As US continue to print and finally artificially devalue the dollar we must also track the speed of which inflation returns. Those who believe in 2% inflation making a return will be tracking the supply side chains, rather than the demand side. Less tech advancements, a pullback in globalisation and increased government intervention are bearish for US and Chinese Equities.


Current Forex Watchlist: USDCNH, GBPCAD, and AUDCHFCurrently, I still think the USDCNH have been oversold. This is why I think a possible retracement can happen given the large dip. The GBPCAD and AUDCHF for the very short time being, still has some continued support levels to pickup. That being said, consider everything I say on an opinion based basis. Invest at your own risk and do your own due diligence.

FX Update: Chinese renminbi surge accelerates as USD wiltsThe late strengthening in the Chinese currency has taken on strong new momentum this week and may be behind some of the broader pressure on the US dollar ahead of an interesting Retail Sales report tomorrow as well as the FOMC meeting and the latest economic and policy projections after the US recovery has outpaced expectations from its June forecasts.
Trading focus:
The US dollar and in particular, whether the Chinese renminbi is the driver
USDCNH moving more aggressively – a rare show of more volatility in CNH than other major currencies..
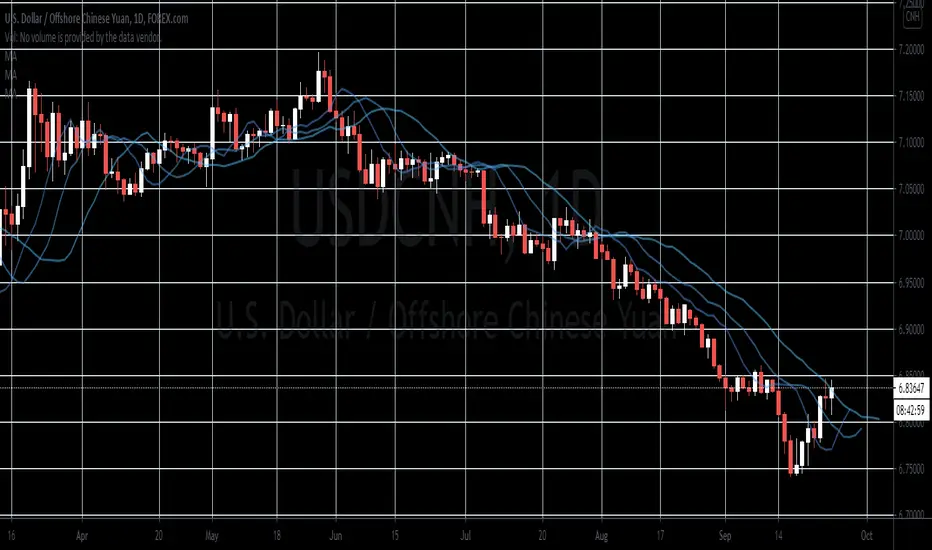
The sell-off in USDCNH has accelerated this week and even taken the exchange rate down through the 200-week moving average for the first time in more than two years. The move this week is a rare development, in that the CNY (and CNH) is strengthening more rapidly than other major currencies. What China’s intentions are here in taking its currency so much stronger versus the greenback are tough to discern, but its commodity buying binge means that it is paying less in CNY terms for its purchases and some tout that China is taking a tighter approach to stimulus than elsewhere to avoid bubbles in domestic asset markets.
The Chinese currency move is so aggressive that it may be behind the broader US dollar weakening in evidence ahead of tomorrow’s FOMC meeting. There is little anticipation that the Fed is set to bring new guidance to the table after recently rolling out the results of its long-term policy review and its intention to move toward an average inflation targeting (AIT) regime that would see it slow to react to any rising inflationary pressures, but the Fed can’t avoid making some impression of its stance as it will provide its latest projections for the economy and monetary policy for the first time since June, when the US economy was still in the very early days of the bounce-back from the COVID-19 outbreak.
Chart: USDCNH
The pace of the Chinese renminbi strengthening has turned more aggressive this week, as USDCNH sliced down through its 200-week moving average overnight and below 6.80 for the first time in over 2 years. It’s worth noting that the renminbi is launching a comeback from near its lowest levels in the official basket. A pair like EURCNH is worth watching for relative strength after that exchange rate broke above what appeared to be almost a ceiling near 8.00 stretching all the way back to 2017. After peaking above 8.30 at the end of July, that exchange rate is back down to 8.06.
Broader USD technical levels
As we await August Retail Sales and the FOMC meeting tomorrow (more on that above), we focus on the broader technical status of the US dollar after a rather weak consolidation period saw the greenback unable to take out important resistance. The focus for EURUSD is on the 1.1900-1.2000 zone after the pair found resistance right at the 61.8% retracement of the sell-off from the 1.2000+ at 1.1912.
Elsewhere, USDJPY is coiling interminably within a shrinking range and can’t help conjuring at least a false break soon – first levels there are 105.00 to the downside and 107.00 to the upside. AUDUSD had a poke at new local high overnight before fading a bit – underlining the sloppy and choppy upside trend – really needs to stick a close below 0.7200 to start breaking things there.
GBP still on edge as we await fate of Brexit Bill
Boris Johnson’s Brexit Bill, which would give the UK government the mandate to override portions of the original Brexit withdrawal agreement, has passed its first test in a long path before it can become a law, but this news was not met with any market reaction and the pressure on sterling has eased slightly, perhaps on a number of prominent UK Conservatives coming out to speak against the bill, while Boris Johnson insists that retaining the ability to move against parts of the withdrawal agreement is vital for leverage in negotiating the post-transition period trade deal, as he complains that the EU is leveling “absurd” threats in the latest round of talks. Support for EURGBP comes in at perhaps 0.9200-0.9175 and resistance in GBPUSD is perhaps 1.3000 or even a bit higher, given the size of the recent fall.
The G-10 rundown
USD – the greenback weaker, and most impressively in EM, with the USDCNH move in the driver’s seat there. Within G10, need to see if the FOMC meeting can move the needle tomorrow. Suspect it will be difficult to get strong directional momentum in the US dollar until post-election – generally looking for longer term downside potential with short-term uncertainty.
EUR – tough to build a strong case for the single currency as the EU is the new epicenter of COVID-19 cases, investors are unable to take European equities out of the range, and after the ECB meeting last week failed to spark more confidence in the currency. But lack of upside doesn’t mean downside, so bargain hunters may yet be frustrated.
JPY – someone wake us up when USDJPY close above 107.00 or below 105.00, until then merely looking for directional sympathy for USD and JPY in the crosses.
GBP – still waiting for a breakthrough in Brexit negotiations and whether Boris Johnson’s Brexit Bill can pass through parliament. Positioning in options market with call or put spreads the lowest risk way to trade a volatile move once the situation clears up either way in months to come.
CHF – weekly sight deposit data from the SNB out yesterday shows the bank continues to intervene and the recent EURCHF rally was once again unable to hold. Locally, watching whether the SNB allows the EURCHF rate to fall meaningfully below 1.0700 as well as whether the market will challenge the twice-tested cycle low in USDCHF near 0.9000.
AUD – the AUD marginally boosted overnight by the RBA minutes discussing the Aussie as “broadly aligned with its fundamental determinants” like higher commodity prices, they would like it lower. Strong Chinese data also a boost at the margin, together with firm commodity prices and the recent potent CNY rally. AUDUSD is frustrating to trade in the messy ascending channel – new highs don’t feed much additional momentum and bearish reversals don’t develop either.
CAD – the 1.3000 area in USDCAD is a critical chart point, with CAD held back a bit more here on the weakness in oil prices that doesn’t fit with strength in the commodities complex elsewhere. To the upside, the 1.3300-50 area is important resistance if USDCAD bears
NZD – last week’s AUDNZD rally from important support above 1.0800 has stumbled as the hurdle for the RBNZ to out-dove the competition seems to be quite high and will require an even stronger move into negative rates than the market is pricing for next year to impress.
SEK – EURSEK managing to find resistance near 10.40 as a bigger squeeze on SEK longs is avoided as long as risk sentiment generally stable even as wobbly EU outlook on COVID resurgence is one of drivers taking EURSEK off the cycle lows.
NOK – EURNOK has failed to burst higher to the next major resistance line above 10.75 as the oil sell-off has been corralled. The August Regional Network Survey for Norway was nothing to write home about – a tiny improvement to 0.19 from 0.08 in July.
John Hardy
Head of FX Strategy
Disclaimer
The Saxo Bank Group entities each provide execution-only service and access to Analysis permitting a person to view and/or use content available on or via the website. This content is not intended to and does not change or expand on the execution-only service. Such access and use are at all times subject to (i) The Terms of Use; (ii) Full Disclaimer; (iii) The Risk Warning; (iv) the Rules of Engagement and (v) Notices applying to Saxo News & Research and/or its content in addition (where relevant) to the terms governing the use of hyperlinks on the website of a member of the Saxo Bank Group by which access to Saxo News & Research is gained. Such content is therefore provided as no more than information. In particular no advice is intended to be provided or to be relied on as provided nor endorsed by any Saxo Bank Group entity; nor is it to be construed as solicitation or an incentive provided to subscribe for or sell or purchase any financial instrument. All trading or investments you make must be pursuant to your own unprompted and informed self-directed decision. As such no Saxo Bank Group entity will have or be liable for any losses that you may sustain as a result of any investment decision made in reliance on information which is available on Saxo News & Research or as a result of the use of the Saxo News & Research. Orders given and trades effected are deemed intended to be given or effected for the account of the customer with the Saxo Bank Group entity operating in the jurisdiction in which the customer resides and/or with whom the customer opened and maintains his/her trading account. Saxo News & Research does not contain (and should not be construed as containing) financial, investment, tax or trading advice or advice of any sort offered, recommended or endorsed by Saxo Bank Group and should not be construed as a record of our trading prices, or as an offer, incentive or solicitation for the subscription, sale or purchase in any financial instrument. To the extent that any content is construed as investment research, you must note and accept that the content was not intended to and has not been prepared in accordance with legal requirements designed to promote the independence of investment research and as such, would be considered as a marketing communication under relevant laws.
Please read our disclaimers:
Notification on Non-Independent Investment Research (www.home.saxo)
Full disclaimer (www.home.saxo)
Full disclaimer (www.home.saxo)

USDCNH - Further sell down expectedWe expect further sell-down of Dollar/Yuan as the 5th leg of wave C has yet to complete. Target buy will be at the demand region highlighted in blue.

China’s recovering economyDespite the recent upside faced by the exchange rate, it looks like the bearish trend isn’t over yet. The prices of the US dollar to the Chinese yuan exchange rate should continue to buckle and get lower, hitting its support line in the latter half of the month. The positive sentiment in China’s recovering economy is helping bearish investors keep the pair grounded in the trading sessions. Meanwhile, it was just recently reported that the United States President, Donald Trump, raised the idea of decoupling the two biggest economies. Trump suggested that separating the United States from China would not hinder the two powerhouses economically. This idea could hurt the US dollar as the recovery of the American economy can be tied to some of its businesses and activities with mainland China. With the presidential elections fast approaching in the US, the market is bracing itself to the possible outcome, whether it would be Biden or Trump again.


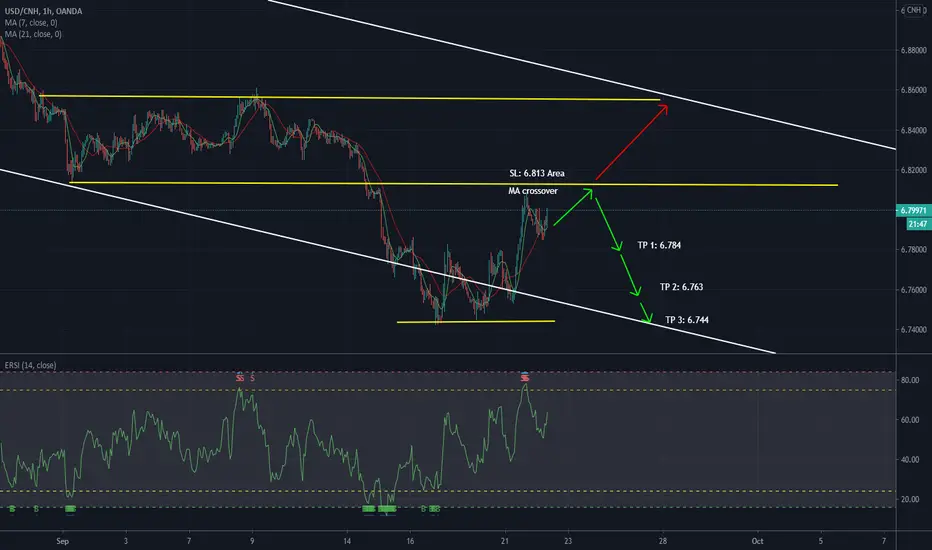
USDCNH Long IdeaThis is one of my favorite setups on the 4H Chart.
We are looking for RSI divergence at extreme levels - must be oversold on both lows, and must have divergence. We then look at the fibonnaci inversion for entry points.
