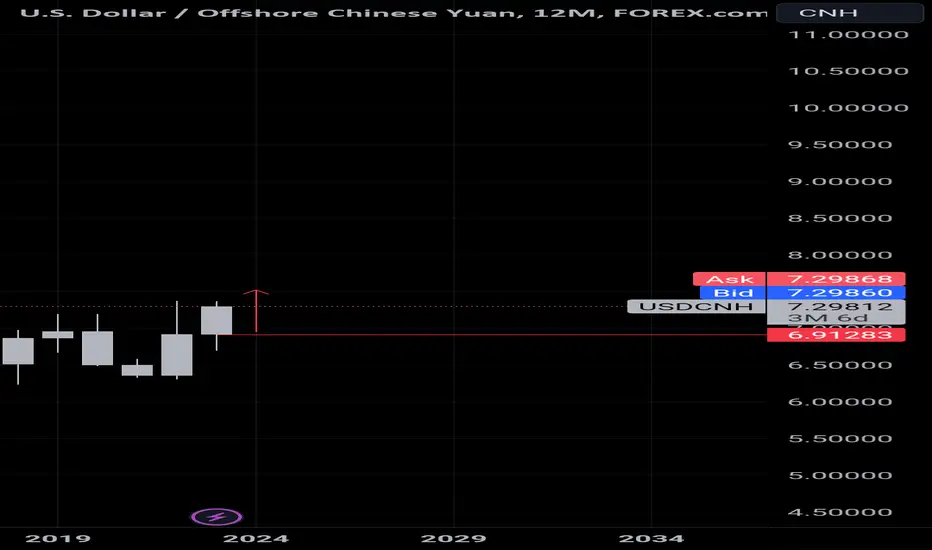
A simple way to chose your setup every yearPrice after fundamentals essentially goes up and down and focusing on the price opening of the year, one can then choose to focus if all setup to choose is long or short. A quick way to reduce your trades and focus solely on 1 thing is to see if current price is above or below the year's opening price.
Here for example, price moves away from this years open to the long direction, hence focus more on taking long orders in lower time frame.
Of course price moves a lot in the short term and this is not 100% guaranteed, but it simply is a way to filter out choices and focus more.
As this one provides pro for the usd this year, it is safe to go for long against chinese yuan this year than being a yuan bull.
Find long setups, be it ma, fibs, breakouts, support and resistance.
This year vs yuan, usd is stronger.
USDCNH trade ideas
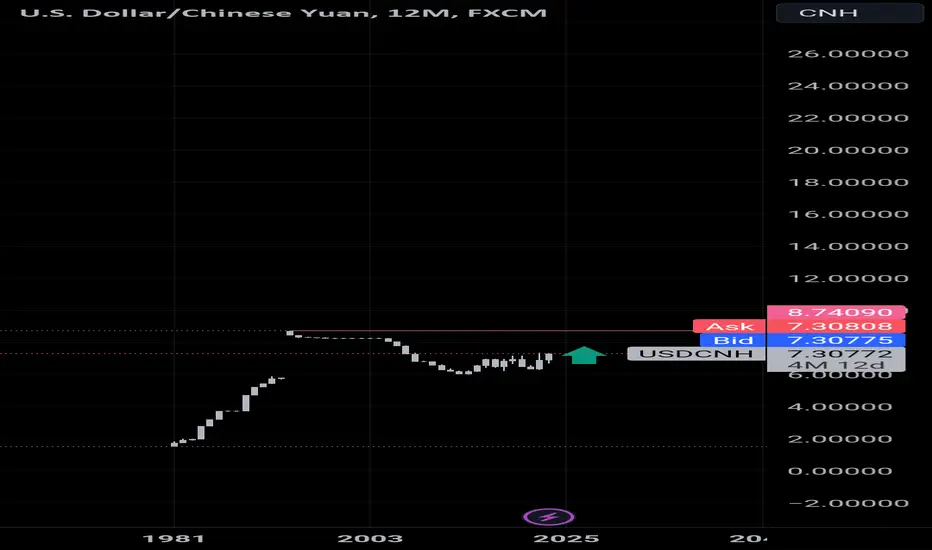
Usd may go further higher Levels above current price have historical bases of where price may go further.
It is a good speculative area. While the basi is indeed fat enough to hold the price from going down.

CNH/USD The future of fiat while innovation is in the talks CNH USD is looking like it is ready to take some more momentum. The system for how we spend our money is currently being renovated at a global scale, most places are affected to say the least. From the looks of it a descending scallop pattern has taken the chance to retest key support after the Discourse back in the last half of Q1. It could be a simple retest once again
but due to the scope of things there is uncertainty if you will.

Yuan Retreats from Multi-year Highs on Strong Economic Data The US dollar index hit its highest level since early March this week, but the yuan is one of the few currencies to rise against the USD over the period.
This was facilitated, among other things, by strong economic data published today:
→ Industrial production growth in August amounted to +4.5% in annual terms (expected +3.9). This is the strongest progress in 1 month since autumn 2022.
→ Retail sales in August increased by 4.6% year on year (expected +3.0%).
The chart shows that after a multi-year high (B) of about USD 7.36 per yuan set on September 8, the rate has retreated sharply. That is, sales of dollars (B→C) for yuan increased. And the sharp increase in A→B is completely leveled out. This is a bearish sign, indicating that the bulls have completely retreated.
Now the price is near the median line of the channel. Here one can expect support, which is also strengthened by the level of 7.275, which previously served as resistance.
Let’s say that if a rebound C→D occurs (its probability is indicated by the long lower shadows on the candles on September 14-15), then by its dynamics it will be possible to judge the sustainability of the initiative that the bears have taken. If the rebound is 50% of the momentum (B→C), this will confirm the change in sentiment to bearish, and then we can expect that sellers will be able to put pressure on the rate so that it will decline to the lower border of the channel.
And then the picture will be even more bearish, because a head-and-shoulders pattern will form on the chart along the 0-B-D vertices. Provided the positive news background regarding the Chinese economy continues, we will be able to witness the formation of a stable bearish trend in favor of the yuan.
This article represents the opinion of the Companies operating under the FXOpen brand only. It is not to be construed as an offer, solicitation, or recommendation with respect to products and services provided by the Companies operating under the FXOpen brand, nor is it to be considered financial advice.

USD/CNH looks set for its next leg higherUSD/CNH remains in a soliud uptrend on the daily chart and, after consolidating around the June highs and forming a bullish hammer at 7.25, the swing low appears to be in. A bullish range expansion day broke the bearish resistance line, and bulls could seek to enter upon any pullbacks towards yesterday’s low for a tigher long entry.
The bias remians bullish above Last weej’s hammer low, and we could now be heade for 7.35 or the 2022 high.
A small bulish hammer has also formed on the 1-hour chart. A conservative target projected from the recent leg higher suggests 7.32 for bulls, whilst if we use the run up from 7.27 it projects a target atound 7.34.

#usdcnh-Economic Strength: China is the world’s largest exporter and remains the second largest economy, behind the United States1. This economic strength can influence the value of the Yuan.
-Currency Control: China has used its control over its exchange rate to help ward off global financial crisis and maintain its dominant trade position1. This control can lead to stability in the currency.
-Market Depth: The offshore Renminbi (CNH) market has shown strong and consistent growth throughout the internationalisation process2. This growth can provide liquidity and market depth.
-Risk Management: Trading in USD/CNH futures can provide opportunities for hedging and risk management2.
-Trade War Considerations: The state of trade relations between the US and China can significantly impact the USD/CNH exchange rate3.
Please consult with a financial advisor or do thorough research before making any trading decisions

USDCNH: TECHNICAL ANALYSIS.Hello traders,
Wave A is supposed to end at 7.29166 zone. Then wave B is supposed to materialise towards
the resistance zone at 7.32987. After that wave C is supposed to materialise towards the
support zone at 7.20623.
Thanks.

USD/CNH Extends Gains Amid Firmer US Dollar and Geopolitical...USD/CNH Extends Gains Amid Firmer US Dollar and Geopolitical Tensions
The USD/CNH currency pair has been making significant strides, extending its gains for the fifth consecutive day during the Asian session on Friday. Trading around 7.3530, the pair is now approaching the resistance confluence at 7.3590. Simultaneously, the onshore Yuan (CNY) has reached a 16-year high at 7.3462 against the US Dollar (USD). These developments underscore the current strength of the USD, which has been bolstered by a consistent stream of positive economic data from the United States.
Firm USD Supported by Upbeat Economic Data
The recent performance of the USD can be largely attributed to the string of encouraging economic indicators emerging from the US. Notably, on Thursday, the release of data revealed that as of September 1, Initial Jobless Claims in the US had decreased to 216,000, a notable drop from the previous figure of 229,000. These numbers defied market expectations, which had anticipated an increase to 234,000. Furthermore, US Unit Labor Costs for the second quarter (Q2) surged to 2.2%, up from the previous reading of 1.6%, contrary to the expectation that they would remain unchanged.
These impressive economic figures have lent support to the USD, instilling confidence among investors and traders. As a result, the USD has continued to gain strength, influencing its performance against various other currencies, including the Chinese Yuan.
Geopolitical Tensions in Focus
In addition to the currency market dynamics, geopolitical developments are also impacting the USD/CNH pair. The upcoming G20 leaders' summit in New Delhi, scheduled to commence this Saturday, has garnered significant attention. US President Joe Biden is set to participate in the event, but notably absent from the guest list is Chinese President Xi Jinping.
Xi Jinping's decision not to attend the summit raises questions about the state of US-China relations. The absence of both leaders at a crucial global forum signifies the persisting strain in their bilateral relationship. It's worth noting that this comes amid ongoing tensions surrounding issues like trade, technology, and human rights, further complicating diplomatic efforts between the two superpowers.
The exclusion of China's top leadership from the summit may contribute to the prevailing geopolitical uncertainty, and the market will closely monitor any developments that could impact the global economic landscape.
Conclusion
The USD/CNH's recent winning streak, driven by a stronger US Dollar and reinforced by positive economic data, highlights the ongoing shifts in the currency market. As the pair approaches key resistance levels, traders and investors will closely watch for potential breakout opportunities. Simultaneously, the geopolitical backdrop, marked by the absence of President Xi Jinping at the G20 summit, adds an extra layer of complexity to the situation, underscoring the intricacies of global diplomacy and their potential influence on currency markets.
Our preference
The upside prevails as long as 7.26750 ( 78.6% Fibo ) is support.

Chinese Yuan Falls to Year's Low Why is the yuan falling?
→ Strong US dollar. Yesterday it became known that the number of applications for unemployment benefits in the US amounted to 216k for the week — below the forecast of 232k applications. This is the lowest level since February.
→ Worsening problems in the Chinese economy. Yesterday's data from the General Administration of Customs of the People's Republic of China showed that the volume of exports in August decreased by 8.8% in annual terms — the decline in exports is recorded for the fourth month in a row.
As the chart shows, the USD/CNH rate reached 7.36 today. According to some sources, this is not only the minimum for the yuan for 2023, but also the minimum for 16 years (it depends on whether the 2022 low is considered broken).
Bullish arguments:
→ The price is within the ascending channel. The dynamics develop in its upper part, which indicates the strength of the trend.
→ The price fell below 7.27 only for 1 day, forming a candle with a long lower shadow. The recovery occurred quickly, indicating the strength of demand.
→ The size of the B-C retracement corresponds to the size of 50% of the A-B impulse. This is the proportion for a normal correction within a stable trend.
→ 3 candles on September 5-7 can be classified as a bullish 3 White Soldiers pattern. Statistically, after the formation of the pattern, we should expect continued growth.
Bearish arguments:
→ If the trend continues, the rate may reach the upper boundary of the upper channel. There, the bulls can take profits, which will weaken the trend.
→ The FT reports the words of Ken Cheng, chief FX strategist for Asia at Mizuho Bank: “there is a growing likelihood that the People's Bank of China will adjust the currency band.” That is, as in the case of the yen, one should be prepared for government intervention in order to protect the currency.
This article represents the opinion of the Companies operating under the FXOpen brand only. It is not to be construed as an offer, solicitation, or recommendation with respect to products and services provided by the Companies operating under the FXOpen brand, nor is it to be considered financial advice.

US DOLLAR vs CHINESE YUANAfter the completion of the wave 4 downside correction, the dollar resumed its upward to complete the wave 5 of the same degree.

#USDCNH Mapping The Weekly 5 Wave SequenceIn this update we review the recent price action in the USDCNH and identify the next high probability trading opportunities and price objectives to target
PAST PERFORMANCE NOT INDICATIVE OF FUTURE RESULTS

USD/CHNThis pair will continue Bullish move.
Double bottom has been formed and a Pennant is pulling back the slingshot to send the price higher.
EMA 20, 50 and 200 Holding Bullish.
It will go back to 52 Weeks High (Dotted Yellow line) at 7.37500 in the short run.
Weekly chart is confirming this analysis.

USD/CNH Falls Amid Chinese Economic Stimulus Since January, the Chinese yuan has weakened more than 9% against the US dollar due to problems in the Chinese economy, as evidenced by statistics, as well as the bankruptcy of the developer Evergrande.
And today, the People's Bank of China announced that it will reduce the required foreign exchange reserve ratio to 4% from 6%, starting September 15. The move is seen as aimed at slowing down the yuan's fall.
Also, 5 major banks in China are cutting mortgage rates, possibly to reduce the risks of Country Garden going bankrupt.
According to analysts reported by Reuters, the measures taken may be only a temporary solution, but will lead to an increase in problems in the long term.
The chart shows that the USD/CNH rate has declined from the highs of April by approximately 1.4%, while:
→ the price of the US dollar against the yuan is in an uptrend and its median and bottom line can provide support;
→ the rate has support from the level of 7.24, which previously worked as a resistance;
→ the fact that on the first day of September the rate is below the lows of August may be due to the weakening of the US dollar index due to negative trends in the US labor market.
It is possible that the level of 7.24 will become a reliable base for the bulls, from which they will try to resume the main uptrend if the incentives from the Chinese authorities are not enough. Note that the last time the US dollar traded for 7.4 yuan was in 2007.
This article represents the opinion of the Companies operating under the FXOpen brand only. It is not to be construed as an offer, solicitation, or recommendation with respect to products and services provided by the Companies operating under the FXOpen brand, nor is it to be considered financial advice.

USD/CNH - potential swing trade longUSD/CNH remains within an established uptrend on the daily chart, and the US02Y-CN02Y spread has reached a new cycle high to suggest upside pressure could be building on USD/CNH.
Prices have retraced and are now trying to build a base around the June highs. Bulls could seek dips around the cycle lows with a stop below 7.25 in anticipation of a move to 7.35, the 2022 high or beyond.

Macro Economics- BRICS Oil Nations, GDPHi Traders, Investors and Speculators of Charts 📈💰
The 15th BRICS summit was held in South Africa from August 22-24, 2023. There have been some important updates that concluded from this summit and if you're an active trader / speculator in the Forex, stocks or commodities market, you NEED to know about this.
The BRICS countries (Brazil, Russia, India, China, and South Africa) now control 30% of the entire global economy. This is up from 17% in 2000 and 23% in 2010 . The BRICS countries are also home to 42% of the world's population.
Incase you missed the previous article, find it here:
BRICS Total GDP With New Members:
B razil: $2.08 trillion
R ussia: $2.06 trillion
I ndia: $3.74 trillion
C hina: $19.37 trillion
S outh Africa: $399 billion
Saudi Arabia: $1.06 trillion
Argentina: $641 billion
UAE: $499 billion
Egypt: $387 billion
Iran: $367 billion
Ethiopia: $156 billion
BRICS will now control 30% of the global economy.
If you're invested in any BRICS related stocks or Forex markets, this concerns you!
The summit outcomes are expected to lead to a weaker US dollar in the near term. This means that currencies against the dollar will strengthen. This is because the BRICS countries are collectively a major source of demand for commodities, such as oil and gold.
The outcomes of this summit lead to proposed increased investment in the BRICS economies. This could lead to higher demand for commodities, which would put upward pressure on commodity prices and the value of currencies of commodity-exporting countries, such as the Brazilian real and the Russian ruble. This would make the US dollar less attractive to investors, which could lead to a weaker dollar.
_______________________
📢 Show us some LOVE 🧡 Follow for daily updates and trade ideas on Crypto , Stocks , Forex and Commodities 💎
We thank you for your support !
CryptoCheck

USD/CNHHere is analysis for this chart.
1- This pair has formed a beautiful Double Bottom.
2- This formation is at the 52 Weeks High (Yellow dotted line).
3- EMA 20,50,200 are all showing Bullish move
4- Stochastic is above 50%, despite the Bearish move which is due to the pull back.
5- It has created a Pennant (flag) as a sign of pullback to continue the Bullish move.
Get ready for the breakout.

USDCNH MACD divergence In light of the divergence of the MACD indicator in conjunction with the recent stock brokerage fee adjustments and the Central government's approval of the top dogs to save the day, the USDCNH likely to reverse into the range of 7.2350.

Yuan longMultiple rejections of the 3 level and entry on 2.5 for a 1 to 3rr is my basic prediction for yuan.
For it couls still go up because of the unresolved fundamentals. Like yields didn't cut as much for loans, losing birthrate, and lack of foreign investment support on debt. Like evergrande, shadow banking, and dying house investments.
This is simply because china is losing population to replace the existing mechanism.
There needs a big change to revitalize the chinese dictatorship to move into a proper system of centrist merit.

Chinese yuan and the need to pay investorsYuan only has one problem. Will the Chinese economics be able to pay investors?
Because of the ongoing issues, this has yet to happen.
So for now, it is safer on the side of long until Chinese businesses shows foreign investment good faith by paying off investors what they owe.

Expecting 8.7 as possible yuan priceBecause of China business failure to deliver, i can only see it as a risky option.
But they could turn it around if they are able to pay off their debts. And probably by keeping their hands off the territories of other countries.
One thing for now is China yuan is going down.
USD/CNH - LONG; China is dead!... and it is about to roll over. E.g. Sell it ALL!!
This is the year (2023) to start the Long March (a familiar theme in Chinese history), to gain full stride, right into oblivion.
Namely, the Chinese demographic implosion which has been gathering speed for quite a while now, will hit that country with undeniable force, essentially halving the population in less than the next decade and a half.
This pretty much sums it up. (Why do you think they had the severe "Covid lock-downs", lasting for 3 years by now?! ...)
Whether China will go down swinging is yet to be seen however, the outcome is a foregone conclusion, in any case. (Short of some oracle which could create 800 million Chinese, overnight, all between the ages of 21-35. China's current "R Factor" - reproductive rate - is half that of Covid and its varieties. - Just to illustrate the point.)
The technical picture of this pair speaks for itself, as well, the pair landing/turning on massive support here. (Beijing couldn't allow the further appreciation of the Yuan without crushing an already imploding economy!)
As for the monetary picture; China's >600% credit expansion in barely a decade is abjectly absurd, even by the recent, excessively loose global monetary standards.
p.s. China had never had more than 70 consecutive expansion - or even stable - years in its 4000 year, illustrious history. The time has come, once again, with a well defined end in sight.

Clearly china is selling lots of bondsas you can see, the chart is almost identical in peaks and valleys to the us yields. Implying they are not selling bonds as heavily as their currency recovers, and are selling bonds as their currency is losing value, to help prop it up.
Rates could go quite a bit higher...

USDCHN rising on Dollar Strength Channel Breakout LONGThe idea is on this one-hour chart which has the DXY overlaid showing the dollar
as the strong currency also watching YINN rising and YANG falling
