USDCNY Possible DowntrendThe trend is trying to shift its prevailing direction seeing the price action making lower highs. Might fall around the older support zone.
USDCNY trade ideas

Big secret - when to buy & sell bitcoin (you decide) - UPDATEDUpdate to previous post 31st January 2020. NOT ADVICE. DYOR.


USDCNY 18032020Description in the chart!!
Price had regain the 6.96 critical level !! even PBOC cut rate
but US cut deeper rate and pump CREDITS into the system
Last year REPO CRISIS is a trigger but manage to solved with more CREDITS pump back into the system.
ASSETS price will surge with artificial CREDITS over the real value of the assets.
This world is mad with CREDITS.
How long will this system sustain?
Economy growth = productivity growth ( transaction velocity between good , service provided )
the faster the transactions is the better.
but with more CREDITS, productivity is down among the masses.
Lessons here is someone really need to pay for these mess. It doesn't make no sense.
NUMBER GAME to be continue...
Price = (real value + extra much of credits)

USDCNY D1The fall in oil prices is very actively stimulating the dollar to grow. The situation on the oil market does not have any specifics and stability, since the oil-producing countries could not agree among themselves, and sent the price to float freely. This can lead to an even greater fall in prices and, accordingly, to even greater growth of the dollar. The situation in China is critical for the country's economy. Corono virus forced the Middle Kingdom to close its borders, which in a very negative way affected the country's economy. China is the largest industrial country, which receives the main income from exporting products. Also, China attracts a lot of tourists who at the moment does not have the opportunity to visit the country. Due to the fall in business activity, the renminbi began to decline, which will continue until the situation stabilizes, as there is little demand for this currency now.


USD CNY is short ......jUST FOLLOW THE TREND... i should have posted by last week to go short on usd but couldnt sooo... time to get short

USD CNY.... china currency devaluationDollar has showed strength in and china needs a weak currency in order to deal with effects of corona-virus over there... so long USD


ridethepig | CNY Market Commentary 2020.02.16On the technicals there is little to update while the resistance holds, despite the bounce via PBOC intervention on coronavirus risk flows. The only level in play to the topside is 7.0248 as it caps the highs in the current wave. Anything above will unlock a leg towards the next barrier at 7.0733.
The coronavirus short-circuit sadly temporarily disrupted the USD devaluation / reflationary growth theme. I am still holding shorts and active looking for a test of the 6.825x. Anything below that will open the floodgates for the major break:
As usual thanks for keeping support coming with the likes and comments, we'll open up the short-term flow after the Tokyo open in the comments below for those trading live!


Coronavirus impacted Chinees yuan Coronavirus has damaged financial markets of China. Chinees stock droped almost 7%, economic grow with 2%. Of course Chinees yuan planged after market open today, now trading at 7.0202, next target 7.0719

Usdcny bullish reversal Following a weekly bullish engulfing candle stick pattern, price has jumped and we can see what seem to be an ascending channel we shall watch for further development on this as the bias remains bullish in the near term.

Big secret - when to buy & sell bitcoin (you decide)Using USDCNY (Caveat- LINE BREAK CHART & small sample size) See what happens when MACD signal line drops into negative territory. Significant support line for bitcoin price. See Oil and Gold price effect on support line. Will coronavirus shut down bitcoin mining in China? What will happen when Chinese market reopen. Is bitcoin about to explode? Bahhhhhh........ Hmm.............. NOT ADVICE. DYOR.

USDCNYBuyers have come into market on Weekly for a continuation to upside as currently in an uptrend as highlighted, Taking into account the current global issues and health concerns, CNY may retraced before continuing north, see what happens during US Session as US futures have declined considerably


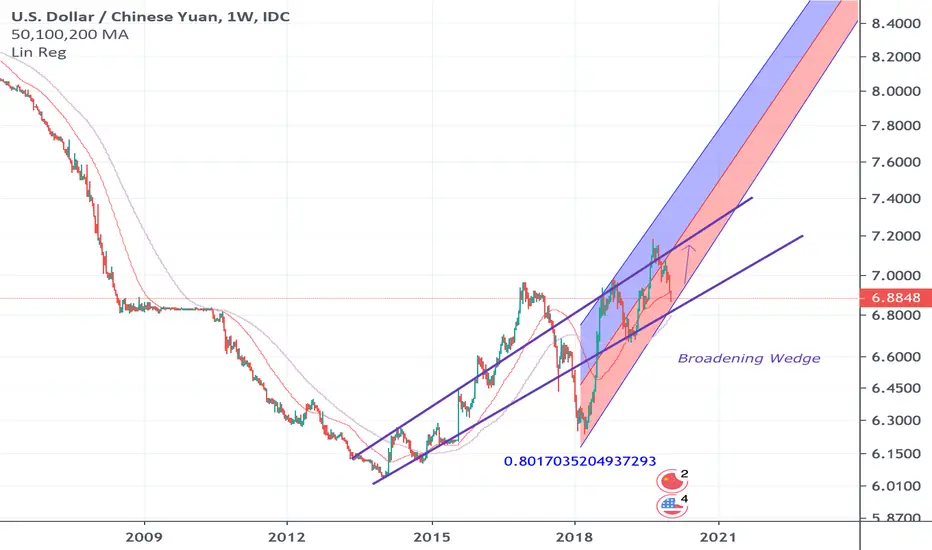
USDCNY Broadening WedgeA broadening wedge has formed on USDCNY. This may lead to a breakdown, however the short term outlook is quite bullish. With a 0.80 Regression uptrend.
Possible coming short for USDCNYWait for the days candle to finish forming before entering. Previous support zone has been broken.
Candle currently taking hammer formation, showing weak bullish sentiment.
Overall trend is also bearish.
R/R: 1.58
Entry: 6.9602
TP: 6.9350
SL: 6.9761
Good luck! Feel free to let me know what you think.

Yuan Keeps Gaining With Phase One Deal on Jan. 15President Trump's trade war against China was one of the dominant stories in financial markets over the course of 2019. But now an important currency is moving as it fades: the Chinese yuan.
This chart shows the U.S. dollar against the yuan, so price drops are bullish for the Chinese currency.
It shows the yuan has been gaining against the greenback since early September, right around the same time that Beijing agreed to trade talks in Washington. That marked the "beginning of the end" for the tensions.
The People's Bank of China controls the yuan, so it's not much of a trading vehicle. However, it's had a strong historical correlation with Chinese equities in the past:
-USDCNY fell sharply between mid-2005 and late 2008. The iShares China Large Cap ETF surged over the same period.
-USDCNY started to climb in mid-2015, corresponding to a selloff in FXI.
-USDCNY fell sharply between May 2017 and April 2018. Chinese stocks, especially tech companies like Alibaba , surged.
Another trend is China's attempted shift from manufacturing center to financial hub. This has entailed domestic financial reform (most of it forgotten amid the trade war). Second, indexing companies like MSCI are boosting allocations to China , potentially channeling billions of dollars of additional capital into its domestic stock markets.
That kind of transformation also goes hand-in-hand with a stronger yuan.
Just today the White House announced a January 15 signing date for Phase One of its trade deal with China. This creates the potential for further bullishness toward China in the New Year -- especially given the weakness in the U.S. dollar .
In conclusion, we don't yet know what the New Year will bring. But USDCNY could be a useful indicator which way things are going. Make sure to follow our ideas for potentially actionable China-related ideas 2020 based on this trend.

US dollar falling against Chinese YuanThe US dollar has initially tried to rally during the trading session on Friday but then turned around to form a bit of a shooting star and the psychologically and structurally important 7.00 CNY level. Ultimately, this is a market that measures risk appetite more than anything else and if we do pull back from the 7.00 level, the US dollar will probably drop down to the 6.95 handle, and then perhaps even the 6.90 level. Ultimately though, this is a market that measures massive amounts of risk, and if the US dollar falls it shows that we get a big “risk on” move around the world, not just in this pair.
A lot of this will come down to the US/China trade situation and whether or not we are moving forward. You can see that we have been grinding lower and significantly forming a bit of a down trending channel. We have recently bounce from the 50% Fibonacci retracement level and now sits just above the 200 day EMA. That being said we are making a series a “lower highs”, and of course “lower lows.” The last vestige of support could be the 200 day EMA or the 50% Fibonacci retracement level. Pay attention to the headlines because of things get good for risk appetite, this pair should continue to drop from here. Beyond that, it’s very likely that we will continue to see more of a grind lower as long as nothing too drastic happens. Unfortunately, it will only take one headline out there to turn things around. If the market were to break above the 50 day EMA then things stood start to shoot straight back up in the air in a bit of panic. Things have cooled down over the last several weeks though, so it’s very likely that we continue to drop.

15 December, the US will implement tariffs on $156B on ChinaTo offset the additional tariffs the CNY would have to depreciate - although the Chinese authorities have said that they won't pursue quantitative easing.
If there is a formal announcement to suspend or delay the tariffs, the market would expect a more positive risk reaction and that is currently being priced in. WIth the USDCNY trading around the 6.90 and below the 7.00 psychological level that was key back in the summer.
If Phase one of the deal does not pass and the tariffs go-ahead, we would expect the USDCNY to trade above the 7.100
