USDCNY_TOD trade ideas

USDCNY OutlookWill be very interesting to watch longterm trend of USDCNY. rising interest rates and the contionous USAvsCHINA trade war has many people worried on the outlook of the long term Ameircan economy. where do you think the market it is heading? to watch for companies it will be interesting to see if Amazon can branch out in the heavily dominated Alibaba chinese market.

USDCNY bullish long termFA:
- FED hikes,
- China exporting its inflation,
- Emerging market crisis.
TA
- bullish formation.

Ascending Broadening Wedge is calling for a Potential ShortAs you see there a being formed a ascending broadening wedge. Stop and TP areas has been showed.


USDCNY - Daily - Neutral... For nowUSDCNY started moving south in the end of last week, but quickly found support near 6.8685 zone and retraced back up above the short-term upside support line. That said, we will remain cautious and for a confirmation brake through one of the highlighted areas, before we take any action.
Please review the chart for details.
Don't forget to have your SL in place.

Some Insight on the Trade War with ChinaHad some Trump Trade Politics come out this week about ‘eminent progress,’ being made with China on trade just before the November Elections. This was denied by all sorts of Washington insiders, but begs the question, when will we see some sort of resolution on trade with China?
I think it would be great for China to evolve from being a Globalist/Corporatist New World Order TOOL to switching to a stance of Integrity and Honor, dealing fairly with their trade partners, improving the standard of living in China, and forsaking the evils of Mercantilism. Literally Everybody, except the NWO, would be better off if they did this, but that would represent a cultural change for China, switching from their own insular little world, and taking advantage of those around them, to standing as a contributing member on the larger world stage.
Fundamentally what do we know? We know Xi and Trump are meeting in December, and that a quarter trillion dollars’ worth of trade is going from 10% to 25% in January. We also know Trump is going to slap tariffs on the rest of China’s exports at some point due to lack of progress.
Technically, looking at the Long-Term picture, the USDCNY is in the C Wave of a rising Running Flat, making a measured move that would take prices up in the 7.15 to 7.20 range. We also know that this move would complete an even higher degree B wave. In Elliott Wave flat corrections there is often a time relationship between the corrective waves. If the B and C wave as shown are added together, it would be close in the length of time to the A wave.


Measured Move in the CNYThe Chinese CNY has further to devalue against the USD as a result of the ‘Trade War’.
With the Chinese providing a floor underneath Gold, buying when it gets to their price, there is thus further to go in the sell off of PM’s and their mining stocks.


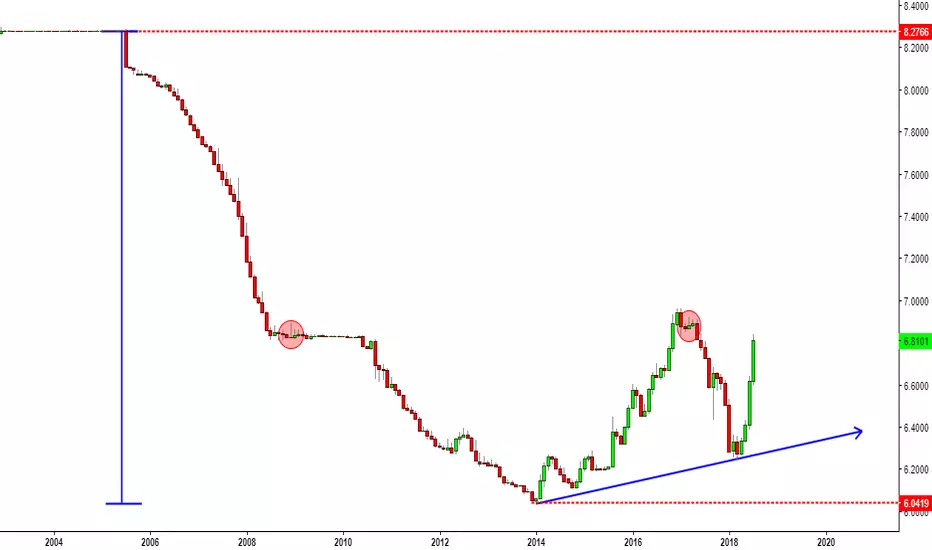
Yuan/USD Chart at historic support level. Long China?Trade wars potentially escalating and this chart shows major buy signals on the Yuan as it is near historical support/resistance levels. Will the Yuan break down or will it reverse and appreciate in value relative to the USD in a stroong way. Only time will tell, but this chart is interesting.

USDCNY Bear Divergence on the WeeklyThis idea is to showcase the same strategy we are planning on the daily on USDCNY. This is the same game plan as our daily idea on USDCNY. If we took this trade the strategy would tell us to place our stop above the high when the divergence is formed. Our profit target would be placed at 50% of the entire divergence move or 100% targeting the low of the first high that created the divergence. If the daily plays out using the same strategy as the weekly your target will be achieved. If the weekly plays out a bear divergence as it did here then our daily trade will get stopped out and we should look for another weekly divergence to enter using the same strategy.

Chinese yuan is heading lower.US-China tariff war is killing China as it is the factory of the world. Look around you, how many things says 'made in china' on it? What does that mean?
It means obviously China's economy is heavily relying on exports.
Like what's been written on zerohedge here.
'In this context, a Sino-American trade war is not only most unwelcome but also untimely. In July, the U.S. implemented a new 25% tariff on $50 billion of imports from China. U.S. President Donald Trump threatened to increase the tariff rate from 10% to 25% on a further $200 billion of imports from China if the latter retaliated (which it did), and even subject all $500 billion or so of annual imports to tariffs. Beijing's riposte was to threaten variable tariffs on an additional $60 billion of imports from the U.S.
Since China only imports about $150 billion of goods from the U.S., the scope for its own tit-for-tat tariffs is almost exhausted. If it wants to continue hitting back at the U.S., it will have to resort to some combination of currency depreciation and the use of its extensive system of regulations to target U.S. products and companies doing business in China. As far as depreciating the yuan is concerned, the Chinese authorities are moving into dangerous territory.'
Source : www.zerohedge.com
8% of depreciation is nothing, more is about to come.
***This information is not a recommendation to buy or sell. It is to be used for educational purposes only.***


USDCNY Buy IdeaUSDCNY Buy Idea @Monthly Demand Zone (6.2099 - 6.1875)
Buy Limit: 6.2120
Stop Loss: 6.1771
Take Profit: 6.2818

USDCNY enough room to go if they wantUSDCNY looks like untradeable and it's better to stay away from it. There's too much room to move around and Chinese are smart enough to play with.
Learn how to beat the market as Professional Trader with an ex-insider!
Just 2 seats available and 3 days left to enroll in and play our challenge.
Have a Nice Trading Week!
Cream Live Trading, Best Regards!
Gold vs Yuan Gold is solidly tied to the Yuan for the past few years and has intensified since Mid-June when trade wars threats begin to materialize with China.
Inverse relation has a very distinct pattern. When USDCNY rises, Gold falls, When USDCNY falls, Gold rises.

USD/CNY will weaken to 7.5 in 2019USD/CNY will probably weaken to 7.5 in 2019
it will make a channel between 5 and 7.5 for upcoming years till 2021

USD/CNY will probably weaken to 7.5 in 2019USD/CNY will probably weaken to 7.5 in 2019
it will make a channel between 5 and 7.5 for upcoming years till 2021

USDCNY - Daily - Yuan is trying to fight backTrade Alert
We could potentially capture the fall here, because it seems that the Yuan is trying to fight back from its recent sell-off, that's why we have seen USDCNY skyrocketing.
We can see that the uprise is supported by a steep line, which could get tested soon. But if this time it won't be able to withhold, then a break of that upside support line and a close below the 6.715 level could initiate more selling and the pair could travel lower.
Please examine the chart for potential levels.
Don't forget to have your SL in place.

UPD: Dollar v onshore yuan at post 2005 TL resistance $USDCNHMonthly close above 6.64 will keep it bullish $DXY
