USDDKK - U.S. Dollar/Danish Krone (3 hours chart, OANDA) - LongUSDDKK - U.S. Dollar / Danish Krone (3 hours chart, OANDA) - Long Position; Short-term research idea.
Risk assessment: Medium {volume & support structure integrity risk}
Risk/Reward ratio ~ 2
Current Market Price (CMP) ~6.62000
Entry limit ~ 6.58000 on May 19, 2025
1. Target limit ~ 6.63000 (+0.76%; +0.05000 points)
2. Target limit ~6.68000 (+1.52%; +0.10000 points)
Stop order limit ~ 6.53000 (-0.76%; -0.05000 points)
Disclaimer: Investments in securities markets are subject to market risks. All information presented in this group is strictly for reference and personal study purposes only and is not a recommendation and/or a solicitation to act upon under any interpretation of the letter.
LEGEND:
{curly brackets} = observations
= important updates
(parentheses) = information
~ tilde/approximation = variable value
-hyphen = fixed value
USDDKK trade ideas

USDDKK Buy Opportunity – Mirroring EURUSD Rejection📈 Weekly Overview
USDDKK shows bullish reaction from a key weekly support zone, in line with EURUSD rejecting resistance. Since USDDKK typically moves inversely to EURUSD, this setup aligns well for a long opportunity.
📆 Daily Chart
Yesterday formed a bullish pin bar after a period of consolidation, indicating potential strength building from the daily support zone. Momentum is picking up slowly.
⏱ 4H Chart
Price is holding above the 50EMA and just broke above recent consolidation range. Price action is clean with a clear structure shift to the upside. EMA confluence supports bullish bias.
🧭 Plan
Bias: Bullish
Entry: Wait for retracement to 4H discounted zone and bullish PA confirmation
Targets: TP1 - recent swing high, TP2 - next key resistance on daily
Invalidation: Break below 4H structure and EMA50

USDDKK (4H): TECHNICAL ANALYSISTECHNICAL ANALYSIS REPORT: USD/DKK (4H)
OVERVIEW
The USD/DKK 4-hour chart indicates significant price action dynamics with multiple pivot highs and lows. The pair is currently trading within a defined range between key support and resistance zones. The overall trend appears to be upward , as highlighted on the chart, with higher-timeframe pivots supporting this bias.
KEY LEVELS
Resistance Levels:
7.3302: Higher Timeframe Resistance
7.3211: Pivot High (Immediate Resistance)
7.3028: Current Sell Order Zone
Support Levels:
7.1756: Mid-Pivot Support
7.1562: Buy Order Zone
7.1470: Higher Timeframe Low
Take Profit Levels:
TP 1: 7.2075
TP 2: 7.2386
TP 3: 7.2602
TREND ANALYSIS
Trend: The pair is in an uptrend with higher lows and higher highs forming consistently.
Current Momentum: Bearish candles are testing buy order zones near 7.1756 and 7.1562.
Larger Picture: The trend remains bullish, with key support likely to hold.
INDICATORS
Dynamic Levels: The higher-timeframe pivot zones (7.3302 and 7.1470) provide clear boundaries for the trend.
Price Action: Recent bearish momentum suggests a pullback, presenting a buying opportunity.
Pivots: Resistance levels at 7.3211 and 7.3028, while support lies at 7.1756 and 7.1562.
TRADING OPPORTUNITIES
Aggressive Long Entry:
Enter at 7.1756 or 7.1562 with bullish confirmation (e.g., bullish engulfing).
Target Levels: TP 1 (7.2075) , TP 2 (7.2386) , TP 3 (7.2602) .
Stop-loss: Below 7.1470 .
Conservative Approach:
Wait for a breakout above 7.3028 with a retest.
Target Levels: 7.3211 , then 7.3302 .
RISK MANAGEMENT
Maintain a 1:2 risk-reward ratio .
Monitor volume and candlestick patterns for confirmation.
Adjust positions dynamically based on trend strength.
CONCLUSION
USD/DKK is showing a pullback to critical support levels, providing a potential long entry opportunity. A breakout above resistance would confirm the continuation of the uptrend.
Stay disciplined, consistent, and patient principles !!!


#USDDKK 4HUSDDKK 4-Hour Analysis
The USDDKK pair is forming a descending triangle pattern on the 4-hour chart, a bearish continuation pattern that indicates the potential for further downside. The price is consolidating near the support line, and a breakout below this level would confirm the bearish setup.
Technical Outlook:
Pattern: Descending Triangle
Forecast: Bearish (Sell Opportunity)
Entry Strategy: Enter a sell position after a confirmed breakout below the triangle’s support line.
Traders should look for confirmation such as a strong bearish candlestick closing below the support level or increased selling volume. Proper risk management is crucial, with stop-loss orders placed above the upper boundary of the triangle. Profit targets can be set at the next key support levels, aligning with the measured move from the triangle’s height.

USDDKK: ITF CURVE ANALYSIS (17H) - (DOWNTREND)✨ USDDKK: ITF CURVE ANALYSIS (17H) ✨ (DOWNTREND)
SLO2 @ 7.0950 ⏳
SLO1 @ 7.0650 ⏳
SSO @ 7.05928 ⏳
TP1 @ 6.95821
TP2 @ 6.87327
TP3 @ 6.81071
TP4 @ 6.71407
TP5 @ 6.6925 (Secret TP)
BLO1 @ 6.69086 ⏳ (DO NOT SET - LET PA PASS PRICE/THEN SET AS BSO)
BLO1A @ 6.6750 ⏳(POTENTIAL FOR REAL BLO)
BLO2 @ 6.63447 ⏳
🔑
BLO = BUY LIMIT ORDER
BSO = BUY STOP ORDER
ITF = INTERMEDIATE TIME FRAME
PA = PRICE ACTION
SLO = SELL LIMIT ORDER
SSO = SELL STOP ORDER
TP = TAKE PROFIT
NOTE: IF you followed my last trade on this pair, we took profit on all of our TP's. It took a couple of months, but that was to be expected and well worth the wait. Let's see if we can do it again.....
Intermediate time frames (4 hours to 6 day):
— Offer a clearer picture of the underlying trend compared to short-term frames.
— Provide more opportunities for confirmation signals and technical analysis.
— Allow for more flexible trading schedules, trades can be held overnight.
— Suitable for swing traders and some positional traders.

Text book bullish W-Bottom on weekly. Huge gains here.
USDDKK and a Weekly chart Double-bottom which has just passed through the neckline.
Look for a retrace back to neckline.
On USD strength at the moment, this is sure to climb during trading today and the next several weeks. Massive RR. Thx Chris.
Stupid-bloody software. Ignore the chart above. I tried to delete and overwrite but this damn software that some of us spend so much time is simply bs.
Here is a 5m chart showing the breakout and a retest back on the neckline which is the red-dotted line. It may conduct a retest again or look for a fib retracement or a good ol' market order at these low levels.
Be aware that Double bottom breakouts even over and beyond neckline, often retrace in a big way back underneath the neckline to push traders patience and take stops. Then price breaks out again.
I can't see the above happening because this is a weekly chart firstly, plus the USD is too strong in momentum currently.
Your're welcome:)

USDDKK Confirmed bullish break-out.The USDDKK pair broke yesterday above its 1D MA200 for the first time since August 02 and gave a strong bullish break-out signal. The 1D RSI got overbought (above 70.00), so a pull-back of a few days is possible, but on the medium-term we expect a continuation of the uptrend, similar to the two previous times the price broke above the Lower Highs trend-line.
Our Target is Resistance 1 at 6.99000.
-------------------------------------------------------------------------------
** Please LIKE 👍, FOLLOW ✅, SHARE 🙌 and COMMENT ✍ if you enjoy this idea! Also share your ideas and charts in the comments section below! This is best way to keep it relevant, support us, keep the content here free and allow the idea to reach as many people as possible. **
-------------------------------------------------------------------------------
💸💸💸💸💸💸
👇 👇 👇 👇 👇 👇

Buy Signal for USDDKKAttention traders,
I'm issuing a buy signal for the currency pair USDDKK based on current market data and analysis conducted with the EASY Quantum Ai strategy.
Direction: Buy
Enter Price: 6.68024
Take Profit: 6.69487333
Stop Loss: 6.66784333
Justification
Using the EASY Quantum Ai strategy, this recommendation takes into account several critical factors:
1. Technical Indicators: Key technical indicators like moving averages and the Relative Strength Index (RSI) show signs of upward momentum.
2. Economic Data: Economic indicators from both the US and Denmark suggest stronger performance in the US economy, contributing to the appreciation of USD against DKK.
3. Market Sentiment: Positive market sentiment and increased confidence in the USD have been observed, driving demand higher.
4. Support and Resistance Levels: The current price of 6.68024 aligns with previous support levels, indicating a potentially strong entry point. The Take Profit level of 6.69487333 is aimed at a significant resistance level, while the Stop Loss at 6.66784333 ensures manageable risk.
Always remember to double-check the market conditions and consider your risk tolerance before entering any trade.
Happy trading!

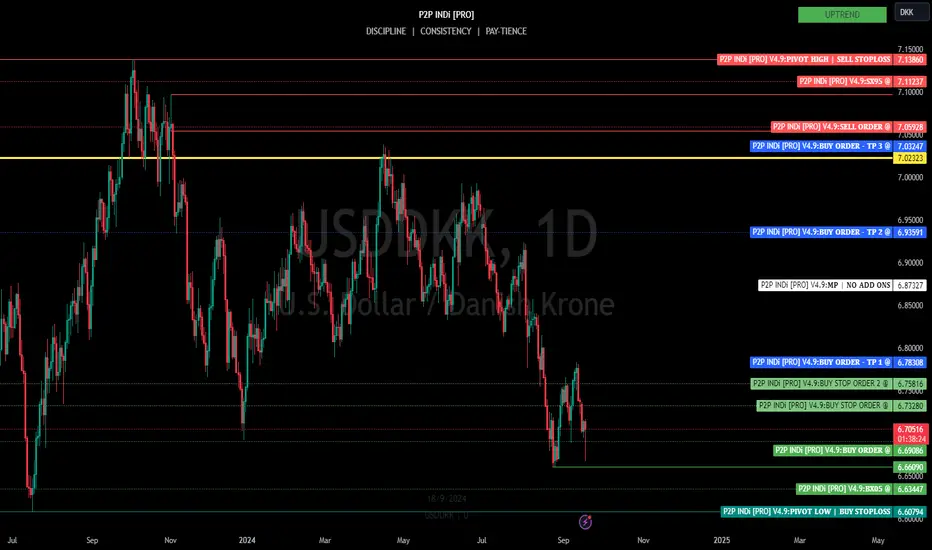
USDDKK: ITF CURVE ANALYSIS (1D) - UPTREND✨ USDDKK: ITF CURVE ANALYSIS (1D) ✨ (UPTREND)
BLO2 @ 6.63447 ⏳
BLO1 @ 6.69086 - TRIGGERED
BSO @ 6.73280 ⏳
BSO2 @ 6.75816 ⏳
TP1 @ 6.78308
TP1a @ 6.8650 (Secret TP)
TP2 @ 6.93591
TP2a @ 7.0233 (possible strong PB)
TP3 @ 7.3247
SLO1 @ 7.05928⏳
SLO1 @ 7.11237⏳
🔑
BLO = BUY LIMIT ORDER
BSO = BUY STOP ORDER
ITF = INTERMEDIATE TIME FRAME
PB = PULLBACK
SLO = SELL LIMIT ORDER
TP = TAKE PROFIT
NOTE: I'VE BEEN WAITING PATIENTLY.... LET'S SEE WHAT HAPPENS.
Intermediate time frames (4 hours to 6 day):
— Offer a clearer picture of the underlying trend compared to short-term frames.
— Provide more opportunities for confirmation signals and technical analysis.
— Allow for more flexible trading schedules, trades can be held overnight.
— Suitable for swing traders and some positional traders.
Trading with Confidence: Utilizing Probabilities in USD/DKKU.S. Economic Strength: The U.S. economy continues to demonstrate resilience, with robust job growth and steady GDP expansion. This economic strength supports a bullish outlook for the U.S. dollar against other currencies, including the Danish krone.
Interest Rate Differentials: The Federal Reserve's hawkish stance on maintaining higher interest rates to combat inflation contrasts with the more dovish approach of the Danish central bank. This interest rate disparity favors the USD over the DKK.
Global Uncertainty: Ongoing geopolitical tensions and economic uncertainties in various parts of the world are driving investors towards safe-haven currencies like the U.S. dollar, potentially boosting its value against the Danish krone.
Trading Strategy
To capitalize on this bullish bias for USD/DKK, I plan to utilize probability-based positioning for long entries.
By combining these fundamental factors with a probability-based entry strategy, I aim to position myself effectively for potential movements in the USD/DKK pair.
12M:
1W:
3H:

USDDKK Bullish Divergence on RSI is a hidden buy opportunity.The USDDKK pair is on Lower Lows under its 1D MA50 (blue trend-line) within a 4-month bearish pattern. However its recent Low was a Higher Low on the 1D RSI, which technically is a Bullish Divergence, thus a short-term buy opportunity, similar to the December 27 2023 Higher Low. Target the Lower Highs trend-line at 6.95000.
-------------------------------------------------------------------------------
** Please LIKE 👍, FOLLOW ✅, SHARE 🙌 and COMMENT ✍ if you enjoy this idea! Also share your ideas and charts in the comments section below! This is best way to keep it relevant, support us, keep the content here free and allow the idea to reach as many people as possible. **
-------------------------------------------------------------------------------
💸💸💸💸💸💸
👇 👇 👇 👇 👇 👇

USDDKK SHORT BEARISHlooks like we could be heading down like other currencies.
STRING BEARISH OUTLOOK .
What are your guys thoughts?

USDDKK Trade Signal: Buy OpportunityDear Traders,
We have identified a promising trading opportunity for the currency pair USDDKK using our highly sophisticated EASY Quantum Ai strategy. Below are the specific trade details:
Direction: Buy
Enter Price: 6.89553
Take Profit: 6.91345667
Stop Loss: 6.87103667
Justification:
Our strategy has pinpointed a strong bullish trend forming for USDDKK. Several key factors contribute to this forecast:
1. Market Sentiment: Recent economic indicators from the US suggest bullish sentiment. Positive GDP growth and employment data support a stronger USD.
2. Technical Analysis: Our EASY Quantum Ai strategy has detected a breakout above a significant resistance level, indicating sustained upward momentum.
3. Quantitative Measures: High-frequency trading algorithms have shown an increase in buy orders, confirming institutional confidence in a USD rally against the DKK.
Based on these factors, entering a buy position at 6.89553 with a take profit set at 6.91345667 and a stop loss at 6.87103667 aligns with our strategy’s parameters for maximum profitability and controlled risk.
Trade wisely and ensure to monitor ongoing market conditions.
Happy Trading!
-The EASY Quantum Ai Team

USDDKK: ITF CURVE ANALYSIS (11H) - UPTREND✨ USDDKK: ITF CURVE ANALYSIS (11H) ✨ (UPTREND)
BLO3 @ 6.8010 (or early entry - 6.8033) ⏳
BLO2 @ 6.8133 ⏳
BLO1 @ 6.82761 ⏳
TP1 @ 6.87101
TP1a @ 6.9100 (Secret TP)
TP2 @ 6.94294
TP3 @ 6.98839
SLO1 @ 7.0010 ⏳
SLO @ 7.0233 ⏳
🔑
BLO = BUY LIMIT ORDER
ITF = INTERMEDIATE TIME FRAME
RT = RETRACEMENT
SLO = SELL LIMIT ORDER
TP = TAKE PROFIT
NOTE: We were able to clean up on the way down in our previous trade. Now, let's see what we have going in the opposite direction. I believe I've identified a nice RT pattern that should help us secure each of these TP's. THIS IS NOT FOR EVERYONE!!! I'm just posting here to test/enhance my personal skill and to keep myself accountable while tracking.
Intermediate time frames (4 hours to 6 day):
— Offer a clearer picture of the underlying trend compared to short-term frames.
— Provide more opportunities for confirmation signals and technical analysis.
— Allow for more flexible trading schedules, trades can be held overnight.
— Suitable for swing traders and some positional traders.

Longgg USDDKK (all the way to 7.0 :)Swing Trade
Take Profit 1 7.0
When the dollar starts to rally huge upside potential

Trade Signal: USDDKK Forex Pair - SELLDear Traders,
Based on our latest analysis conducted using the EASY Quantum Ai strategy, we have detected a promising SELL opportunity for the USDDKK currency pair. Here are the details of the trade signal:
Direction: Sell
Enter Price: 6.85193
Take Profit: 6.84039667
Stop Loss: 6.86180667
Reasons for the SELL Signal:
1. Technical Analysis: Our EASY Quantum Ai strategy indicates a bearish trend pattern emerging in the USDDKK pair. This is reinforced by key technical indicators such as the Relative Strength Index (RSI) and Moving Averages, reflecting a downward momentum.
2. Market Sentiment: Recent market sentiment also suggests a decreasing demand for USD against DKK, driven by macroeconomic factors and investor sentiment. This adds further confidence to a SELL position.
3. Economic Indicators: Economic data releases, such as lower-than-expected US economic performance and stronger-than-expected Danish economic data, support the notion that the DKK might appreciate against the USD in the short term.
Remember to manage your risk carefully and update your trading plan in accordance with these signals. As markets are subject to rapid changes, maintaining a close watch is crucial.
Trade wisely!
Best regards,
Your Trading Analysis Team

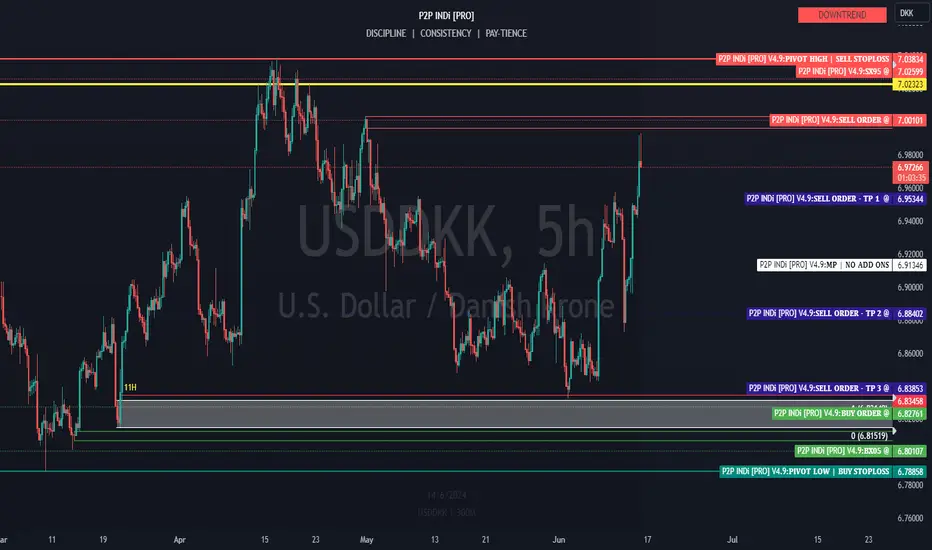
USDDKK: ITF CURVE ANALYSIS (5H)✨ USDDKK: ITF CURVE ANALYSIS (5H) ✨ (DOWNTREND)
SLO2 @ 7.0233 ⏳
SLO1 @ 7.0010 ⏳
TP1 @ 6.95344
TP2 @ 6.88402
TP3 @ 6.83853
BLO1 @ 6.82761⏳ (SET AFTER CONFIRMATION)
BLO1 @ 6.80107⏳ (SET AFTER CONFIRMATION)
🔑
BLO = BUY LIMIT ORDER
ITF = INTERMEDIATE TIME FRAME
SLO = SELL LIMIT ORDER
TP = TAKE PROFIT
Intermediate time frames (4 hours to 6 day):
— Offer a clearer picture of the underlying trend compared to short-term frames.
— Provide more opportunities for confirmation signals and technical analysis.
— Allow for more flexible trading schedules, trades can be held overnight.
— Suitable for swing traders and some positional traders.
USDDKK Strong bullish signal within a Channel Up.The USDDKK pair broke above its 1D MA50 (blue trend-line), which held yesterday as Support and this technically confirmed the continuation of the new Bullish Leg of the Channel Up that started after the December 28 2023 bottom.
In the past 12 months, we have seen strong accumulation to be taking place every time the pair breaks below the 1D MA50 (blue arc pattern), followed by a strong rise. Now that we trade within the Channel Up, the natural target is its top (Higher Highs trend-line).
We have set ours a little lower at 7.08000, in case it 'only' registers a +3.66% rise, similar to the April 16 Higher High.
-------------------------------------------------------------------------------
** Please LIKE 👍, FOLLOW ✅, SHARE 🙌 and COMMENT ✍ if you enjoy this idea! Also share your ideas and charts in the comments section below! This is best way to keep it relevant, support us, keep the content here free and allow the idea to reach as many people as possible. **
-------------------------------------------------------------------------------
💸💸💸💸💸💸
👇 👇 👇 👇 👇 👇

🆕 USDDKK...Curve Analysis 🆕(Based on the 5H Chart)
RESISTANCE @ 6.9500
TP4 @ 6.9339
TP3 @ 6.9144
TP2 @ 6.9017 (mid-pivot)
TP1 @ 6.8835
BSO @ 6.8649 ⏳
BLO @ 6.8535 ⏳
Although the BIG PICTURE trend appears to be a DT, PA seems to want to retrace to the upside up to about 6.9500 (resistance) before returning to the DT
BLO = BUY LIMIT ORDER
BSO = BUY STOP ORDER
DT = DOWNTREND
PA= PRICE ACTION
TP = TAKE PROFIT

🆕 USDDKK: CURVE ANALYSIS (3W) 🆕(DOWNTREND, BASED ON THE 3W CHART)
SLO2 @ 7.7108 ⏳
SLO1 @ 7.5331 ⏳
TP1 @ 7.1950 💰
SLO3 @ 7.0436 ⏳ (suggested by TEMASHA) 👈🏽
TP2 @ 6.9100 💰 (New SSO add-on) 👈🏽
TP3 @ 6.7015 💰
TP4 @ 6.3782
BLO1 @ 6.3005 ⏳
BLO2 @ 6.1119 ⏳
-SL @ 6.0231 🚫 (aggressive)
-SL @ 5.9331 🚫 (moderate)
-SL @ 5.7777 🚫 (conservative)
ADDITIONAL INFO:
📈 If PA continues to pullback to the upside, we may get another opportunity to catch this SLO suggested by TEMASHA @ 7.0436
📉 Now that PA has triggered our TP2, I'm going to use it as an opportunity to place an SSO add-on
🔑
-SL = STOP LOSS
BLO = BUY LIMIT ORDER
SLO = SELL LIMIT ORDER
TP = TAKE PROFIT
This is a Long-Term Time Frame trade (1 week to 1 year):
— Shows the big picture, revealing major trends and economic factors.
— Less volatile, price movements are slower and smoother.
— Suitable for long-term trend trading and position trading.
— Requires less frequent monitoring but may offer fewer trading opportunities.

USDDKK Buy continuationThe USDDKK pair is consolidating after it started a new Bullish Leg following the 1D Golden Cross formation. The long-term pattern is also a Channel Up and the current Bullish Leg appears to be proportional to the one that started on the July 18 2023 Low. As you can see it is where the 1D RSI bottomed on both cases.
As a result we have no reason not to expect a similar target on the 2.0 Fibonacci extension (3.0 from lower count) at 7.15000.
-------------------------------------------------------------------------------
** Please LIKE 👍, FOLLOW ✅, SHARE 🙌 and COMMENT ✍ if you enjoy this idea! Also share your ideas and charts in the comments section below! This is best way to keep it relevant, support us, keep the content here free and allow the idea to reach as many people as possible. **
-------------------------------------------------------------------------------
💸💸💸💸💸💸
👇 👇 👇 👇 👇 👇

🔄 EURUSD & USDDKK: Curve Analysis 🔄(Based the 5H Chart)
⚠️ EXTREMELY HIGH-RISK RETRACEMENT ⚠️
1️⃣ EURUSD...UT
TP4 @ 1.0828
TP3 @ 1.0777
TP2 @ 1.0743
TP1 @ 1.0695
BSO2 @ 1.0645 ⏳
BSO1 @ 1.0615 ⏳
-SL @ 1.0601 (aggressive) 🚫
2️⃣ USDDKK...DT
-SL @ 7.0383 (aggressive) 🚫
SSO1 @ 7.0292 ⏳
SSO2 @ 7.0106 ⏳
TP1 @ 6.9752
TP2 @ 6.9455
TP3 @ 6.9236
TP4 @ 6.8897
BLO1 @ 6.8816 ⏳
BLO2 @ 6.8619 ⏳
-SL @ 6.8526 (aggressive) 🚫
ADDITIONAL INFO:
📊 Since PA has begun retracing from here, then that big money is still of the table.
1️⃣📈 EURUSD Curve Analysis, IF it retraces back to the upside
2️⃣📉 USDDKK Curve Analysis, IF it retraces back to the downside
