EURUSD BUY SOONEUR/USD extends its daily slide and trades deep in the red below 1.1600 in the American session on Thursday. The US Dollar (USD) benefits from the better-than-expected Jobless Claims and Retail Sales data, not allowing the pair to hold its ground.
USDEUR trade ideas

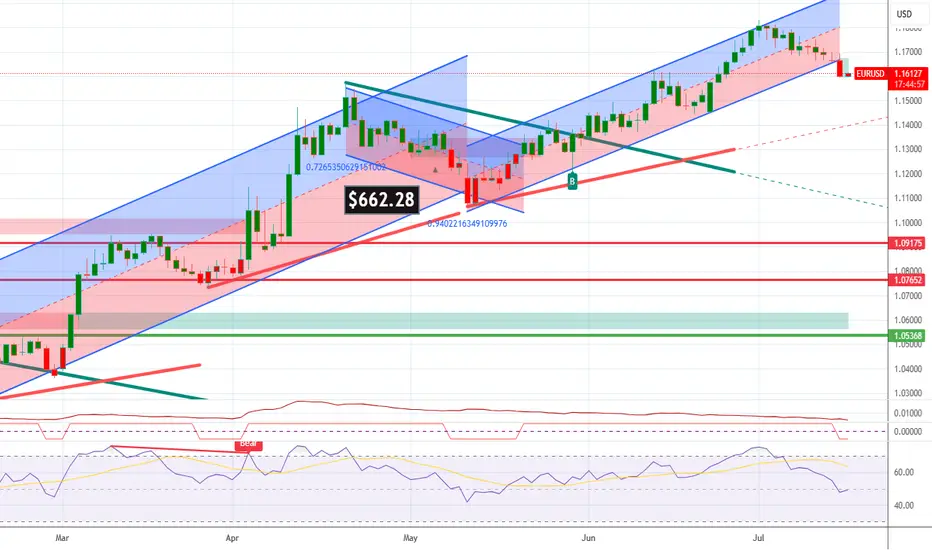
EURUSD TRADE IDEA UPDATE We had a pullback on EURUSD. Although we didn't get a full pullback to our Fibonacci level and the market seems to have taken off to the upside.
Let's see how the market unfolds
EURUSD ALERTPrice starts ranging
No clear breakout yet — we're staying patient and waiting for a cleaner entry signal.
#EURUSD #Forex #PriceAction #Trading

EURUSD could see further downside potentialFundamental:
The euro slipped as mixed ECB signals and political jitters pressured sentiment. ECB President Lagarde reiterated that borrowing costs will remain restrictive 'as long as needed,' even as inflation eases and economic activity stabilizes.
Renewed political tensions in France and soft German industrial data also weighed on the euro, though stronger services PMIs offered a modest offset. At the same time, the dollar held firm after a hotter US CPI print reduced the likelihood of near-term Fed rate cuts, keeping EURUSD near a three-week low.
Technical:
EURUSD retreated below the resistance at 1.1800 and within the ascending channel. If the price extends its decline, it could approach the support at 1.1450. Conversely, a break above the resistance at 1.1800 could prompt a further rise toward the resistance at 1.1920.
By Li Xing Gan, Financial Markets Strategist Consultant to Exness

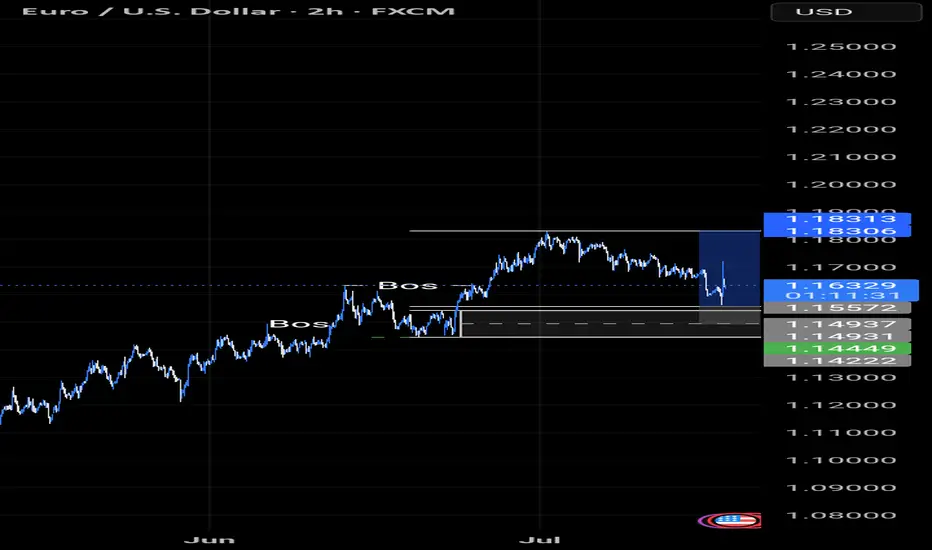
CONTINUATION OF BEARISH TREND EUR/USD continuaring bearish, just going up to the the imbalance created yesterday during CPI, we expect it to hit the horizontal line as shown in the image, we expect a redistribution then another short entry, a the US dollar index gains strength

EURUSD : Status @ 15/7Direction: Sell
Signal triggered: 15/7/2025
Stop when:
a) Stop Loss @ 1.1700 ; or if
b) Buy signal triggered
Action:
Sell the rally
Good luck.

EURUSD Wave Analysis – 15 July 2025- EURUSD broke daily up channel
- Likely to fall to support level 1.1470
EURUSD currency pair recently broke the support area located at the intersection of the support trendline of the daily up channel from May and the 38.2% Fibonacci correction of the upward impulse from June.
The breakout of this support area accelerated the active short-term ABC correction 4.
Given the strongly bullish US dollar sentiment coupled with significant euro pessimism seen today, EURUSD currency pair can be expected to fall further to the next support level 1.1470 (low of former wave iv).

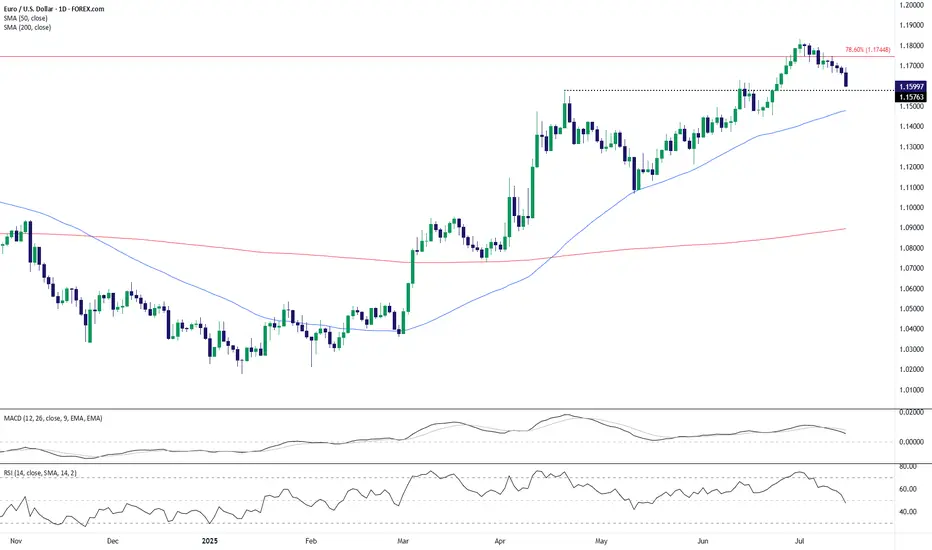
EUR/USD Technical Outlook: Bearish Momentum Builds Below Key ResEUR/USD has broken down from its recent highs near the 1.1750 resistance area, which coincides with the 78.6% Fibonacci retracement level. The pair is now trading around the 1.1600 handle, slipping below a short-term support zone near 1.1576. This breakdown signals potential continuation of bearish pressure in the coming sessions.
The 50-day SMA (1.1477) remains upward sloping, but the price action has now decisively turned lower, with a series of lower highs forming after the July peak. The MACD histogram is fading, indicating waning bullish momentum, and the RSI has dropped to 47.7—losing the bullish bias and heading toward bearish territory.
If EUR/USD cannot reclaim the 1.1576–1.1600 zone quickly, a deeper pullback toward the 50-day SMA or even the 1.1450–1.1500 range may unfold. On the upside, bulls would need to push back above the 1.1750 resistance to regain control, but given the loss of momentum and structure, the near-term bias favors the bears.
-MW
EUR/USD drops post US CPI reportAfter gaining ground last week, the US dollar initially came under slight pressure earlier today. However, it regained momentum in the aftermath of a mixed US inflation report. Despite the nuanced inflation print, market expectations around interest rate policy remained largely unchanged. Investors continue to anticipate a slower pace of rate reductions, a sentiment that could further weigh on the EUR/USD pair—provided confidence in the Federal Reserve’s monetary approach remains intact.
Mixed Signals from US Inflation Data
The consumer price index for June presented a mixed picture. Headline CPI increased by 0.3% month-over-month and 2.7% year-over-year, surpassing both the previous 2.4% figure and the 2.6% forecast. However, core CPI (which excludes food and energy) showed a slightly softer reading, rising by only 0.2% month-on-month—below the expected 0.3%. The annual core rate stood at 2.9%, in line with expectations.
This mixed data has not allayed fears that inflation could remain sticky for longer. As a result, the Fed may hold off on aggressive rate cuts, although a possible move in September remains on the table.
Adding to the dollar’s bullish case, President Trump has proposed aggressive tariffs—35% on select Canadian goods and up to 30% on imports from Mexico and the EU—if no agreements are reached by August 1. These protectionist threats, combined with his expansive fiscal agenda, could drive inflation higher and bolster the dollar if market faith in US policy stays strong.
Euro Zone Data Shows Resilience, But the Euro Falters
Despite some encouraging macroeconomic indicators from the Eurozone, the euro slipped. Germany’s ZEW economic sentiment index rose to 52.7, outperforming both expectations (50.8) and the previous reading (47.5). Additionally, industrial production climbed 1.7% month-on-month, beating forecasts.
While these positive data points reflect a degree of resilience in the euro area, trade tensions are looming. The European Union has said it will retaliate on US products—ranging from aircraft to alcohol—should trade talks collapse or fail to yield agreements by the August 1 deadline.
Technical Outlook
Technically, EUR/USD breached the bullish trendline established since Q1, a development that bears are watching as the session wears on. Currently, the pair is testing a key support zone between 1.1570 and 1.1630—an area that served as resistance in both April and mid-June before the rally that followed.
Should prices fall decisively below this support today or in the coming days, the technical bias could shift bearish. On the upside, resistance lies at 1.1700 and 1.1750. A break above these levels would clear the way for bulls to target a fresh 2025 high above 1.1830.
By Fawad Razaqzada, market analyst with FOREX.com

EURUSD - sell market after consolidation phase has taken control by the bears with strong support level being broken with engulfing candle (momentum candle)
we have two buy setup: wait for the market to retrace to the level of 0.382 of fib or enter instant in to the market.
TP1 and TP2 with R:R of 1:1 and 1:2

Fundamental Market Analysis for July 14, 2025 EURUSDThe euro remains under pressure: on Monday the pair slipped to 1.16750 after the European Commission extended its pause on retaliatory tariffs against the United States until 1 August. With no resolution in sight, the trade dispute keeps European exporters on edge and turns the dollar into a safe-haven choice for investors looking to limit risk.
Additional support for the greenback comes from rising real yields. The 10-year U.S. Treasury rate is holding above 4.40 %, locking in a wide spread over German Bunds. That has led futures traders to price in just one 25 bp Federal Reserve rate cut for the rest of the year, reducing the euro’s relative appeal.
Macro data from the euro area offer little relief. German industrial production rose only 0.2 % m/m in May, while the July ZEW expectations index slid back into negative territory. With the ECB having already delivered a June cut and projecting lower inflation ahead, inward capital flows to the eurozone remain subdued.
Trading recommendation: SELL 1.16750, SL 1.17050, TP 1.16200

EURUSD InsightHello to all our subscribers.
Please share your personal thoughts in the comments. Don't forget to like and subscribe!
Key Points
- Attacks on Fed Chair Jerome Powell are intensifying, mainly from President Trump and his close aides. Analysts say the tension between the White House and the Federal Reserve has reached a serious level.
- President Trump announced on Truth Social that starting next month, a 30% reciprocal tariff will be imposed on both the EU and Mexico.
- Canada added 83,100 jobs in June compared to the previous month, in line with market expectations. The unemployment rate came in at 6.9%, slightly below the forecast of 6.9%. The strong labor market data likely reduced the chances of a rate cut by the Bank of Canada in July.
This Week’s Key Economic Events
+ July 15: U.S. June Consumer Price Index (CPI)
+ July 16: U.K. June Consumer Price Index, U.S. June Producer Price Index (PPI)
+ July 17: Eurozone June Consumer Price Index
EURUSD Chart Analysis
The price has broken below the trend channel and is now forming under the 1.17000 level. The downside appears more likely than an upward move. The expected support level is around 1.15000. Whether the price bounces from this area or breaks further downward will likely determine the future direction.

EUR/USD Daily Chart Analysis For Week of July 11, 2025Technical Analysis and Outlook:
In this week's trading session, as expected, the Euro continued its decline, reaching our Mean Support level of 1.168. Recent analyses suggest that the Euro is likely to experience a further downward trend, with the next target set at the Mean Support level of 1.160. However, it's essential to consider the possibility of a rebound toward the Key Resistance level of 1.181, which could lead to the completion of an Outer Currency Rally reaching 1.187.

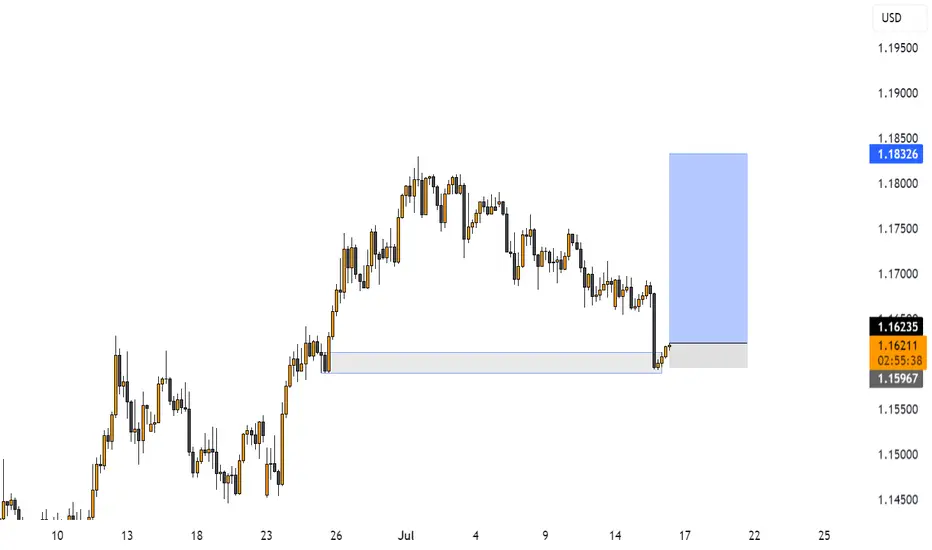
EURUSD – Breakout Confirms Bullish ContinuationEURUSD has just successfully broken out of a corrective triangle pattern, confirming that the bullish structure remains intact. The price reacted well to the support zone around 1.1660 and bounced back, opening the way toward the 1.1820 target in the short term.
On the news front, the euro is gaining support as the Eurozone’s July CPI held steady at 2.6%, indicating that inflationary pressures have not fully eased—this may prompt the ECB to maintain a tighter policy for longer. Meanwhile, the USD is under mild correction pressure after U.S. CPI came in higher than expected but not strong enough to reignite rate hike expectations from the Fed.
Given the current technical setup and news backdrop, EURUSD could continue rising in the coming sessions as long as it holds above the trendline support.

EUR/USD LIVE TRADE UPDATEWe have been short in this market since Monday and although we did get a nice move down it did not hit our profit target and has been heading back up, resistance at the current price action should work in our favor and move this market back down.

Euro Slips, Brussels Stalls RetaliationEUR/USD is pulling back toward 1.1620 in Thursday’s Asian session as markets await Eurozone HICP data, with eyes on US June retail sales later in the day. The dollar stays firm on expectations that the Fed will hold rates at 4.25%-4.50% in July amid tariff-driven uncertainty.
President Trump announced plans to notify over 150 countries of a 10% tariff, possibly rising to 15-20%, targeting those with minimal U.S. trade ties. He criticized Fed Chair Powell but admitted removing him might destabilize markets, while floating possible trade deals with Europe and India.
Strong June CPI has reignited concerns about prolonged high rates. Dallas Fed’s Lorie Logan and New York Fed’s John Williams both warned that tariffs may keep inflation elevated, reinforcing the case for keeping rates steady.
Resistance for the pair is at 1.1670, while support is at 1.1580.

7.16 EUR/USD LIVE TRADE UPDATE DAY 3This market made a very nice down candle yesterday and then pulled back a little, currently it looks to be heading down again. We are looking for this market to make new lows on the current down momentum.

EURUSDU - market structure EURUSDU - market structure , use your own risk and trade managmnet and your own decision
A case for a EURUSD ShortPrice got rejected at the U-MLH.
DXY shows some strenght too:
A close below yesterdays low is a short for me.

EURUSD(20250715) Today's AnalysisMarket news:
Sources said that after Trump's latest trade tax threat, the European Central Bank will discuss a more negative scenario next week than expected in June. The ECB is still expected to keep interest rates unchanged at its meeting on July 24. Discussions on rate cuts are still postponed to September.
Technical analysis:
Today's buying and selling boundaries:
1.1671
Support and resistance levels:
1.1714
1.1698
1.1687
1.1654
1.1644
1.1628
Trading strategy:
If it breaks through 1.1671, consider buying in, the first target price is 1.1687
If it breaks through 1.1654, consider selling in, the first target price is 1.1644

7.14 EUR/USD LIVE ENTRY UPDATE 4HWe got the trigger and placed the order to sell. We will keep you updated on this trade. entry, profit target, stop loss placement are all on the chart

Eurousd techinical analysis.This chart is for EUR/USD on the 1-hour timeframe, showing a harmonic pattern (likely a bullish Gartley or Bat) identified between points A-B-C-D, along with trendlines, consolidation zones, and measured move annotations. Here’s a breakdown:
---
🔍 Key Observations:
1. Harmonic Pattern (ABCD or Gartley/Bat):
Points A → B → C → D are marked.
B retraces to 1.117 (likely 61.8%-78.6% Fibonacci).
C retraces to 0.93 (possibly 88.6% or 61.8%).
The full pattern suggests a potential bullish reversal from point D.
2. Descending Trendline (Pink):
A clear downtrend line intersects the chart.
Price recently broke above this trendline, indicating a potential breakout.
3. Support & Resistance Zones (Purple Rectangles):
Support around 1.1610–1.1630 (bottom zone).
Resistance at 1.1690–1.1710 (top zone).
Price is currently at 1.16676, right between zones.
4. Measured Move (Green Arrow):
Shows a projected upside move of 36.1 pips (0.31%) from D to the top resistance.
This suggests a target area if the bullish pattern plays out.
---
✅ Potential Setup:
Bullish Bias due to:
Harmonic pattern completion at D.
Break above descending trendline.
Holding near midrange with room to 1.1700+.
Confirmation Needed:
Strong bullish candlestick or volume at D.
Break and close above 1.1690 for continuation.
Invalidation:
Break below the purple support zone (~1.1610).
---
📌 Summary:
This chart illustrates a potential **bull
