EURUSD BUY IDEAMe currently on Bull Retracement bias for EURUSD based on candlestick confirmation and divergecne on RSI and Awesome Oscilator, trade your plan ,
USDEUR trade ideas

EURUSD - Break of support?In this moment we have a potential distribution of volume with a potential break of dinamic support we can have a deep rebound until area 1.14

Eurousd techinical analysis.Eurousd techinical analysis next move posibale at h1 time frame.not finchinal advice.

EURUSD| Bullish Bias - Refined OB Play into ContinuationPair: EURUSD
Bias: Bullish
HTF Overview (4H):
Bullish structure remains intact — recent break to the upside was followed by a healthy pullback. Now price is continuing the push toward external 4H highs.
LTF Confirmation (30M):
Structure refined from last week. Price recently mitigated a 30M demand OB and is now showing signs of continuation. Watching for clean 5M shift to confirm the next leg.
Entry Zone: 5M CHoCH flip followed by pullback into demand zone
Targets: 30M highs, then extended target at 4H highs
Mindset Note: Keeping it clean and reactive. No guessing — I’m tracking Smart Money flow, structure shift, and waiting on my cue.

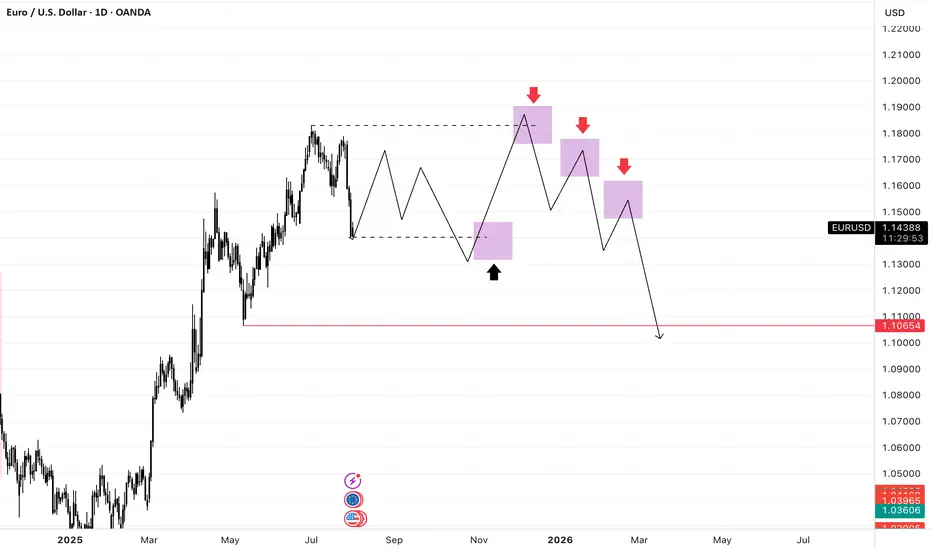
EURUSD: A Bearish Continuation?From my previous analysis, we anticipated a short-term decline on the EURUSD for a Daily bearish pullback. Price respected our zone and made a even stronger sweep before plummeting as forecasted.
Currently, price has returned to mitigate that liquidity sweep. Given the prior impulsive bearish move—which this current bullish correction stems from—we expect another drop, targeting the weak structure below for a potential liquidity grab or continuation.
We'll continue to monitor how price behaves around the current levels, but unless there's a significant shift in momentum, our bearish outlook remains valid. ✅
Follow us for more updates. 🔔
See you on the next one. 🫡

EURUSDEURUSD needs one more up after correction to break last week's high.
Disclosure: We are part of Trade Nation's Influencer program and receive a monthly fee for using their TradingView charts in our analysis.

EUR/USD | Bullish Momentum Builds – Next Targets Ahead! (READ)By analyzing the EURUSD chart on the 4-hour timeframe, we can see that, as per the previous analysis, the price first made a strong move in two steps, successfully hitting the 1.15580 target. Upon reaching this key level, it reacted positively with increased demand and is now trading around 1.16520. Given the current trend, I expect further bullish movement soon, with the next potential targets at 1.16720, 1.17230, and 1.17500.
Please support me with your likes and comments to motivate me to share more analysis with you and share your opinion about the possible trend of this chart with me !
Best Regards , Arman Shaban

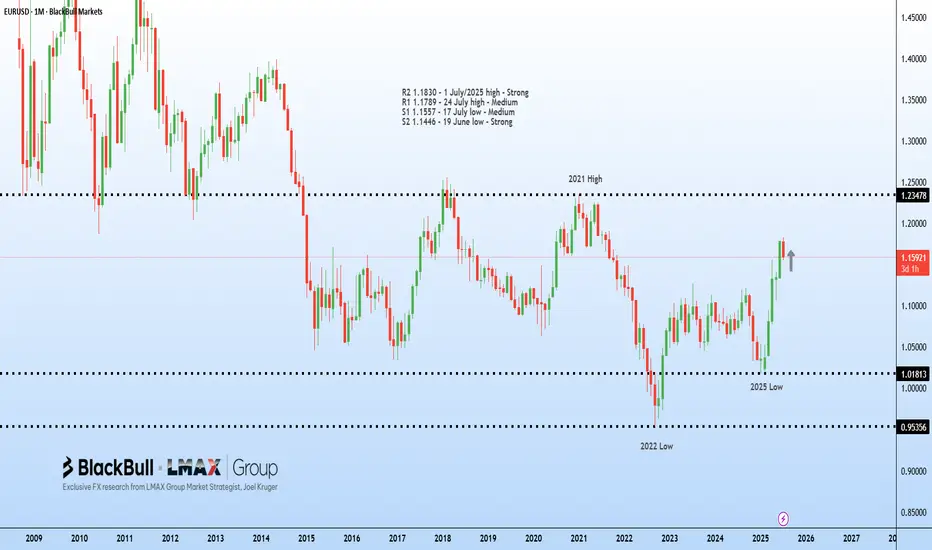
Euro-dollar retreats after the trade deal and divergent GDPEuro-dollar reached six-week lows on 1 August as traders continued to digest the trade deal between the EU and the USA which is widely viewed as being negative for the former. 30 July GDP releases from the eurozone and the USA also showed that American growth is much stronger, but eurozone-wide flash GDP for the second quarter was still slightly better than anticipated. The focus now turns to reactions to new tariffs and the NFP.
$1.14 looks like an important technical reference which might resist testing depending on the results of the job report. With fairly low volume relative to April’s peak and a clear oversold signal from the slow stochastic, a pause around here seems more likely than immediate continuation lower if considering only TA. 31 July’s near-doji slightly below the 100 SMA might suggest some demand for buying.
The obvious short-term resistance would be the confluence of the 50% monthly Fibonacci retracement and the 100 SMA around $1.147. The 61.8% Fibo slightly below $1.13 might be an area of support. Short-term performance depends primarily on the result of the NFP and the reaction to these; the consensus of 110,000 for total nonfarm seems too low relative to the average over the last several months, so a surprise higher might be more likely than lower.
This is my personal opinion, not the opinion of Exness. This is not a recommendation to trade.

EU LONGI'm currently monitoring EUR/USD and looking for potential long opportunities. If price action confirms, I’ll be looking to enter a buy position, anticipating upward momentum in the near term.
Thoughts on EU/USHave some ideas bout this chart. Dont want talk too much& If ur interested in. Just read previous takes in my acc. Feel to cozy, might delete later >/>
EUR/USD Potential Bearish MoveHi Traders.
1. HTF Expanding Structure
2. HnS Pattern
3. LTF Bearish Impulse
4. Breakout from Structure
Wait for LTF Correction and Breakout to confirm this setup

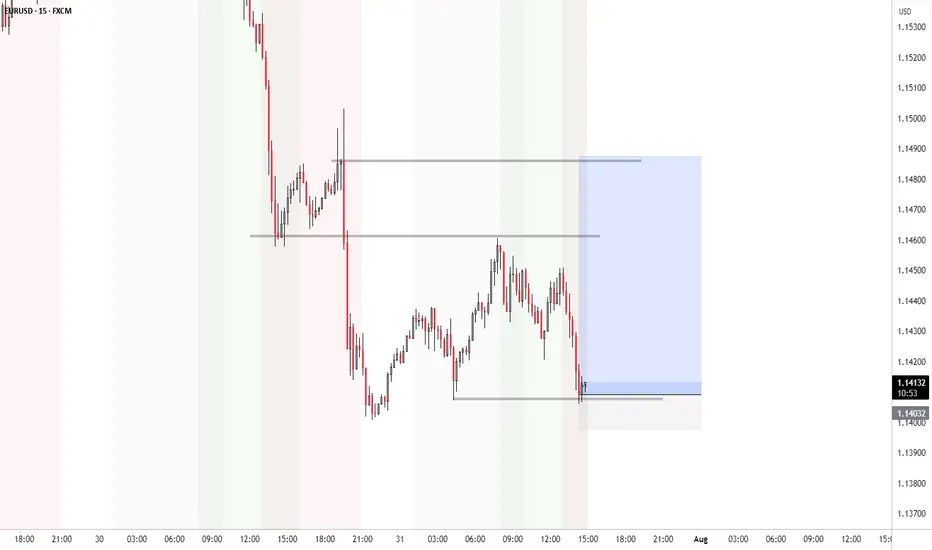
EURUSD BUY SET UPI'm looking to go long on EURUSD if price pulls back to the 1.14249 level — a key zone of interest backed by previous market structure.
🔹 Entry: Buy Limit @ 1.14249
🔹 Rationale:
Previous support/resistance flip
Confluence with market structure
Clean retracement zone with potential bullish reaction
📉 No impulse buying — I’m letting price come to me.
📊 Chart attached for visual clarity.
Trade safe. Plan your trade, and trade your plan.
EURUSD Bear dominating the market30th June Daily candle closed with strong bearish.
we could observed a drop-base-drop candle pattern in a lower time frame.
for today plan:-
i will wait at the "base" area around 1.147*** area for the bearish signal.
calculate your own risk & reward.
Good luck

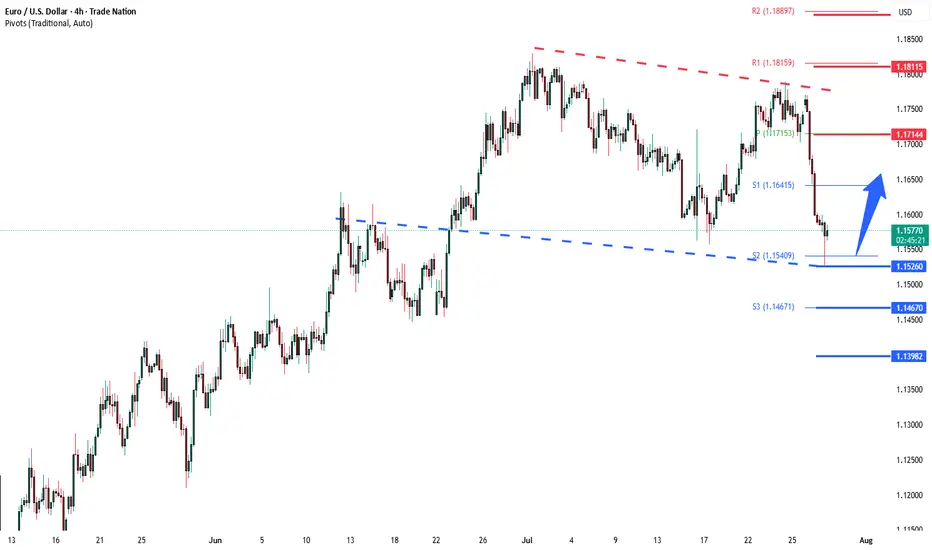
EURUSD corrective pullback support at 1.1526The EURUSD remains in a bullish trend, with recent price action showing signs of a corrective pullback within the broader uptrend.
Support Zone: 1.1526 – a key level from previous consolidation. Price is currently testing or approaching this level.
A bullish rebound from 1.1526 would confirm ongoing upside momentum, with potential targets at:
1.1714 – initial resistance
1.1810 – psychological and structural level
1.1885 – extended resistance on the longer-term chart
Bearish Scenario:
A confirmed break and daily close below 1.1526 would weaken the bullish outlook and suggest deeper downside risk toward:
1.1470 – minor support
1.1400 – stronger support and potential demand zone
Outlook:
Bullish bias remains intact while the EURUSD holds above 1.1526. A sustained break below this level could shift momentum to the downside in the short term.
This communication is for informational purposes only and should not be viewed as any form of recommendation as to a particular course of action or as investment advice. It is not intended as an offer or solicitation for the purchase or sale of any financial instrument or as an official confirmation of any transaction. Opinions, estimates and assumptions expressed herein are made as of the date of this communication and are subject to change without notice. This communication has been prepared based upon information, including market prices, data and other information, believed to be reliable; however, Trade Nation does not warrant its completeness or accuracy. All market prices and market data contained in or attached to this communication are indicative and subject to change without notice.
EU faces new tariffs, Euro slides | FX ResearchThe euro surged in early Asian trade following the US–EU trade agreement announced over the weekend, but has since faced consistent selling pressure, eventually triggering stop-loss orders below 1.17, reflecting a classic buy-the-rumour, sell-the-fact market reaction.
The deal imposes 15% tariffs on most EU exports to the US, down from 25% for automobiles, while excluding pharmaceuticals and medical metals, with semiconductors still under review. The EU committed to buying $750 billion in US energy products over three years, investing further in the US, opening markets with zero tariffs, and purchasing significant US military equipment.
The EU trade commissioner noted the deal provides business predictability despite higher tariffs than the previous 4.8% average. German automakers, including Mercedes-Benz, acknowledged some relief but highlighted ongoing costs, while Spain's PM offered lukewarm support.
Meanwhile, South Korea is preparing a trade package focusing on shipbuilding cooperation, and US–China tariff talks resume in Stockholm. The US dollar's trajectory may shift with this week's FOMC updates, Q2 GDP, core PCE, inflation, and non-farm payrolls data. While a light-data Monday features only the Dallas Fed manufacturing survey.
Exclusive FX research from LMAX Group Market Strategist, Joel Kruger
Eurousd techinical analysis.Eurousd techinical analysis next move posibale at h2 time frame.not finchinal advice.

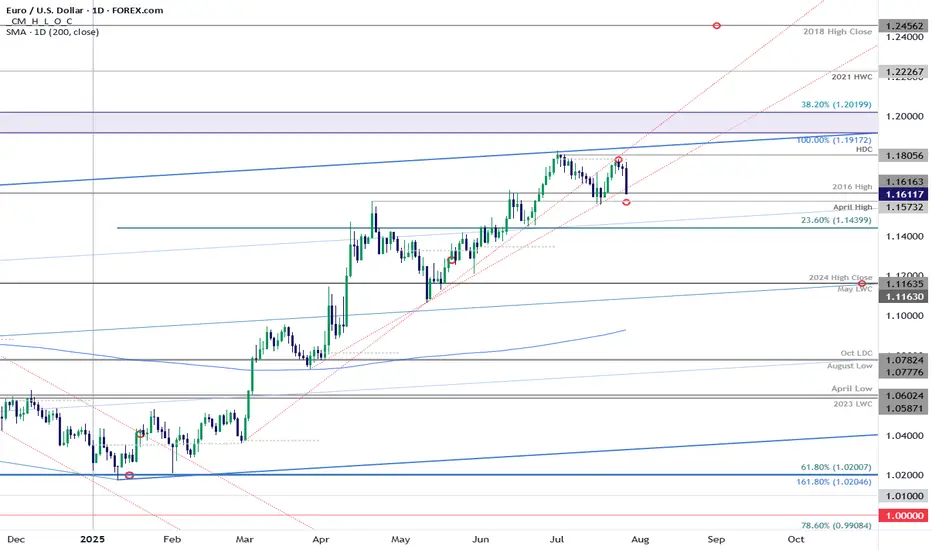
EUR/USD: Euro Poised for Monthly Range Breakout Ahead of FedEuro defended resistance at the monthly opening-range high / July open at 1.1787-1.1805 last week with price plunging back into support today at the late-February trendline / 2016 high at 1.1616.
Medium-term bullish invalidation rests with the April high at 1.1573 and a close below this level would suggest a more significant high is in place / a larger correction is underway. Stay nimble here into the monthly-cross and watch the weekly closes for guidance.
-MB
LONG TRADE PLAN (RENKO STRUCTURE)
🧱 LONG TRADE PLAN (RENKO STRUCTURE)
🔹 Entry: 1.1740
🔹 SL: 1.1690 (50 pip risk)
🔹 Style: 100-pip Renko Target Ladder
🔹 Bias: Macro uptrend forming — targeting Fib 100 and above
⸻
🎯 TARGET LADDER + STRATEGIC WHY
TP1 — 1.1800 📈
〰️ Brick 18 confirm — breakout ignition point
+60 pips | R:R 1.2:1
TP2 — 1.1900 💰
〰️ Mid-run exit — early profit-taker zone
+160 pips | R:R 3.2:1
TP3 — 1.2000 🧲
〰️ Full Fib 100 — magnet + reversal hotspot
+260 pips | R:R 5.2:1
TP4 — 1.2100 🚀
〰️ Post-Fib breakout — trap zone for late shorts
+360 pips | R:R 7.2:1
TP5 — 1.2200 🔄
〰️ Minor stall zone — profit lock-in level
+460 pips | R:R 9.2:1
TP6 — 1.2300 🔥
〰️ Thin continuation — extension in motion
+560 pips | R:R 11.2:1
TP7 — 1.2400 ⚠️
〰️ Trend exhaustion zone — monitor Renko structure
+660 pips | R:R 13.2:1
TP8 — 1.2500 🧠
〰️ Round number + gamma cluster — exit partials
+760 pips | R:R 15.2:1
TP9 — 1.2600 🪤
〰️ Liquidity sweep — trap and fade zone
+860 pips | R:R 17.2:1
TP10 — 1.2700 🏁
〰️ Full cycle climax — final high probability exit
+960 pips | R:R 19.2:1
⸻
🧠 Plan:
• Go 50% at 1.1740, scale 50% after 1.1800 confirm
• SL to BE after TP2
• Trail by 1 Renko brick after TP3
• Exit final ladder by TP8–TP10 unless macro reasserts
🔐 Invalidation: Close below 1.1700 = full reset

Important week for EURUSDOn Friday, EURUSD reached a support level and bounced off it.
This week, all eyes are on the Fed's interest rate decision on Wednesday and the U.S. jobs data on Friday.
The trend remains bullish for now, and the upcoming news will likely determine the next move.
Today and tomorrow, the market may stay in a range as traders wait for the key events.
Don't rush into new trades and avoid using large position sizes!

EUR/USD Daily Chart Analysis For Week of July 25, 2025Technical Analysis and Outlook:
During the previous week's trading session, the Euro experienced an increase following the completion of the Inner Currency Dip at the 1.156 level. It subsequently surpassed two significant Mean Resistance levels, namely 1.167 and 1.172; however, it reversed direction by the conclusion of the trading week. Recent analyses indicate that the Euro is likely to undergo a sustained downward trend, with a projected target set at the Mean Support level of 1.169 and a potential further decline to retest the previously completed Currency Dip at 1.156. Nonetheless, it remains essential to consider the possibility of renewed upward momentum towards the Mean Resistance level of 1.177, which could initiate a preeminent rebound and facilitate the completion of the critical Outer Currency Rally at 1.187.

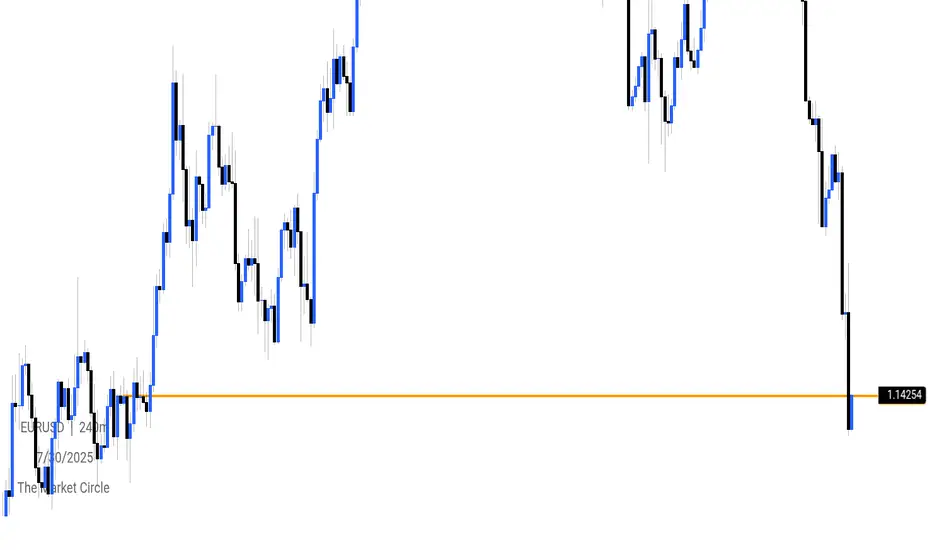
Sell EURUSD after BRD the level of 1.15This market is started the down move by forming a very
strong bearish bars
break down the level 1.15
so I opend short with RR=1:2.6
then after a 100 points in profit I added to
this short position another one with RR=1:2

EUR/USD SHORT — FRACTAL RENKO TRAP REVERSAL
🔻 EUR/USD SHORT — FRACTAL RENKO TRAP REVERSAL
Codex Execution | Tier 2 Rejection | Macro Gravity | TP1–TP10 Ladder Active
⸻
📍 TRADE SNAPSHOT
• Entry: 1.1665
• Stop Loss (SL): 1.1800 ✅ (Tier 2 pivot)
• Macro Direction (T1): 📉 Down
• Tier 2 Structure: 🔻 Bearish Flip Confirmed
• Execution Tier: Tier 2 rejection → continuation active
• Risk Size: ✅ Full position (SL = 135 pips)
• Trade State: ⚔️ Armed
• Trail SL: Activated post-TP1 → using Tier 3 pivots
⸻
🎯 TP LADDER MAP (Fixed Tier 2 Grid)
Level Price Status
🥇 TP1 1.1600 ✅ Hit
🥈 TP2 1.1500 ✅ Hit
🥉 TP3 1.1400 ⏳ Pending
🎯 TP4 1.1300 ⏳ Pending
🧨 TP5 1.1200 ⏳ Pending
💎 TP6 1.1100 ⏳ Pending
🔓 TP7 1.1000 ⏳ Pending
🔻 TP8 1.0900 ⏳ Pending
🔻 TP9 1.0800 ⏳ Pending
💀 TP10 1.0700 ⏳ Pending
🧠 TP ladder is mapped to Tier 2 (100 pip) round-number bricks — not floating from entry — per Codex IV structure logic.
⸻
🧠 STRUCTURAL RATIONALE
• Tier 2 Fib trap rejection confirmed @ 1.1665 (within 127.2–161.8% extension)
• Downtrend continuation brick confirmed below trap zone
• Tier 1 macro trend = bearish
• TP1 + TP2 already hit
• Trade now approaching TP3 zone (1.1400)
⸻
⚔️ TRADE MANAGEMENT PLAN
• ✅ SL trailed to breakeven after TP1
• ✅ Partial scale-out at TP1 / TP2
• 🔁 Add-on only allowed if:
• Retest rejection near 1.1500–1.1540
• OR clean body close below 1.1440
• ❌ No re-entry inside 1.1440–1.1500 dead zone
⸻
✅ EXECUTION FILTER STATUS
Condition Status
T1–T2 Alignment ✅
Trap Rejection Confirmed ✅
SL outside structure ✅
TP1–TP2 Reached ✅
Entry Trigger: Brick Close ✅
Macro Compression ❌
Time Cutoff (Pre-3PM EST) ⚠️ Confirmed OK
⸻
#EURUSD #FractalRenko #Tier2Trap #TP1toTP10 #CodexExecution #RenkoTrading #ShortSetup #InstitutionalFilter #TradingViewIdea #TrailLogic #RewardLadder
⸻

EURUSD DOWN SIDE The dollar index (DXY00) on Tuesday rose by +0.22% and posted a 5-week high. The dollar has carryover support from Monday following the EU-US trade deal that is seen as favoring the US. Also, expectations for the Fed to keep interest rates unchanged at the end of Wednesday's 2-day FOMC meeting are supportive of the dollar. The dollar extended its gains after the US Jun advance goods trade deficit unexpectedly shrank, a supportive factor for Q2 GDP, and after July consumer confidence rose more than expected.
