USDEUR trade ideas

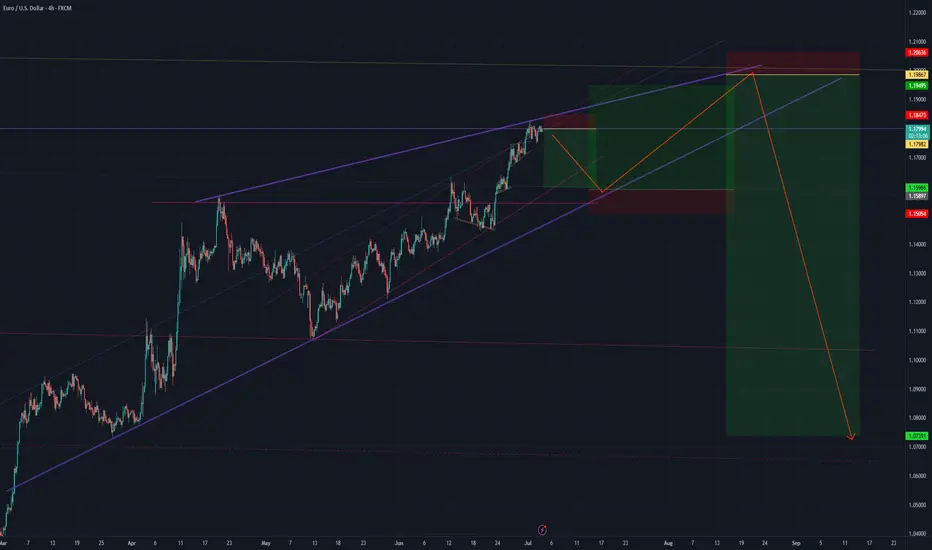
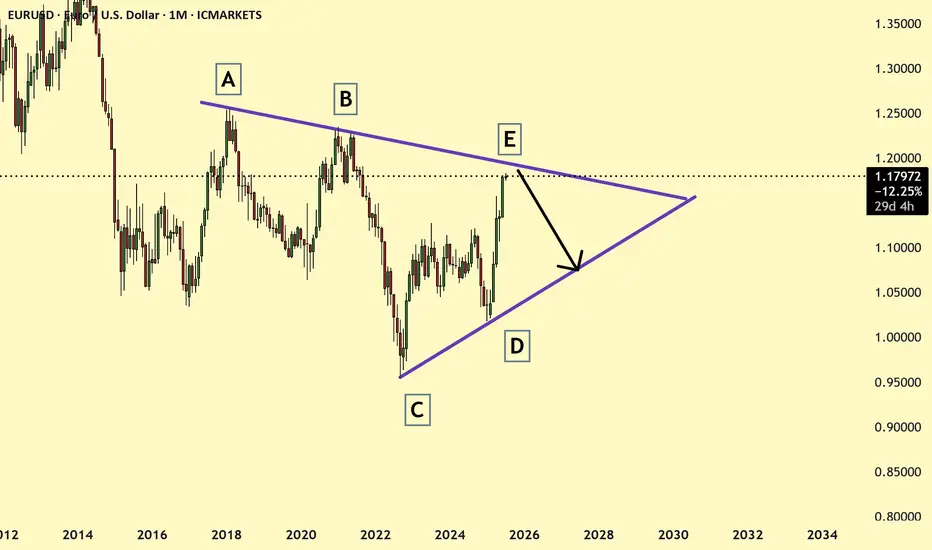
Retracement, top of the rising wedge and change of trend?I think EURUSD could retrace a bit to the the 1.16 then look for new highs around 1.19-1.20 area, that could be a potential reversal zone: long term target 1.07
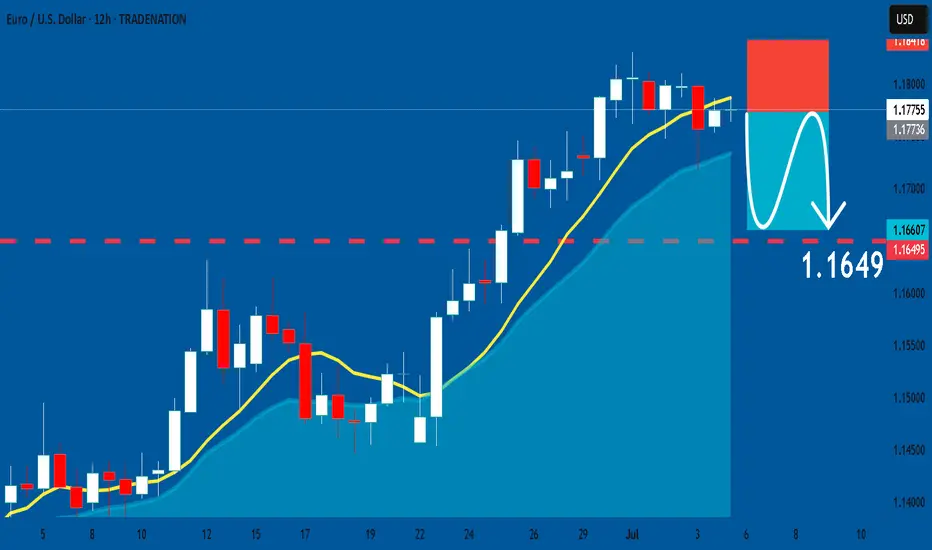
EURUSD: Short Signal Explained
EURUSD
- Classic bearish formation
- Our team expects fall
SUGGESTED TRADE:
Swing Trade
Sell EURUSD
Entry Level - 1.1775
Sl - 1.1841
Tp - 1.1649
Our Risk - 1%
Start protection of your profits from lower levels
Disclosure: I am part of Trade Nation's Influencer program and receive a monthly fee for using their TradingView charts in my analysis.
❤️ Please, support our work with like & comment! ❤️
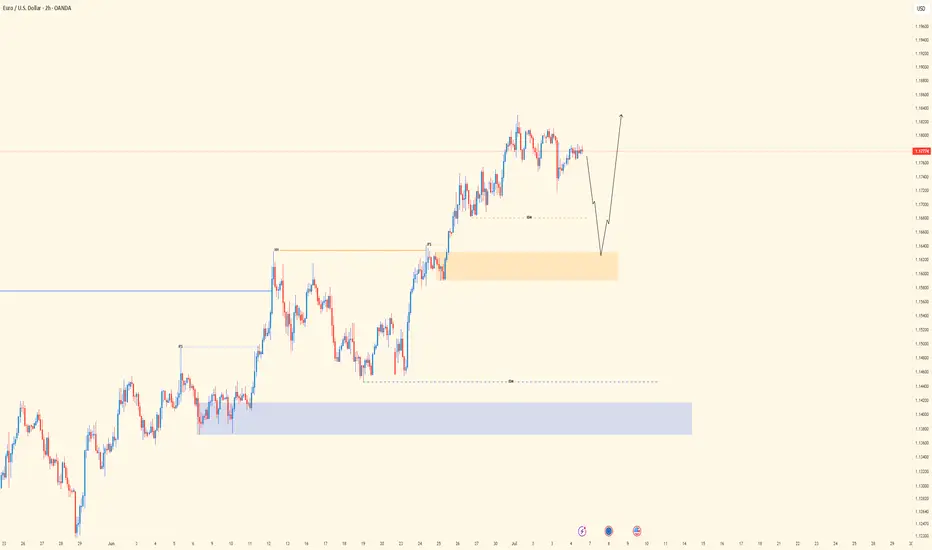
EU| - Bullish Structure Intact | Watching for SSL Sweep and RunPair: EURUSD
Bias: Bullish
Timeframes: 4H, 2H, LTFs
• 4H structure is clean and bullish — momentum’s been steady, and the market looks ready to ride higher going into next week.
• 2H gives clarity — I’m watching for a sweep of SSL into OB to set the stage for LTF confirmation.
• Entry process remains the same: wait for CHoCH, followed by sweep inside the OB zone.
🔹 Entry: After CHoCH + sweep inside OB (LTF process repeated)
🔹 Entry Zone: After confirmation within OB
🔹 Target: Structure highs — letting price unfold with the trend
Mindset: Patience pays the most. Wait for the market to come to you, not the other way around.
Bless Trading!
EURUSD - Macro Trend Shift Soon?Hello TradingView Family / Fellow Traders. This is Richard, also known as theSignalyst.
📈From a macro perspective, EURUSD has been bearish trading within the falling red channel.
Medium-term, EURUSD has been in a correction phase trading within the rising channel in orange.
Moreover, the green zone is a massive monthly resistance.
🏹 Thus, the highlighted red circle is a strong area to look for sell setups as it is the intersection of the upper red and orange trendlines and resistance.
📚 As per my trading style:
As #EURUSD is around the red circle zone, I will be looking for bearish reversal setups (like a double top pattern, trendline break , and so on...)
📚 Always follow your trading plan regarding entry, risk management, and trade management.
Good luck!
All Strategies Are Good; If Managed Properly!
~Rich
Disclosure: I am part of Trade Nation's Influencer program and receive a monthly fee for using their TradingView charts in my analysis.

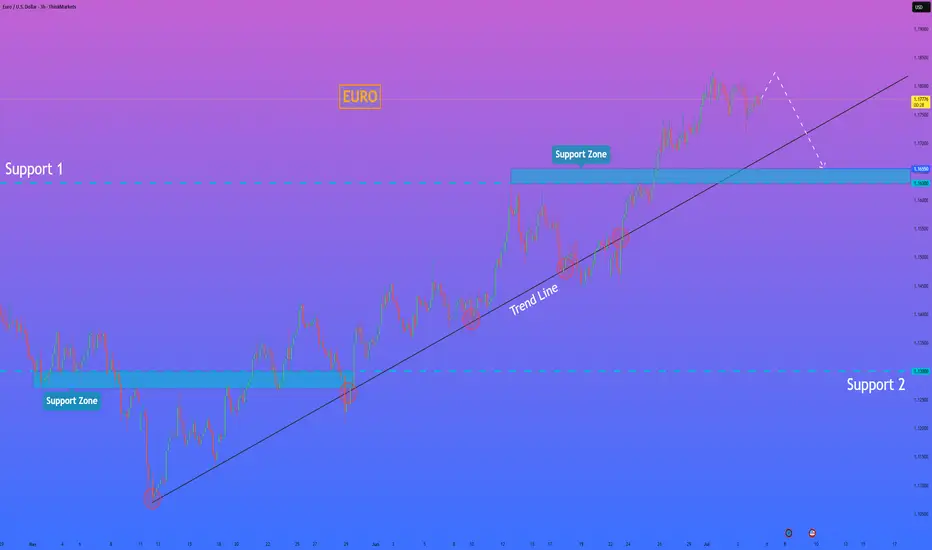
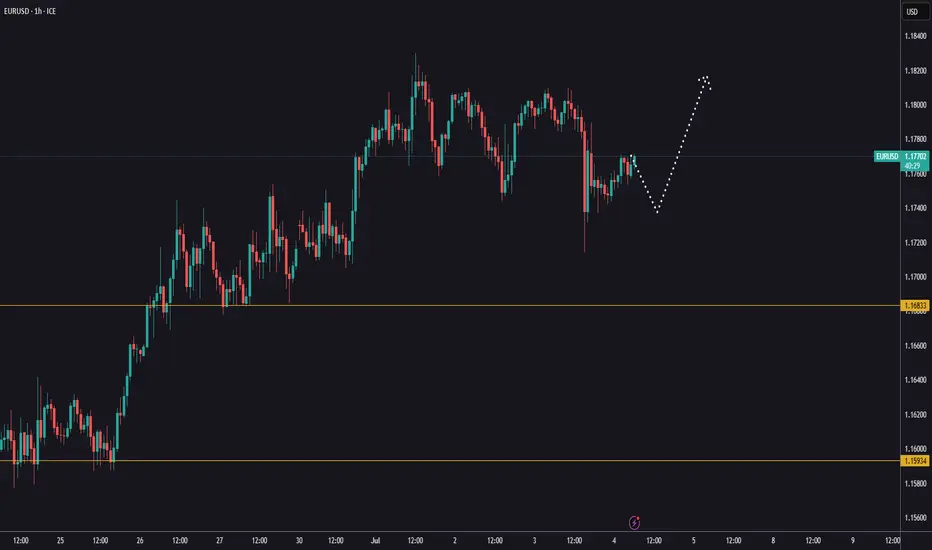
HelenP. I Euro may soon reverse and test support near $1.1655Hi folks today I'm prepared for you Euro analytics. If we look at the chart, EURUSD has been climbing steadily within an uptrend, bouncing multiple times from the trend line and making higher highs. However, despite the recent bullish structure, the pair is now showing signs of slowing momentum. The price is approaching a possible turning point near the top, and the latest candles show hesitation. Now the pair is trading near 1.1790 and still staying above the trend line, but I believe it may rise a bit more and then break down below the trend line. Once this structure is broken, I expect sellers to take control and push EURUSD toward the nearest support zone between 1.1655 and 1.1630 points. This zone acted as a key level in the past and may serve as the next area of interest for buyers. Given the extended movement and potential loss of bullish pressure, I remain bearish and expect EURUSD to move down to retest support. The level of 1.1655 is my current goal. If you like my analytics you may support me with your like/comment ❤️
Disclaimer: As part of ThinkMarkets’ Influencer Program, I am sponsored to share and publish their charts in my analysis.
EU may stop rising soon. Closes to W1 downtrend!1. Key points for reversal coming:
The bullish wave on the weekly (W1) timeframe has been rising for quite a long time and has extended significantly.
It is approaching the downtrend zone on the weekly/monthly (W1/MN) chart.
There is a twisted Kumo top in the Ichimoku Cloud, indicating potential indecision or reversal.
The current structure may be forming the right shoulder of a Quasimodo pattern.
The TDI (Traders Dynamic Index) momentum indicator is showing a strong overbought condition.
2. Plan: Sell around 1.1950!

Ready to Swipe the Pips? | EUR/USD Heist Blueprint Unlocked🏴☠️💸 EUR/USD "Fiber Heist Plan" – Thief Trader Style 💸🏴☠️
The Vault is Open – Swipe the Bullish Bags! 🚀📈💰
🌟Hi! Hola! Ola! Bonjour! Hallo! Marhaba!🌟
Welcome, Money Makers & Market Robbers! 🤑✨
Here’s the latest masterstroke based on our Thief Trading Style™—a tactical breakdown of EUR/USD primed for a bullish breakout robbery. We’re targeting the red zone 🎯—where the weak hands panic, and the real players win.
🔓 Entry Plan (Buy Setup):
🟢 "The vault is wide open!" — We’re planning bullish entries using 15m–30m timeframe swing levels.
✅ Buy Limit Orders: Plot them smartly around most recent swing lows/highs.
⚠️ Chart Alert Suggested: Eyes on the prize, don’t miss the break-in.
🛑 Risk Guard (SL Setup):
💼 Stop-Loss: Set at nearest 30-min swing low (based on your risk appetite).
Remember, it’s about preserving your loot, not just grabbing it.
🎯 Target Area:
🎯 Primary Target: 1.19000
🎯 Optional Trailing SL: Ride the wave, lock the profits as price moves.
🧲 Scalpers' Notice:
Only scalp long. Got big pockets? Jump in. Smaller bags? Swing along.
💡 Trailing stop advised—don’t let the market steal your gains.
💹 Current Market Outlook:
EUR/USD is moving bullish—supported by technical signals, macro news, COT insights, and intermarket vibes.
🧠 Use all tools: Fundamental 📊 + Sentiment 🧭 + Quant + Bias Score 📈.
📎 Want the full breakdown? Check the 👉.Liinkk.🔗
(Keep updated, conditions shift fast!)
⚠️ News Risk Alert:
🚨 Stay alert during news drops—avoid fresh trades then.
Use trailing SLs to lock profits & guard against reversal raids.
💖 Support the Robbery Plan!
💥 Hit that Boost Button 💥 if you're riding with the Thief Team!
We steal smart, we trade sharp — every day’s a new heist in this market.
See you on the next plan! Stay legendary 🐱👤💸🤑🔥

Eurousd techinical analysis.Eurousd techinical analysis next move posibale at h1 time frame.not finchinal advice.

EURUSD after the NFPYesterday, EURUSD pulled back to 1,1714.
Today is likely to be a calmer day on the markets, with no major swings expected.
Avoid rushing into new positions or using large lot sizes.
The uptrend on EURUSD remains intact, and we’ll be watching for new buying opportunities again next week.
EURUSD H1 I Bearish Reversal Based on the H1 chart, the price is approaching our sell entry level at 1.1778, a pullback resistance.
Our take profit is set at 1.1758, an overlap support.
The stop loss is set at 1.180, a swing high resistance.
High Risk Investment Warning
Trading Forex/CFDs on margin carries a high level of risk and may not be suitable for all investors. Leverage can work against you.
Stratos Markets Limited (tradu.com ):
CFDs are complex instruments and come with a high risk of losing money rapidly due to leverage. 63% of retail investor accounts lose money when trading CFDs with this provider. You should consider whether you understand how CFDs work and whether you can afford to take the high risk of losing your money.
Stratos Europe Ltd (tradu.com ):
CFDs are complex instruments and come with a high risk of losing money rapidly due to leverage. 63% of retail investor accounts lose money when trading CFDs with this provider. You should consider whether you understand how CFDs work and whether you can afford to take the high risk of losing your money.
Stratos Global LLC (tradu.com ):
Losses can exceed deposits.
Please be advised that the information presented on TradingView is provided to Tradu (‘Company’, ‘we’) by a third-party provider (‘TFA Global Pte Ltd’). Please be reminded that you are solely responsible for the trading decisions on your account. There is a very high degree of risk involved in trading. Any information and/or content is intended entirely for research, educational and informational purposes only and does not constitute investment or consultation advice or investment strategy. The information is not tailored to the investment needs of any specific person and therefore does not involve a consideration of any of the investment objectives, financial situation or needs of any viewer that may receive it. Kindly also note that past performance is not a reliable indicator of future results. Actual results may differ materially from those anticipated in forward-looking or past performance statements. We assume no liability as to the accuracy or completeness of any of the information and/or content provided herein and the Company cannot be held responsible for any omission, mistake nor for any loss or damage including without limitation to any loss of profit which may arise from reliance on any information supplied by TFA Global Pte Ltd.
The speaker(s) is neither an employee, agent nor representative of Tradu and is therefore acting independently. The opinions given are their own, constitute general market commentary, and do not constitute the opinion or advice of Tradu or any form of personal or investment advice. Tradu neither endorses nor guarantees offerings of third-party speakers, nor is Tradu responsible for the content, veracity or opinions of third-party speakers, presenters or participants.

EUR/USD Wave 5 Topped? Correction Incoming to 1.076FX_IDC:EURUSD PEPPERSTONE:EURUSD OANDA:EURUSD
📈 Chart Breakdown
🔢 Elliott Impulse Wave Completed:
Waves (1) to (5) appear to form a clean 5-wave impulse structure upward.
Final wave (5) is diverging on the oscillator (RSI), signaling potential bullish exhaustion.
🧾 ABC Correction Expected:
After the 5-wave impulse, you project an ABC corrective move:
Wave A: initial drop
Wave B: partial recovery
Wave C: deeper move likely toward the 1.07680 support (blue horizontal line)
⚠️ Bearish RSI Divergence:
The label "Div" confirms bearish divergence between price and RSI → typical at end of Wave (5).
🧠 Summary:
Structure: 5-wave impulse + projected 3-wave correction
Bias: Short-term bearish targeting 1.07680
Confirmation: Look for break below support or trendline + momentum shift

Setup Forming 15M EURUSD Sells EURUSD
4H chart currently indicates lower prices to me (even though daily is pointing bullish)
15m I am looking for price to break the MSS, when it breaks I’ll be looking at how it broke, does it have a FVG or not?
If it does then this is a A+ setup, with entry on the breaker and FVG, aiming for a 1/2 RR towards the 4H target. If the TP is past the level, I’ll adjust my tp to a minimum of 1/1 risk to reward.

EURUSD monthly pattern shows symmetrical triangle resistance ! EURUSD monthly pattern showing price reaching the symmetrical triangle resistance and currently price is nearing the resistance and may soon the price may reverse and look for the reversal on 4 hr or daily charts.
EURUSD : Next week is going to be excitingNo, it is not me saying.
It is the :
a) trendline
b) the D, d, and f
c) the price pattern
All converging at the same point @ 1.0930
Get your money ready.
Good luck.

EURUSD Potential UpsidesHey Traders, in today's trading session we are monitoring EURUSD for a buying opportunity around 1.17600 zone, EURUSD is trading in an uptrend and currently is in a correction phase in which it is approaching the trend at 1.17600 support and resistance area.
Trade safe, Joe.

EURUSD 30Min Engaged ( Bullish Entry Detected )————-
➕ Objective: Precision Volume Execution
Time Frame: 30-Minute Warfare
Entry Protocol: Only after volume-verified breakout
🩸 Bullish Wave Coming From : 1.18050
➗ Hanzo Protocol: Volume-Tiered Entry Authority
➕ Zone Activated: Dynamic market pressure detected.
The level isn’t just price — it’s a memory of where they moved size.
Volume is rising beneath the surface — not noise, but preparation.
🔥 Tactical Note:
We wait for the energy signature — when volume betrays intention.
The trap gets set. The weak follow. We execute.
EUR/USD BEST PLACE TO SELL FROM|SHORT
Hello, Friends!
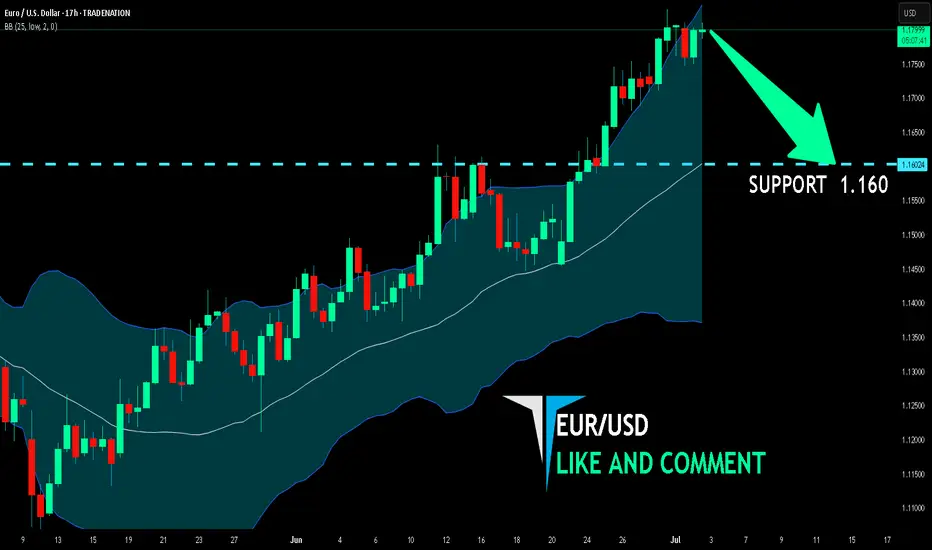
EUR/USD pair is trading in a local downtrend which know by looking at the previous 1W candle which is red. On the 17H timeframe the pair is going up. The pair is overbought because the price is close to the upper band of the BB indicator. So we are looking to sell the pair with the upper BB line acting as resistance. The next target is 1.160 area.
Disclosure: I am part of Trade Nation's Influencer program and receive a monthly fee for using their TradingView charts in my analysis.
✅LIKE AND COMMENT MY IDEAS✅
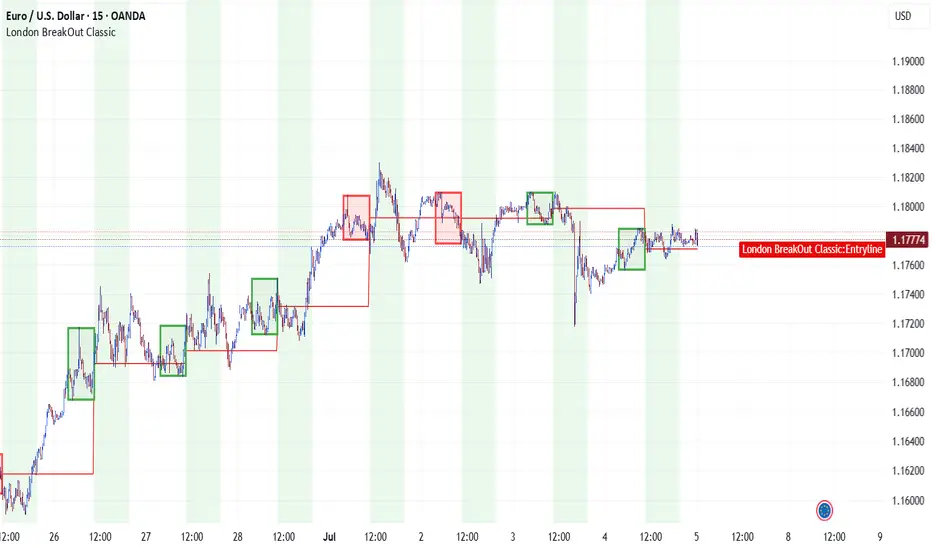
bull eurusdKey elements:
Trade signal: BUY entry at 1.17721 with target 1.17824
Strategy: "London BreakOut Classic"
Price levels: 15 key USD levels from 1.26000 (highest) to 1.00400 (lowest)
Current price: 1.17721 (highlighted in the list)
Need analysis or explanations? Let me know! 💹
Hellena | EUR/USD (4H): LONG to the resistance area 1.18466.Dear colleagues, I believe that the upward movement continues. The five-wave impulse is not over yet, and I see that the price is now in the upward wave “3” of the higher order and in the upward wave “3” of the lower order.
Therefore, I expect a small correction to the 1.16165 area, after which I expect the price to reach at least the 1.18466 resistance area.
Manage your capital correctly and competently! Only enter trades based on reliable patterns!

EurusdThe market is currently on a trending market on daily timeframe so we trade from one swing point to another swing point. On the four hours timeframe the market condition is yet to validate on sell signal so we wait for that maybe it will happen

EURUSD ADP Report (Today):
-33,000 jobs in manufacturing & goods-producing sectors
Overall ADP employment report: weaker than expected
➡️ Normally, that would imply a soft NFP tomorrow.
⸻
So Why Are People Saying NFP Will Be “Hot”?
There are 3 key reasons why some traders are still expecting a strong NFP despite a weak ADP:
⸻
1. ADP ≠ NFP
• ADP is NOT a reliable predictor of NFP.
• Historically, ADP and NFP often diverge widely — especially in months with:
• Revisions
• Government hiring
• Seasonal distortions
Example: In several past months, ADP missed badly while NFP was strong.
⸻
2. Other Labor Indicators Are Still Strong
• The JOLTS report this week showed job openings holding up
• Weekly jobless claims remain near historic lows
• Wages are still growing at 4%+
So markets may believe the labor market is stronger than ADP suggests.
⸻
3. Positioning & Speculation
• Traders often “fade” the ADP number, expecting NFP to surprise the opposite way.
• Some are just betting on momentum or trying to trap weak hands.

EURUSD📉 EURUSD – 30min Short Plan
📊 Structure: LLs & LHs forming – bearish trend confirmed
🕯️ Pattern: Bearish Engulfing at Lower High
🎯 Entry: instant
📌 Trade 1
– 🎯 TP1: 1:1
– ⚠️ Risk: 1%
📌 Trade 2
– 🎯 TP2: larger reward
🛠️ Execution:
– Place both trades at same entry
– Trail SL after TP1 hit
📎 Bias: Bearish
