EURUSD - Macro Trend Shift Soon?Hello TradingView Family / Fellow Traders. This is Richard, also known as theSignalyst.
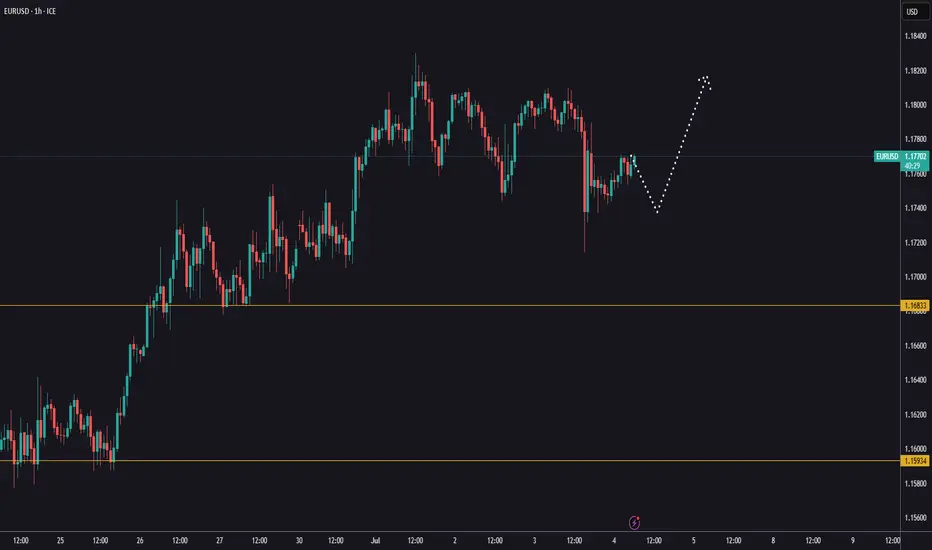
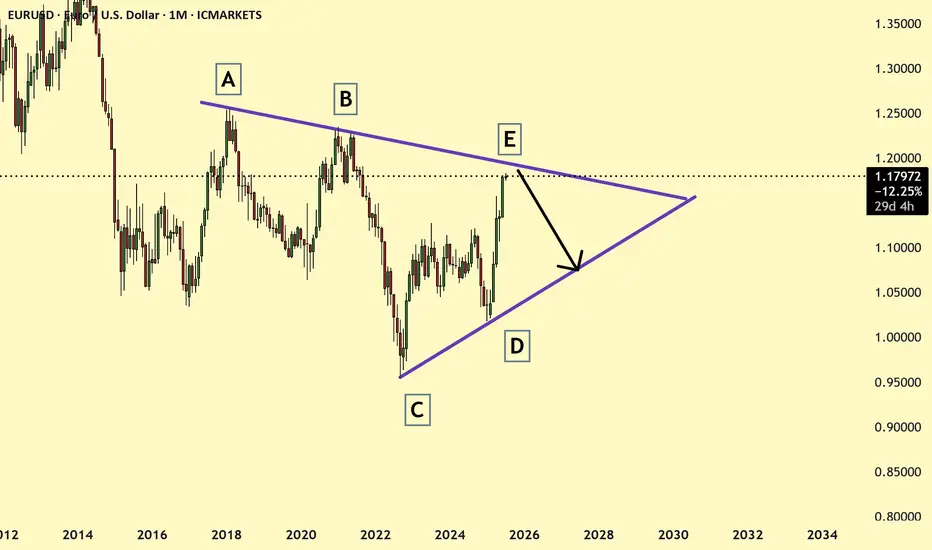
📈From a macro perspective, EURUSD has been bearish trading within the falling red channel.
Medium-term, EURUSD has been in a correction phase trading within the rising channel in orange.
Moreover, the green zone is a massive monthly resistance.
🏹 Thus, the highlighted red circle is a strong area to look for sell setups as it is the intersection of the upper red and orange trendlines and resistance.
📚 As per my trading style:
As #EURUSD is around the red circle zone, I will be looking for bearish reversal setups (like a double top pattern, trendline break , and so on...)
📚 Always follow your trading plan regarding entry, risk management, and trade management.
Good luck!
All Strategies Are Good; If Managed Properly!
~Rich
Disclosure: I am part of Trade Nation's Influencer program and receive a monthly fee for using their TradingView charts in my analysis.
USDEUR trade ideas

EURUSD after the NFPYesterday, EURUSD pulled back to 1,1714.
Today is likely to be a calmer day on the markets, with no major swings expected.
Avoid rushing into new positions or using large lot sizes.
The uptrend on EURUSD remains intact, and we’ll be watching for new buying opportunities again next week.
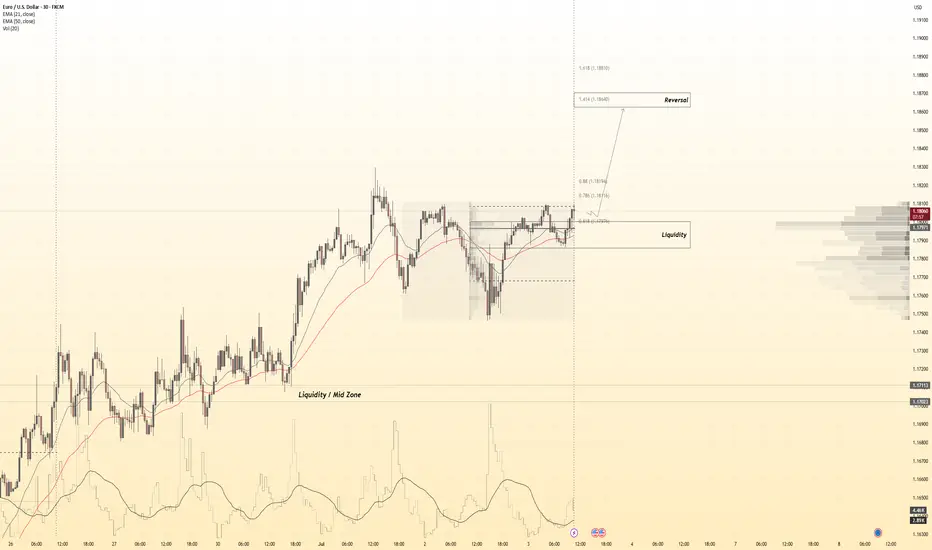
EURUSD: New-Week Technical Bias (Market Open)Multi-Timeframe Structural Outlook:
Higher Timeframes (Monthly, Weekly, Daily):
Market structure remains in a clear Ascend Sequence, reflecting an intact Buy-Side Bias Environment (BBE). Price action continues to build bullish structure, supporting an overall upward lean.
Lower Timeframe Technical Snapshot:
4H & 1H:
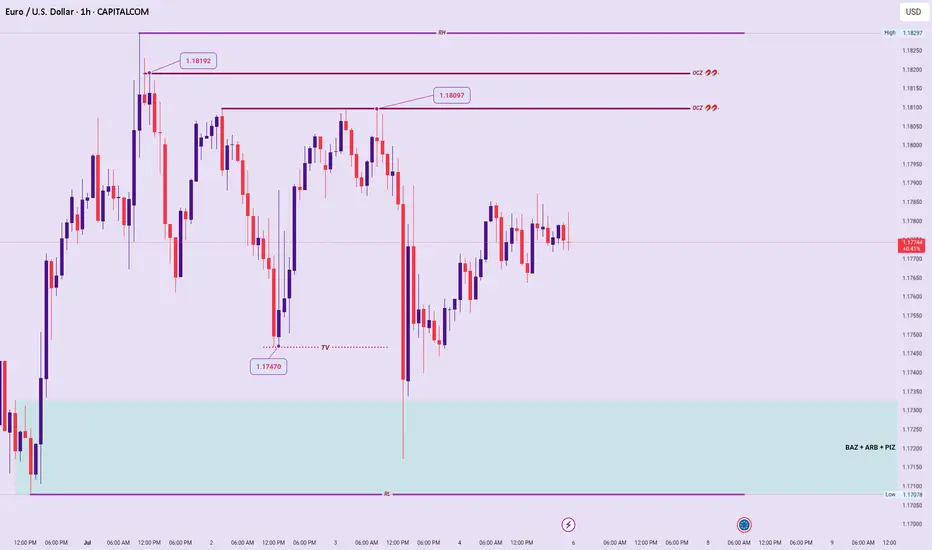
Current price consolidates within a well-defined Value Compression Phase (VCP) between 1.8297 – 1.7078, signaling temporary indecision and mixed short-term directional clarity.
Liquidity Mechanics & Trap Dynamics:
Recent Sweep Event targeting 1.7470 exploited a Trap Vector (TV), drawing price below perceived support to tap into underlying liquidity pockets within both a Price Inefficiency Zone (PIZ) and Bid Accumulation Zone (BAZ). Following this engineered sweep, price reversed, validating hidden bullish intent beneath the range.
Order Clustering Targets:
Expect clustered liquidity and potential price magnet zones at 1.8097 and 1.8192, representing logical upside attractions aligned with orderflow objectives.
Reaction Points:
VCP High (1.8297):
Break and sustained acceptance above signals potential Ascend Sequence continuation and broader bullish resumption.
VCP Low (1.7078):
Breakdown with intent below increases probability of a Trend Signature Shift (TSS), signaling bearish structure vulnerability and potential trend deterioration.
Summary:
Bullish on HT structures remains valid, but short-term bias is mixed pending confirmed resolution of the VCP range boundaries. Price behavior at the highs/lows of the compression zone will dictate next directional conviction.
EURUSD: Short Signal Explained
EURUSD
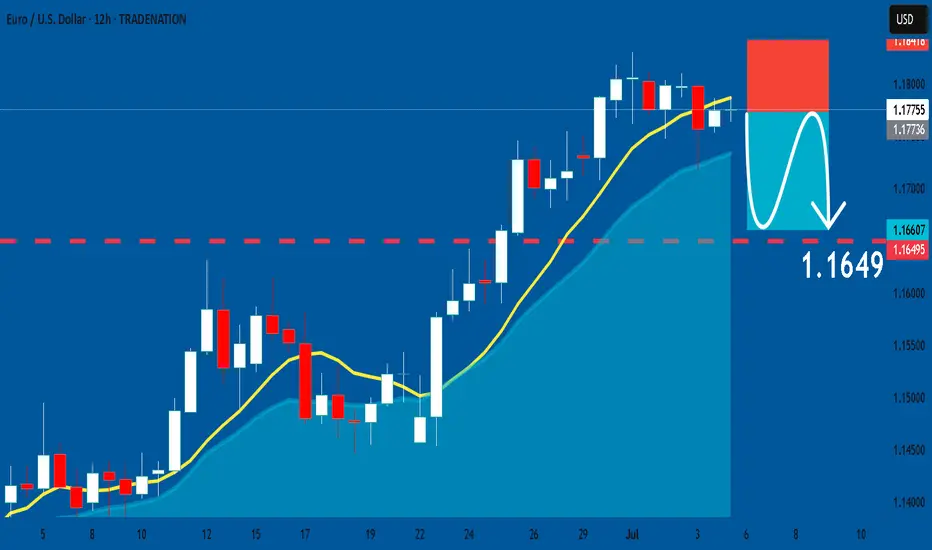
- Classic bearish formation
- Our team expects fall
SUGGESTED TRADE:
Swing Trade
Sell EURUSD
Entry Level - 1.1775
Sl - 1.1841
Tp - 1.1649
Our Risk - 1%
Start protection of your profits from lower levels
Disclosure: I am part of Trade Nation's Influencer program and receive a monthly fee for using their TradingView charts in my analysis.
❤️ Please, support our work with like & comment! ❤️
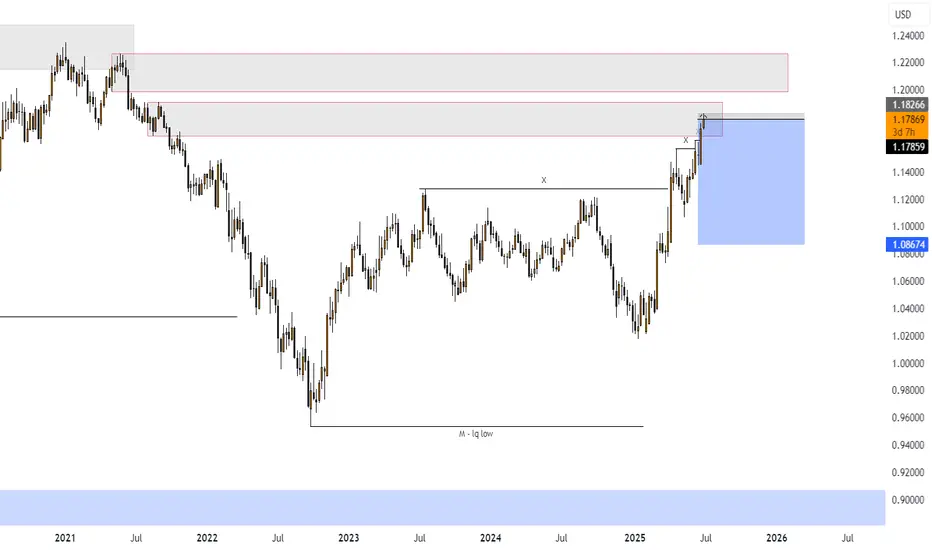
bull eurusdKey elements:
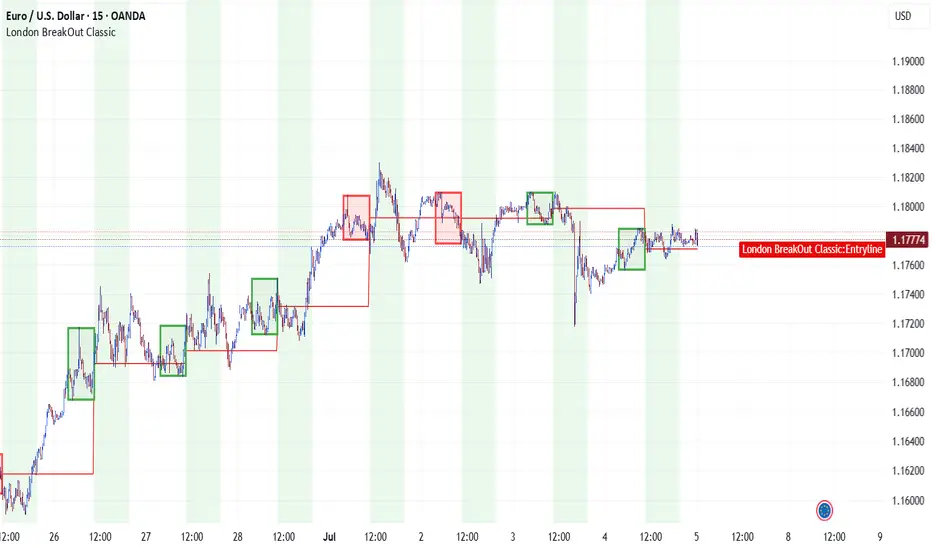
Trade signal: BUY entry at 1.17721 with target 1.17824
Strategy: "London BreakOut Classic"
Price levels: 15 key USD levels from 1.26000 (highest) to 1.00400 (lowest)
Current price: 1.17721 (highlighted in the list)
Need analysis or explanations? Let me know! 💹
EURUSD 30Min Engaged ( Bullish Entry Detected )————-
➕ Objective: Precision Volume Execution
Time Frame: 30-Minute Warfare
Entry Protocol: Only after volume-verified breakout
🩸 Bullish Wave Coming From : 1.18050
➗ Hanzo Protocol: Volume-Tiered Entry Authority
➕ Zone Activated: Dynamic market pressure detected.
The level isn’t just price — it’s a memory of where they moved size.
Volume is rising beneath the surface — not noise, but preparation.
🔥 Tactical Note:
We wait for the energy signature — when volume betrays intention.
The trap gets set. The weak follow. We execute.
EURUSD - End of the bull trend? Entering in a Range or a Bear?EURUSD is reaching a channel line on the weekly chart and it already showed us that traders are watching it.
Last week we had a very strong and climatic bull move, indicating bears were off, possibly waiting for the market to reach this level. Now that we reached it, we have a weekly candle with a long upper tail, indicating bulls taking profit and bears coming in.
The market is also overextended from the 20 EMA and a longer pullback looks reasonable and healthy at this point.
Let's see what happens in the next few weeks. But anyway, whoever made money on this bull trend is now shifting to a more cautious perspective. A pullback to the EMA is likely this year, since we didn't touch it since March 2025.

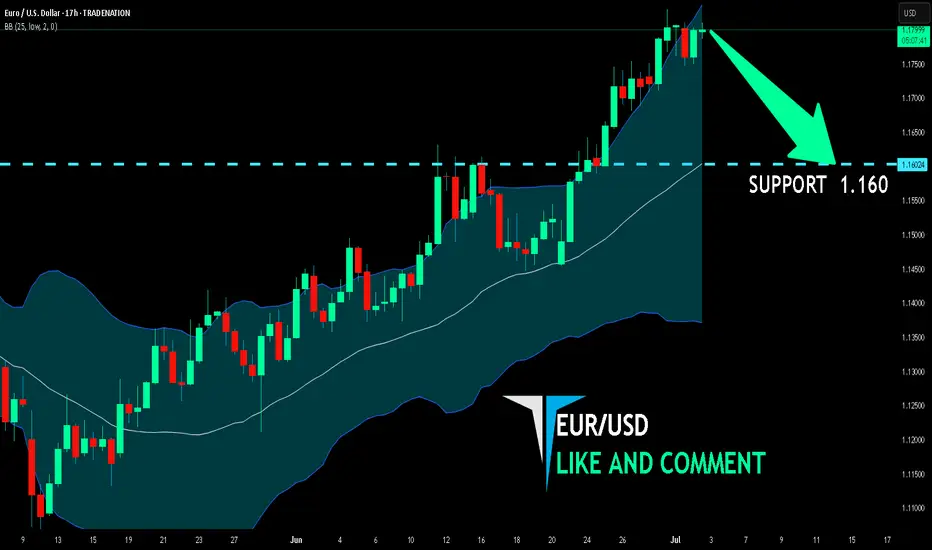
EUR/USD BEST PLACE TO SELL FROM|SHORT
Hello, Friends!
EUR/USD pair is trading in a local downtrend which know by looking at the previous 1W candle which is red. On the 17H timeframe the pair is going up. The pair is overbought because the price is close to the upper band of the BB indicator. So we are looking to sell the pair with the upper BB line acting as resistance. The next target is 1.160 area.
Disclosure: I am part of Trade Nation's Influencer program and receive a monthly fee for using their TradingView charts in my analysis.
✅LIKE AND COMMENT MY IDEAS✅
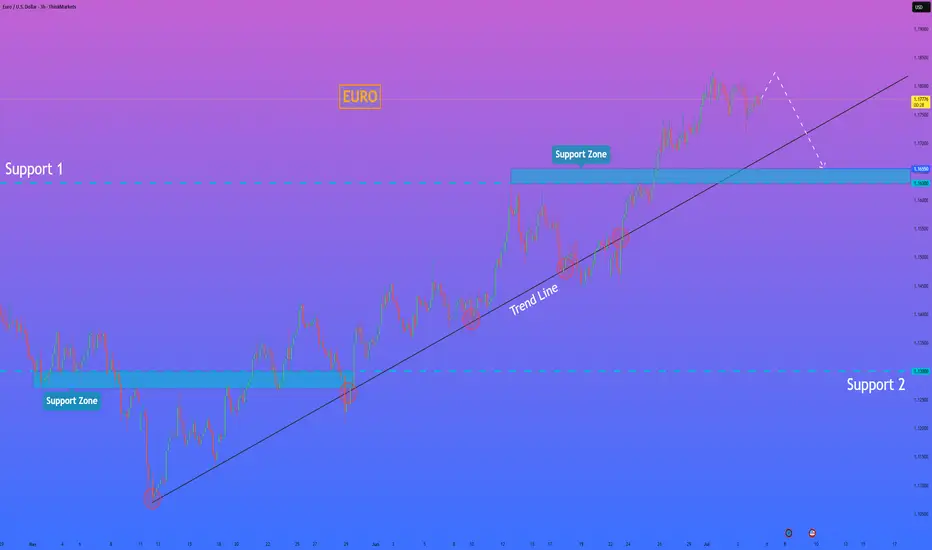
HelenP. I Euro may soon reverse and test support near $1.1655Hi folks today I'm prepared for you Euro analytics. If we look at the chart, EURUSD has been climbing steadily within an uptrend, bouncing multiple times from the trend line and making higher highs. However, despite the recent bullish structure, the pair is now showing signs of slowing momentum. The price is approaching a possible turning point near the top, and the latest candles show hesitation. Now the pair is trading near 1.1790 and still staying above the trend line, but I believe it may rise a bit more and then break down below the trend line. Once this structure is broken, I expect sellers to take control and push EURUSD toward the nearest support zone between 1.1655 and 1.1630 points. This zone acted as a key level in the past and may serve as the next area of interest for buyers. Given the extended movement and potential loss of bullish pressure, I remain bearish and expect EURUSD to move down to retest support. The level of 1.1655 is my current goal. If you like my analytics you may support me with your like/comment ❤️
Disclaimer: As part of ThinkMarkets’ Influencer Program, I am sponsored to share and publish their charts in my analysis.
EURUSD A Fall Expected! SELL!
My dear subscribers,
My technical analysis for EURUSD is below:
The price is coiling around a solid key level - 1.1784
Bias - Bearish
Technical Indicators: Pivot Points High anticipates a potential price reversal.
Super trend shows a clear sell, giving a perfect indicators' convergence.
Goal - 1.1667
My Stop Loss - 1.1853
About Used Indicators:
By the very nature of the supertrend indicator, it offers firm support and resistance levels for traders to enter and exit trades. Additionally, it also provides signals for setting stop losses
Disclosure: I am part of Trade Nation's Influencer program and receive a monthly fee for using their TradingView charts in my analysis.
———————————
WISH YOU ALL LUCK

EUR/USD Wave 5 Topped? Correction Incoming to 1.076FX_IDC:EURUSD PEPPERSTONE:EURUSD OANDA:EURUSD
📈 Chart Breakdown
🔢 Elliott Impulse Wave Completed:
Waves (1) to (5) appear to form a clean 5-wave impulse structure upward.
Final wave (5) is diverging on the oscillator (RSI), signaling potential bullish exhaustion.
🧾 ABC Correction Expected:
After the 5-wave impulse, you project an ABC corrective move:
Wave A: initial drop
Wave B: partial recovery
Wave C: deeper move likely toward the 1.07680 support (blue horizontal line)
⚠️ Bearish RSI Divergence:
The label "Div" confirms bearish divergence between price and RSI → typical at end of Wave (5).
🧠 Summary:
Structure: 5-wave impulse + projected 3-wave correction
Bias: Short-term bearish targeting 1.07680
Confirmation: Look for break below support or trendline + momentum shift

eurusd sell setup The trend on ltf is currently bearish and i have noticed a break of low plus liquidity available to grab for sells .Since its a counter trend due to HTF trend we go low risk short if given a retracement
EURUSD monthly pattern shows symmetrical triangle resistance ! EURUSD monthly pattern showing price reaching the symmetrical triangle resistance and currently price is nearing the resistance and may soon the price may reverse and look for the reversal on 4 hr or daily charts.
EURUSD: Strong Bearish Sentiment! Short!
My dear friends,
Today we will analyse EURUSD together☺️
The recent price action suggests a shift in mid-term momentum. A break below the current local range around 1.17775 will confirm the new direction downwards with the target being the next key level of 1.17696.and a reconvened placement of a stop-loss beyond the range.
❤️Sending you lots of Love and Hugs❤️

EU may stop rising soon. Closes to W1 downtrend!1. Key points for reversal coming:
The bullish wave on the weekly (W1) timeframe has been rising for quite a long time and has extended significantly.
It is approaching the downtrend zone on the weekly/monthly (W1/MN) chart.
There is a twisted Kumo top in the Ichimoku Cloud, indicating potential indecision or reversal.
The current structure may be forming the right shoulder of a Quasimodo pattern.
The TDI (Traders Dynamic Index) momentum indicator is showing a strong overbought condition.
2. Plan: Sell around 1.1950!

After all the news EUR/USD confirmed its time to pullback looking at daily up side leg extansion, almost with no retracments , it has a lot of space to fall down at least to 50% fib level , london gave couple good entry points to the downside. but its friday manage your positions more aggresive , anything could happen today,but we are bearish for the next week

EURUSD Bullish Setup: Watching for a Break and Retest📈 Looking at EURUSD right now, we’re in a strong bullish structure 🔼 — but it’s clearly overextended 🚀
As we head into the end of the week, there’s still potential for more upside today ⬆️ — but ⚠️ be cautious, since Fridays often bring retracements as we move into the weekly close 🕒📉
🔍 I’m watching for a bullish opportunity if we get a break above the current equal highs, followed by a retest and failure to break back below 🧠📊
If that setup doesn’t materialize, we’ll simply step aside and abandon the idea 🚫
💬 Not financial advice — always trade at your own risk.

Prediction for EUR/USD Sell Setup (Short from 1.1825–1.1830)
Why?
• Price recently broke down from an ascending channel (seen on your TradingView screenshot).
• Confirmed lower high structure (bearish).
• Rejection from previous resistance near 1.1830 is likely.
• Fibonacci retracement shows 1.1830 aligns with key 78.6% reversal zone.
• DXY (USD Index) strength supports EUR/USD downside pressure.
• Clean downside liquidity resting near 1.1700 and possibly 1.1630.
⚠️ Buy Setup (Long from 1.1745–1.1750)
• Confidence: ⚪ 78%
• Why Lower?
• Although 1.1745 is solid support, it is being retested too frequently.
• Momentum is weakening.
• If price stalls and fails to bounce strongly off 1.1750, it risks collapsing to 1.1700 or lower.
• MACD/Volume divergence showing early bearish bias on M15/M30 timeframes.
⸻
🧠 Verdict:
• Short trade from 1.1825–1.1830 has higher probability based on current structure and momentum.
• This would be a sell-the-retest opportunity of the broken ascending channel.
• Hold to TP1 = 1.1745, and TP2 = 1.1700, with clean smart trail logic activated after TP1.
Then wait for reversal triggers and initiate sell long setup

EURUSD ADP Report (Today):
-33,000 jobs in manufacturing & goods-producing sectors
Overall ADP employment report: weaker than expected
➡️ Normally, that would imply a soft NFP tomorrow.
⸻
So Why Are People Saying NFP Will Be “Hot”?
There are 3 key reasons why some traders are still expecting a strong NFP despite a weak ADP:
⸻
1. ADP ≠ NFP
• ADP is NOT a reliable predictor of NFP.
• Historically, ADP and NFP often diverge widely — especially in months with:
• Revisions
• Government hiring
• Seasonal distortions
Example: In several past months, ADP missed badly while NFP was strong.
⸻
2. Other Labor Indicators Are Still Strong
• The JOLTS report this week showed job openings holding up
• Weekly jobless claims remain near historic lows
• Wages are still growing at 4%+
So markets may believe the labor market is stronger than ADP suggests.
⸻
3. Positioning & Speculation
• Traders often “fade” the ADP number, expecting NFP to surprise the opposite way.
• Some are just betting on momentum or trying to trap weak hands.

Eurousdt techinical analysis.Eurousdt techinical analysis next move posibale at h1 time frame.not finchinal advice.

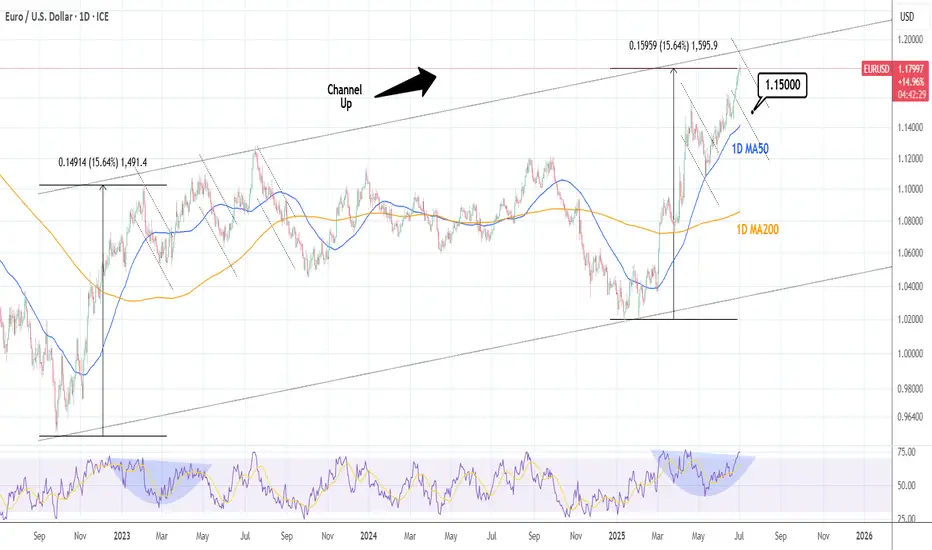
EURUSD: Correction to 1D MA50 possible.EURUSD is vastly overbought on its 1D technical outlook (RSI = 74.017, MACD = 0.011, ADX = 27.363) having completed a +15.64% rise from the February 3rd 2025 Low. That was a technical HL bottom on the 3 year Channel Up and the same amount of price increase was seen on its first bullish wave. When it peaked it made three successive highs over a 6 month period (Feb-July 2023) before starting a long term bearish sentiment creation. For now, we can expect at least a 1D MA50 test on the short-term (TP = 1.15000).
## If you like our free content follow our profile to get more daily ideas. ##
## Comments and likes are greatly appreciated. ##
EURUSD - trade - market structureDXY - trade - market structure , easy setup, clean setup , good probability, if this happen is a big win, use risk and trade managment
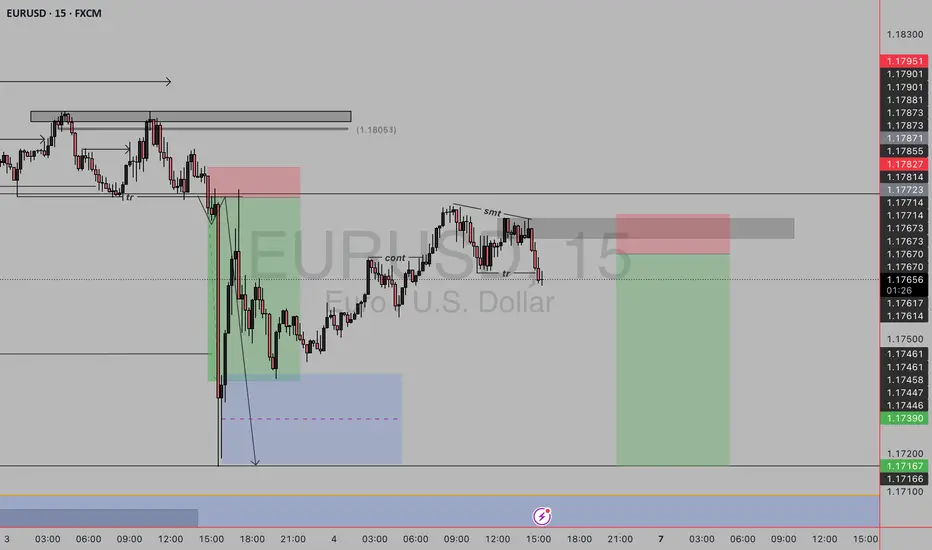
EURUSD Short, 03 JuneHTF shows clear Bearish OBs on both W and D, with doji & hammer formations hinting at buyer exhaustion. Expecting a pullback into imbalance below.
On LTF, we’ve had a clean BOS in Asia, followed by a retrace into the last 15m extreme OB – an ideal scenario for forming a new lower high in the ongoing bearish trend.
📉 Entry: 1m BOS + reaction from 15m POI
🧩 Confluence: Asia BOS, LTF structure, DXY alignment
🎯 TP: Asia Low (less than 3RR), potential to run further into HTF imbalance
🛡️ Context: All factors align – HTF bias, LTF trend, and precise entry logic.
A textbook continuation play – if we’re going to turn, this is the zone to do it.
