EUR/USD BREAKS ABOVE RESISTANCE APPROACHING JULY HIGH! Hey Traders so looking at the EUR/USD still looking bullish if you took the buy zone at 1.571 consider moving stop now to Break Even.
IMO taking the risk out of a trade is the first step before locking in a profit. So now we approach July high at 1.833.
I always say markets can do 3 things as they approach significant support or resistance.
1. Consolidate
2. Breakthrough
3. Reverse
However you want to give the market room to breathe so I would start to lock in profit by staying 3 days behind market. So if you want to try this profit taking wait until tommorows candle finishes and then move the stop 3 days behind the market at 1.1670. Then just manually let the market decide when to stop you out. Just say behind 3 days behind market.
So if bullish consider protecting stops or small profit taking.
However if Bearish I don't think now is the time to short unless a significant reversal takes place and support is broken.
Good Luck & Always use Risk Management!
(Just in we are wrong in our analysis most experts recommend never to risk more than 2% of your account equity on any given trade.)
Hope This Helps Your Trading 😃
Clifford
USDEUR trade ideas

EURUSD: Short Trade Explained
EURUSD
- Classic bearish setup
- Our team expects bearish continuation
SUGGESTED TRADE:
Swing Trade
Short EURUSD
Entry Point - 1.1727
Stop Loss - 1.1759
Take Profit - 1.1661
Our Risk - 1%
Start protection of your profits from lower levels
Disclosure: I am part of Trade Nation's Influencer program and receive a monthly fee for using their TradingView charts in my analysis.
❤️ Please, support our work with like & comment! ❤️

EURUSD"As you can see in this analysis, the price is moving within an ascending channel on the 15-minute timeframe. I expect the price to react in the area that I have marked in blue, and if I see appropriate candlestick patterns, I will enter a buy position."

EURUSD DAILY UPDATESAs the main trendline on daily timeframe breaks, with the impulsive push price upside and also it closes below the previous day high.
I personally short the idea, see chart above
this is not a financial advice.
you can have a short positions on monday open with stoploss on previous day of the highest wick candle.
This is only my view, I shared the 3hr timeframe. the idea is on Daily.
Goodluck..

EUR/USD || Correction || 1hr
💼 EUR/USD –🔻 Market Move
Timeframe: 30M | Broker: CMC | Brand: GreenFireForex™
Chart Type: Clean. Tactical. Smart Money meets Waves.
---
🔻 Correction Almost Done (Wave 5)
Classic Elliott 5-wave drop inside a bullish falling wedge.
The boys might be setting up a liquidity sweep before lift-off.
📉 Current Range: Grinding between 1.17334 – 1.17153
🕳️ Liquidity Below:
🩷 1.17158 (Mid OB)
🩶 1.17057 (Deep OB)
💜 1.16904 (Max Draw, SL sweep zone)
---
🚀 Upside Projections
🎯 TP1: 1.17253 (Quick scalp)
🧠 TP2: 1.17819 (Institutional Magnet)
---
🔫 Setup Mood:
🎯 Buy the Dip, don’t chase the breakout.
🧊 Let retail short the wedge, we buy into their fear.
🏎️ Risk-managed, sniper mode.
---
👑
"Liquidity funds lifestyle. Waves fund legacy."
---

EUR/USD Update: Bullish Momentum Builds The euro just popped above $1.17 as optimism grows around a potential US-EU trade deal, following the recent US-Japan agreement. 📊
From a technical perspective:
• The euro found support at the April high of 1.1573, rebounding sharply — a strong sign that the bull trend is still intact. 🚀
• Next resistance levels to watch:
o 1.1830 – July’s high 📅
o 1.1850 – Top of a long-term channel from 2022 📈
o 1.2000 – The 200-month moving average, a major long-term target that often attracts price reaction 🔄
📌 Key takeaway: The path of least resistance remains to the upside, with momentum building toward 1.18+ in the near term.
Disclaimer:
The information posted on Trading View is for informative purposes and is not intended to constitute advice in any form, including but not limited to investment, accounting, tax, legal or regulatory advice. The information therefore has no regard to the specific investment objectives, financial situation or particular needs of any specific recipient. Opinions expressed are our current opinions as of the date appearing on Trading View only. All illustrations, forecasts or hypothetical data are for illustrative purposes only. The Society of Technical Analysts Ltd does not make representation that the information provided is appropriate for use in all jurisdictions or by all Investors or other potential Investors. Parties are therefore responsible for compliance with applicable local laws and regulations. The Society of Technical Analysts will not be held liable for any loss or damage resulting directly or indirectly from the use of any information on this site.

DeGRAM | EURUSD in the consolidation zone📊 Technical Analysis
● Price broke the month-long bearish channel and is now basing inside the 1.165-1.169 consolidation block; repeated intraday retests (blue zone) turn the former cap into fresh support.
● A steep hourly up-sloper is carving successive higher-lows; its width and the prior channel depth project follow-through toward 1.1745 (mid-July pivot) with room to the next swing line at 1.1800.
💡 Fundamental Analysis
● FXStreet highlights softer US PMIs and a pull-back in 2-yr yields, while ECB sources flag “data-dependent patience” rather than imminent cuts—narrowing the short-rate gap and favouring the euro.
✨ Summary
Long 1.1650-1.1680; hold above the blue base targets 1.1745 ➜ 1.1800. Long view void on an H1 close below 1.1615.
-------------------
Share your opinion in the comments and support the idea with a like. Thanks for your support!

EURUSD Breaks Bullish Structure – Here’s My Trade Plan📍 Watching EURUSD closely—it's recently broken bullish (market structure) on the daily timeframe 📈.
I’m now waiting for a retrace into a fair value gap, watching for the rebalance and a possible support zone touch before the next leg up 🔄🟢.
🎥 In this idea, I walk you through:
🔍 Price action
🧱 Market structure
📊 Trend direction
📋 And my personal trade plan for this setup
Not financial advice ❌💼

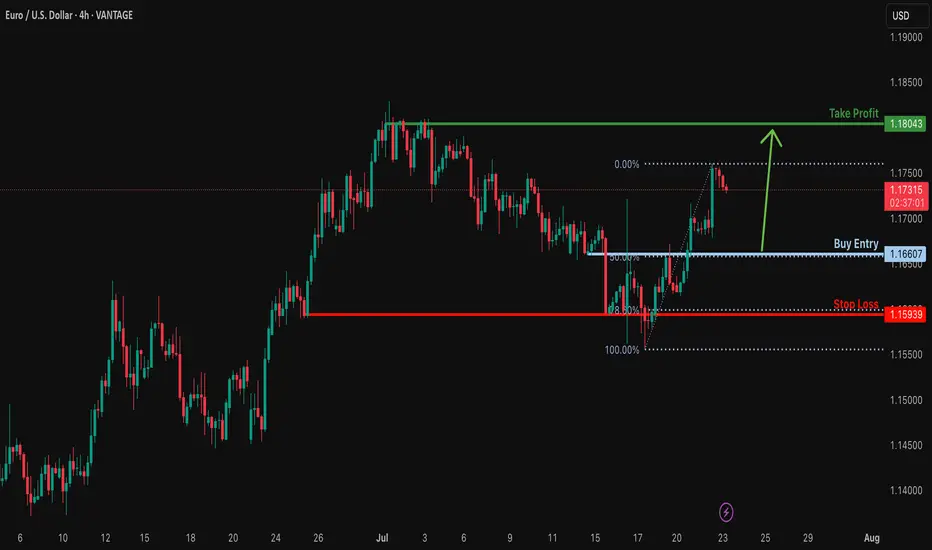
Bullish bounce?EUR/USD is falling towards the support level which is a pullback support that aligns with the 50% Fibonacci retracement and could bounce to from this level to our take profit.
Entry: 1.1660
Why we like it:
There is a pullback support that lines up with the 50% Fibonacci retracement.
Stop loss: 1.1593
Why we like it:
There is a multi swing low support that is slightly below the 78.6% Fibonacci retracement.
Take profit: 1.1813
Why we like it:
There is a swing high resistance.
Enjoying your TradingView experience? Review us!
Please be advised that the information presented on TradingView is provided to Vantage (‘Vantage Global Limited’, ‘we’) by a third-party provider (‘Everest Fortune Group’). Please be reminded that you are solely responsible for the trading decisions on your account. There is a very high degree of risk involved in trading. Any information and/or content is intended entirely for research, educational and informational purposes only and does not constitute investment or consultation advice or investment strategy. The information is not tailored to the investment needs of any specific person and therefore does not involve a consideration of any of the investment objectives, financial situation or needs of any viewer that may receive it. Kindly also note that past performance is not a reliable indicator of future results. Actual results may differ materially from those anticipated in forward-looking or past performance statements. We assume no liability as to the accuracy or completeness of any of the information and/or content provided herein and the Company cannot be held responsible for any omission, mistake nor for any loss or damage including without limitation to any loss of profit which may arise from reliance on any information supplied by Everest Fortune Group.
Take profit on EURUSD buy now and sell once from here Take profit on our EURUSD trade now and sell from this position

Could the Fiber reverse from here?The price is rising towards the pivot which is a pullback resistance and could reverse to the 1st support.
Pivot: 1.1812
1st Support: 1.1608
1st Resistance: 1.1903
Risk Warning:
Trading Forex and CFDs carries a high level of risk to your capital and you should only trade with money you can afford to lose. Trading Forex and CFDs may not be suitable for all investors, so please ensure that you fully understand the risks involved and seek independent advice if necessary.
Disclaimer:
The above opinions given constitute general market commentary, and do not constitute the opinion or advice of IC Markets or any form of personal or investment advice.
Any opinions, news, research, analyses, prices, other information, or links to third-party sites contained on this website are provided on an "as-is" basis, are intended only to be informative, is not an advice nor a recommendation, nor research, or a record of our trading prices, or an offer of, or solicitation for a transaction in any financial instrument and thus should not be treated as such. The information provided does not involve any specific investment objectives, financial situation and needs of any specific person who may receive it. Please be aware, that past performance is not a reliable indicator of future performance and/or results. Past Performance or Forward-looking scenarios based upon the reasonable beliefs of the third-party provider are not a guarantee of future performance. Actual results may differ materially from those anticipated in forward-looking or past performance statements. IC Markets makes no representation or warranty and assumes no liability as to the accuracy or completeness of the information provided, nor any loss arising from any investment based on a recommendation, forecast or any information supplied by any third-party.

EUR/USD 6E Futures Risk Management: Navigating Macro Divergence As Risk Manager at WaverVanir International, I’m constantly evaluating asymmetrical setups where macroeconomic divergence aligns with technical structure. The current EUR/USD trade is one such instance—an evolving case of volatility compression within a descending triangle, positioned beneath key resistance at 1.1730.
🔻 Bias: Bearish
🧮 Structure: Daily lower highs + descending triangle
📉 Key Break Level: 1.1612 (horizontal support)
⚠️ Invalidation: Daily close above 1.1730
📊 Probability: 65% likelihood of downside continuation into August, driven by USD real yield strength and ECB rate path lag
We’re managing this trade with dynamic risk protocols:
🔐 Option hedge overlay for tail protection
🎛️ Exposure throttle post-FOMC volatility
💡 VolanX protocol flags 1.1530 and 1.1360 as likely liquidity pools if 1.1612 gives out
🧠 Remember: It's not about being right—it's about being protected when wrong.
—
This post is part of our ongoing commitment to transparency, system-level discipline, and volatility-aware macro execution.
#WaverVanir #VolanXProtocol #MacroTrading #RiskManagement #6EFutures #EURUSD #OptionsFlow #InstitutionalTrading #ForexStrategy

EUR USD longas trend suggest and as today is Friday everything should settle this trade can be viable but the question that the target will hit would not be answered today
Please note: This is for educational purposes only and not a trading signal. These ideas are shared purely for back testing and to exchange views. The goal is to inspire ideas and encourage discussion. If you notice anything wrong, feel free to share your thoughts. In the end, to learn is to share !

EURUSD Bearish Sentiments Below LowEURUSD looks bearish at H1 for a bias of 1.15377. It's an unusual price action; the overall trend in a higher time frame is bullish, but the 1.1700 had strong bearish pressure.
The current momentum is bearish below 1.16625, making that level a key area zone.
Happy Trading,
K.

EURUSD may rally after breaking through resistanceThe correction against the global bullish trend is reaching the trading range boundary, but the bulls are not giving up. A struggle is forming, as can be seen from the price trading in the 1.155 - 1.165 zone. A rebound from 1.163 and a breakout of resistance could strengthen demand and lead to growth.
Bears are trying to keep the price below the downward resistance, but attempts to break through the line (retests) are continuing, which only increases the chances for a further rally.
The following fundamental nuances are equally important: prices are rising amid preparations by the EU for possible retaliatory measures in response to Trump's threat to impose 30% tariffs. Tomorrow, Fed Chairman Powell will speak (hints on interest rates), and on Thursday, the ECB will announce its decision (interest rates are likely to remain unchanged).

EUR/USD LOSS❌ EUR/USD Loss – Part of the Process
We were in this trade for 4 days before price made a sharp move against us, taking out our stop.
No strategy wins every time—and this is one of those times.
But losses like this are easier to handle when you have a rules-based system like the VMS strategy behind you. It’s built to:
Filter only high-probability setups
Keep emotions out of decision-making
Win more than it loses over time
📌 This wasn’t a bad trade—it was a trade that didn’t work this time. Big difference.
We stay focused. We stay patient. And we keep showing up.


EURUSD 4H - BUYOver all it's an uptrend, I believe price finish the correction by reach 61.8 Fib and price is showering Divergency in the daily Time farm, I expect price to continue with the uptrend.

EURUSD Will Collapse! SELL!
My dear subscribers,
This is my opinion on the EURUSD next move:
The instrument tests an important psychological level 1.1696
Bias - Bearish
Technical Indicators: Supper Trend gives a precise Bearish signal, while Pivot Point HL predicts price changes and potential reversals in the market.
Target - 1.1651
About Used Indicators:
On the subsequent day, trading above the pivot point is thought to indicate ongoing bullish sentiment, while trading below the pivot point indicates bearish sentiment.
Disclosure: I am part of Trade Nation's Influencer program and receive a monthly fee for using their TradingView charts in my analysis.
———————————
WISH YOU ALL LUCK

EURUSD | Time For A Pullback?The week kicked off with strong impulsive moves to the upside, leaving no room for deeper correction. Then slowly from Wednesday, we started to see a decline in strength in the bullish run.
Now, with price edging toward the next swing low for a possible bearish change of character, is this a good way to ride the stream to the downside?
Keep your A-game on as we watch price unfold, and trade reactively to price movement.
Do not forget to guard your capitals with risk management.
Good luck traders. 👍
Follow me for more and more of these analyses.
See you on the next one. 🫡

EUR USD longas the trend sugest we would yet trade longs but the pair may have a correction ...
Please note: This is for educational purposes only and not a trading signal. These ideas are shared purely for back testing and to exchange views. The goal is to inspire ideas and encourage discussion. If you notice anything wrong, feel free to share your thoughts. In the end, to learn is to share !

DeGRAM | EURUSD moving in an ascending channel📊 Technical Analysis
● Bulls punched through the 11-day descending trend-line (circled “breakout”) and immediately based on it, keeping the rising 30-min channel of higher-lows intact.
● The next confluence lies at 1.1665 where the channel mid-line meets the prior swing top; clearance unlocks the upper band / July supply at 1.1692-1.1700.
💡 Fundamental Analysis
● Friday’s slide in US 2-yr yields after soft existing-home-sales and mixed Fed speak trims dollar carry, while pre-ECB-meeting sources stress “data-dependent patience,” limiting euro downside.
✨ Summary
Long 1.1635-1.1650; hold above 1.1665 targets 1.1692 → 1.1700. Bias void on an H1 close below 1.1615.
-------------------
Share your opinion in the comments and support the idea with a like. Thanks for your support!

EURUSD BuyIntraday structure is bullish. Also Daily cycle is in play. Price did a ‘liquidity grab’ on asia low and broke scalping structure to the upside. If price is to continue higher it will mitigate the ‘order block’ and continue pushing higher.
