HelenP. I Euro can reach resistance zone and then dropHi folks today I'm prepared for you Euro analytics. If we look at the chart, we can observe a mature uptrend that has been supported by a major ascending trend line for an extended period. However, the momentum of this trend appears to be waning, as evidenced by the price's recent failure to establish new highs. The asset is currently trading below the critical resistance zone of 1.1770 - 1.1800, an area that has proven to be a significant barrier for buyers. My analysis for a short position is based on the condition of a final retest of this resistance zone. I believe the price will make another attempt to rally into this area, and a forceful rejection from this zone would serve as the confirmation that sellers are taking definitive control of the market. Such a rejection would likely initiate a strong downward impulse with sufficient momentum to break the long-standing ascending trend line, a pivotal event that would shift the market structure. Therefore, the primary goal for this bearish scenario is set at the 1.1600 level, a logical target for the price to reach after such a significant structural break. If you like my analytics you may support me with your like/comment ❤️
Disclaimer: As part of ThinkMarkets’ Influencer Program, I am sponsored to share and publish their charts in my analysis.
USDEUR trade ideas

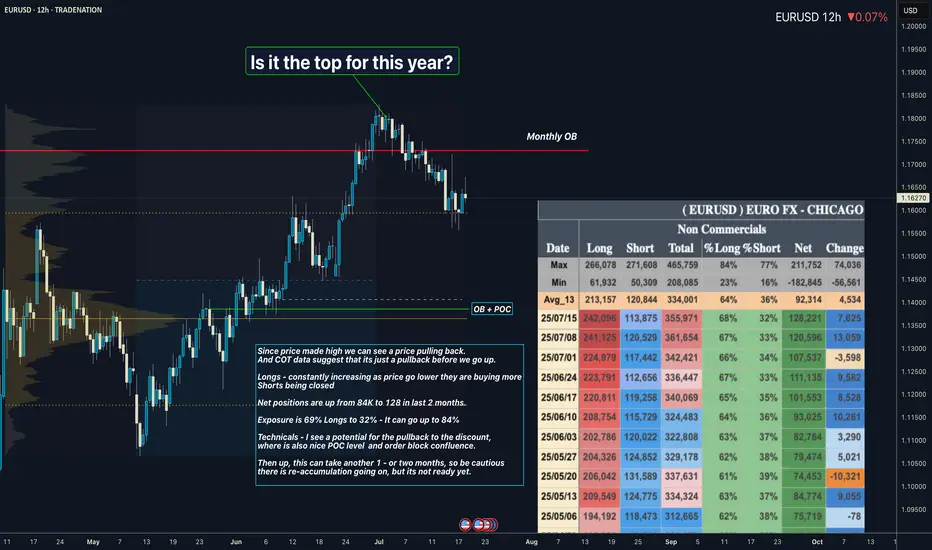
EURUSD I Its re-accumulation. COT Overview Hey what up traders welcome to the COT data and Liquidity report. It's always good to go with those who move the market here is what I see in their cards. I share my COT - order flow views every weekend.
🎯 Non Commercials added significant longs and closed shorts at the same time. So for that reason I see the highs as a liquidity for their longs profits taking.
📍Please be aware that institutions report data to the SEC on Tuesdays and data are reported on Fridays - so again we as retail traders have disadvantage, but there is possibility to read between the lines. Remember in the report is what they want you to see, that's why mostly price reverse on Wednesday after the report so their cards are hidden as long as possible. However if the trend is running you can read it and use for your advantage.
💊 Tip
if the level has confluence with the high volume on COT it can be strong support / Resistance.
👍 Hit like if you find this analysis helpful, and don't hesitate to comment with your opinions, charts or any questions.
Analysis done on the Tradenation Charts
Disclosure: I am part of Trade Nation's Influencer program and receive a monthly fee for using their TradingView charts in my analysis.
"Adapt what is useful, reject what is useless, and add what is specifically your own."
— David Perk aka Dave FX Hunter ⚔️
EUR/USD at a Turning Point:Rally or Trap for the Bulls?📉 Technical Analysis
Price has decisively broken out of the descending channel highlighted in recent weeks. The weekly support zone between 1.1540 – 1.1580 is holding, triggering a significant technical reaction. The weekly RSI has entered oversold territory, suggesting a potential short-term reversal.
Key Support: 1.1530–1.1580 (currently reacting)
Key Resistance: 1.1720–1.1780 (inefficiency & supply zone)
Base Case: Potential rebound toward 1.1720–1.1750 before next structural decision
🧠 Sentiment Analysis
82% of retail traders are long, with an average entry at 1.1635
Only 18% are short, a clear minority
This extreme imbalance suggests downside pressure may persist to flush out weak long hands before a genuine reversal takes place.
📊 COT (Commitment of Traders)
USD Index:
Non-Commercials increased both long (+663) and short (+449) positions → uncertain stance but slight USD strengthening
EUR Futures:
Non-Commercials increased long (+6,284) and short (+8,990) positions, but net increase favors the bears
This shift signals a bearish turn in sentiment among large speculators, indicating short-term downward pressure.
📈 Seasonality
In July, EUR/USD historically tends to rise, but:
This year’s price action is underperforming the seasonal pattern, showing relative weakness
August is historically flat to slightly bearish
Seasonality does not currently support a strong bullish continuation
✅ Strategic Conclusion
Current Bias: Bearish-neutral (with short-term bullish bounce expected)
A technical rebound toward 1.1720–1.1750 is likely (liquidity void + RSI bounce + retail imbalance)
However, 1.1720–1.1750 is a key supply zone to monitor for fresh shorts, in line with:
Dollar-supportive COT data
Overcrowded long retail positioning
Weak seasonal context
🧭 Operational Plan:
Avoid holding longs above 1.1750 without macro confirmation
Monitor price action between 1.1720–1.1750 for potential short re-entry
Clean breakout above 1.1780 → shift bias to neutral/bullish
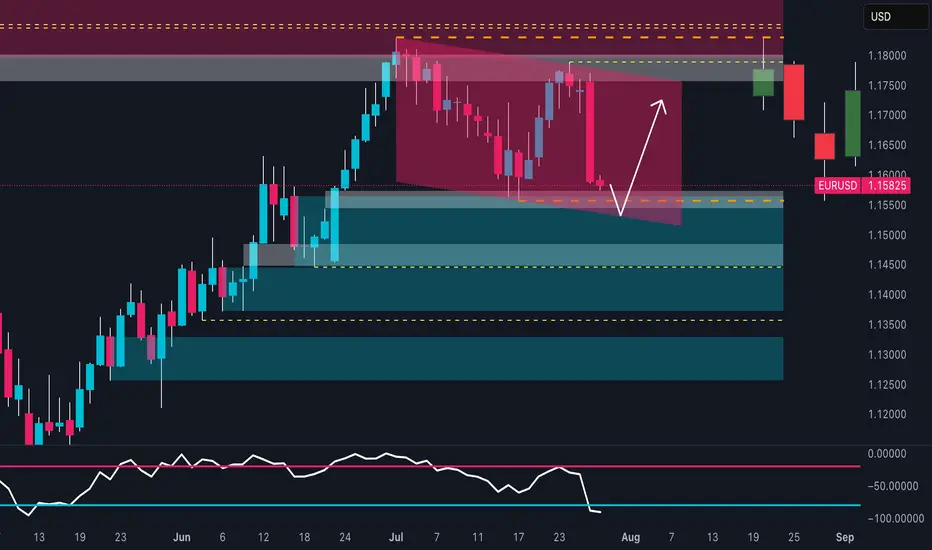
EURUSD GOING SHORT AFTER A PULL BACKPrice has completed a corrective pullback into a well-defined supply zone, where it has now mitigated previous unfilled sell orders. We’re seeing early signs of bearish intent and anticipate a continuation to the downside as supply takes control.
💡 Key Notes:
• Trend is bearish unless price closes above the mitigated supply zone.
• If price returns to the supply zone without breaking lower, it may become a distribution range.
• Patience and confirmation are critical — no need to rush entry without market structure break.
Let me know your thoughts

Fiber (EU) This is my Analysis for the Eurousd, Fiber has been in down trend for years now and comparing the US Central bank interest rates with the European Central bank it shows that the Dollar is Stronger compared to the Euro, Blending the Fundamentals with Technical Analysis.

EURUSD - New Bearish Move!Hello Traders !
The EURUSD broke the support level (1.14810 - 1.14463).
This key level becomes new resistance!
So, I expect a bearish move📉
_______________
TARGET: 1.12955🎯

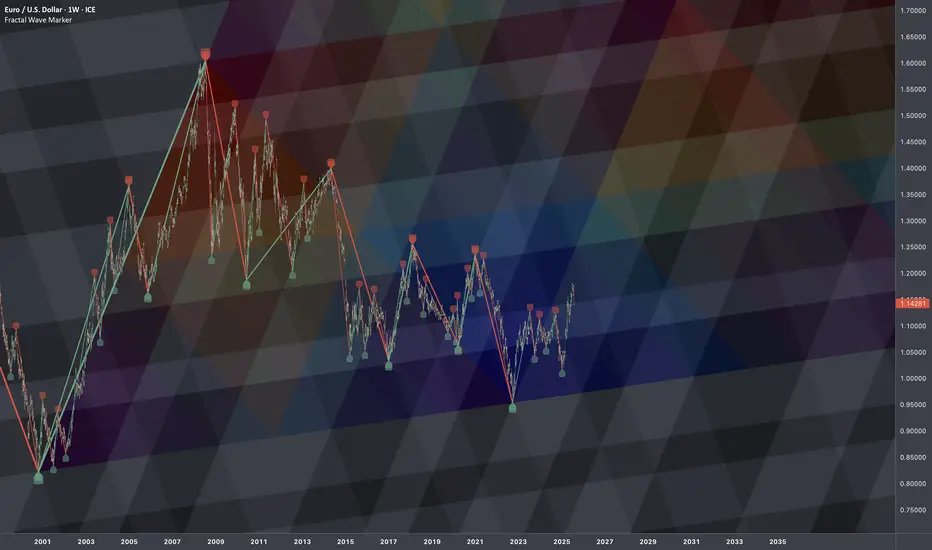
€/$: Fractal Geometry (Cycle 2000-2022)🏛️ Research Notes
Research on order in chaos using scaling laws and math sequences found in nature.
Sierpinski triangle will be used as basic heatmap layer - orienteer for next buildups.
Cross-cycle interconnection 3 cycle knot
Considering the fact that structurally current price is in a new cycle, the core structure which is previous cycle can be extended with another layer that emphasizes phase of the cycle in its angle.
Extended Fibonacci Sierpinski Triangle should look like this:
EURUSD: Buy or Sell?Dear friends!
On our 1D chart, after careful observation, we can see that a wedge pattern is forming. After EURUSD breaks out of the previous trend and completes the correction phase, a new downtrend is likely to be established.
Adam's target is to break above the 1.16000 support level and head towards the lower support level of 1.140000, which is where the pine attracts a large amount of buyers.
And you, do you think the price will go up or down? What is the target for your thinking?

EURUSD: Buyers Like the New Trade Deals With The US!Welcome back to the Weekly Forex Forecast for the week of July 28 - Aug 1st.
In this video, we will analyze the following FX market:
EURUSD
Buyers reacting positively to the announcements of trade deals with the US.
Longs are the play until we see a bearish break of significant structure.
FOMC and NFP looming, so be careful the markets don't reverse on your trades!
Wait patiently for buy setups.
Enjoy!
May profits be upon you.
Leave any questions or comments in the comment section.
I appreciate any feedback from my viewers!
Like and/or subscribe if you want more accurate analysis.
Thank you so much!
Disclaimer:
I do not provide personal investment advice and I am not a qualified licensed investment advisor.
All information found here, including any ideas, opinions, views, predictions, forecasts, commentaries, suggestions, expressed or implied herein, are for informational, entertainment or educational purposes only and should not be construed as personal investment advice. While the information provided is believed to be accurate, it may include errors or inaccuracies.
I will not and cannot be held liable for any actions you take as a result of anything you read here.
Conduct your own due diligence, or consult a licensed financial advisor or broker before making any and all investment decisions. Any investments, trades, speculations, or decisions made on the basis of any information found on this channel, expressed or implied herein, are committed at your own risk, financial or otherwise.

Trading Divergences With Wedges in ForexTrading Divergences With Wedges in Forex
Divergence trading in forex is a powerful technique for analysing market movements, as is observing rising and falling wedges. This article explores the synergy between divergence trading and wedges in forex, offering insights into how traders can leverage these signals. From the basics to advanced strategies, learn how you could utilise this approach effectively, potentially enhancing your trading skills in the dynamic forex market.
Understanding Divergences
In forex trading, the concept of divergence plays a pivotal role in identifying potential market shifts. A divergence in forex, meaning a situation where price action and a technical indicator like the Relative Strength Index (RSI) or Moving Average Convergence Divergence (MACD) move in opposite directions, often signals a weakening trend. This discrepancy is a valuable tool in divergence chart trading, as it may indicate a possible reversal or continuation of the current trend.
There are two primary types of divergence in forex—regular and hidden. Regular divergence occurs when the price makes higher highs or lower lows while the indicator does the opposite, often signalling a reversal. Hidden divergence, on the other hand, happens when the price makes lower highs or higher lows while the indicator shows higher highs or lower lows, typically suggesting a continuation of the current trend.
Trading Rising and Falling Wedges
Rising and falling wedges are significant patterns in forex trading, often signalling potential trend reversals. A rising wedge, formed by converging upward trendlines, often indicates a bearish reversal if it appears in an uptrend. Conversely, a falling wedge, characterised by converging downward trendlines, typically reflects a bullish reversal if it occurs in a downtrend.
Traders often look for a breakout from these patterns as a signal to enter trades. For rising wedges, a downward breakout can be seen as a sell signal, while an upward breakout from a falling wedge is often interpreted as a buy signal. When combined with divergences, this chart pattern can add confirmation and precede strong movements.
Best Practices for Trading Divergences
Trading divergence patterns in forex requires a keen eye for detail and a disciplined, holistic approach. Here are key practices for effective trading:
- Comprehensive Analysis: Before trading on divergence and wedges, be sure to analyse overall market conditions.
- Selecting the Right Indicator: Choose a forex divergence indicator that suits your trading style. Common choices include RSI, MACD, and Stochastic.
- Confirmation Is Key: It’s best to watch for additional confirmation from price action or other technical tools before entering a trade.
- Risk Management: Traders always set stop-loss orders to manage risk effectively. Divergence trading isn't foolproof; protecting your capital is crucial.
- Patience in Entry and Exit: Be patient as the divergence develops and confirm with your chosen indicators before entering or exiting a trade.
Strategy 1: RSI and Wedge Divergence
Traders focus on regular divergence patterns when the RSI is above 70 (overbought) or below 30 (oversold), combined with a rising or falling wedge pattern. The strategy hinges on identifying highs or lows within these RSI extremes. It's not crucial if the RSI remains consistently overbought or oversold, or if it fluctuates in and out of these zones.
Entry
- Traders may observe a regular divergence where both the price highs/lows and RSI readings are above 70 or below 30.
- After the formation of a lower high (in an overbought zone) or a higher low (in an oversold zone) in the RSI, traders typically watch as the RSI crosses back below 70 or above 30. This is accompanied by a breakout from a rising or falling wedge, acting as a potential signal to enter.
Stop Loss
- Stop losses might be set just beyond the high or low of the wedge.
Take Profit
- Profit targets may be established at suitable support/resistance levels.
- Another potential approach is to exit when the RSI crosses back into the opposite overbought/oversold territory.
Strategy 2: MACD and Wedge Divergence
Regarded as one of the best divergence trading strategies, MACD divergence focuses on the discrepancy between price action and the MACD histogram. The strategy is particularly potent when combined with a rising or falling wedge pattern in price.
Entry
- Traders typically observe for the MACD histogram to diverge from the price. This divergence manifests as the price reaching new highs or lows while the MACD histogram fails to do the same.
- The strategy involves waiting for the MACD signal line to cross over the MACD line in the direction of the anticipated reversal. This crossover should coincide with a breakout from the rising or falling wedge.
- After these conditions are met, traders may consider entering a trade in anticipation of a trend reversal.
Stop Loss
- Stop losses may be set beyond the high or low of the wedge, which may help traders manage risk by identifying a clear exit point if the anticipated reversal does not materialise.
Take Profit
- Profit targets might be established at nearby support or resistance levels, allowing traders to capitalise on the expected move while managing potential downside.
Strategy 3: Stochastic and Wedge Divergence
Stochastic divergence is a key technique for divergence day trading in forex, especially useful for identifying potential trend reversals. This strategy typically employs the Stochastic Oscillator with settings of 14, 3, 3.
Entry
- Traders may look for divergence scenarios where the Stochastic readings are above 80 or below 20, mirroring the RSI approach.
- This divergence is observed in conjunction with price action, forming a rising or falling wedge.
- Entry may be considered following a breakout from the wedge, which signals a potential shift in market direction.
Stop Loss
- Setting stop losses just beyond the high or low of the wedge might be an effective approach.
Take Profit
- Profit targets may be set at key support/resistance levels.
The Bottom Line
Divergence trading, coupled with the analysis of rising and falling wedges, offers a comprehensive approach to navigating the forex market. By integrating the discussed strategies with sound risk management and market analysis, traders may potentially enhance their ability to make informed decisions in the dynamic world of forex.
This article represents the opinion of the Companies operating under the FXOpen brand only. It is not to be construed as an offer, solicitation, or recommendation with respect to products and services provided by the Companies operating under the FXOpen brand, nor is it to be considered financial advice.

DeGRAM | EURUSD dropped below the support level📊 Technical Analysis
● EURUSD confirmed a double rejection below long-term resistance with two lower highs and broke channel support at 1.1567.
● Price is now trending within a descending channel toward 1.1363, with lower targets pointing into the 1.12–1.11 demand zone.
💡 Fundamental Analysis
● US Q2 GDP surprised to the upside, reinforcing the Fed’s hawkish tone, while Eurozone CPI inflation cooled below forecast.
● Diverging central bank trajectories continue to widen yield differentials in favor of the dollar, sustaining bearish euro flows.
✨ Summary
Short bias confirmed below 1.1567. Break of 1.1450 opens path to 1.1363 ➜ 1.1200 zone. Watch for rallies to fade below trendline.
-------------------
Share your opinion in the comments and support the idea with a like. Thanks for your support!

Closed Longs, Now Selling Rallies on EURUSD ReversalAs mentioned in my previous posts, I’m been bullish on EURUSD in the medium term, targeting 1.20 and even beyond.
But no pair—especially not EURUSD, which tends to move more steadily and rationally—goes up in a straight line.
________________________________________
🔹 Last week, the pair stalled just below 1.18, and I decided to close my long trade with a +150 pip gain. That proved to be a wise call, as price dropped hard shortly after.
________________________________________
📉 What’s happening now?
• EURUSD has broken below the rising trendline
• More importantly, it’s broken below the neckline of a double top pattern
• Now trading around 1.1535
This opens the door for a deeper correction, and I expect we could see a test of the 1.1150–1.1100 zone by the end of summer.
________________________________________
📌 Trading Plan:
• I’m now in sell-the-rally mode
• Ideal short entry: around 1.1650, where we also get a favorable 1:3+ risk-reward
• Watch also for interim support around 1.1400
________________________________________
Conclusion:
The bigger picture remains bullish— but this correction looks healthy and isn’t done yet.
Selling rallies makes more sense now, until the structure tells us otherwise.
Disclosure: I am part of TradeNation's Influencer program and receive a monthly fee for using their TradingView charts in my analyses and educational articles.

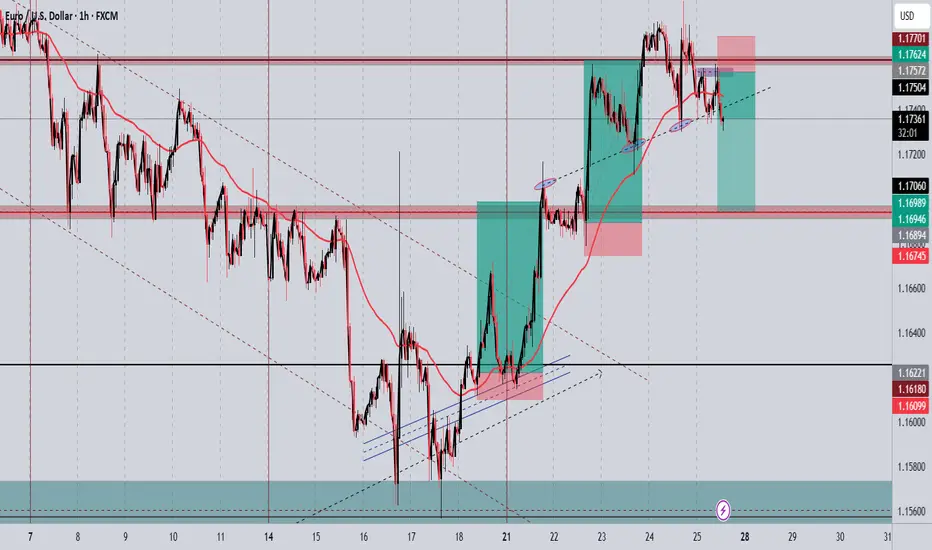
EUR/USD – Short from Channel TopHi Traders , Took a short on EUR/USD after price rejected the top of the ascending channel.
Entry: 1.17545
Stop Loss: 1.18015
Take Profit: 1.17098
📌 Why I took this trade:
Price is showing rejection at the upper trendline + near resistance (R1). RSI is cooling off, so I’m expecting a move back to the demand zone around 1.1710.
Clean structure, low risk, good reward.
Just my take, not financial advice.
What do you think — continuation or rejection?

EURUSD NOWWe've got EURUSD now waiting for a mitigation of the OB to take 15m high or maybe shorting until 1D low. but most probably we take long because of a weak body close that signals a weak power of sellers.

Euro may reach resistance level, break it and continue to growHi guys, this is my overview for EURUSD, feel free to check it and write your feedback in comments👊
For an extended period, the price was dictated by a descending channel, with each rally attempt failing at its upper boundary.
The downward trend culminated in a test of the crucial support level at $1.1635, where sellers were unable to secure a foothold, signaling a potential momentum shift.
This shift was confirmed when buyers took control, launching an upward impulse that decisively breached the long-standing resistance of the channel's upper trendline.
After the breakout, the price established a new local support base above the former channel, solidifying the change in market structure.
The subsequent rally carried the asset's price to the significant horizontal resistance zone around $1.1755, where the upward advance has temporarily stalled.
I expect that after a brief consolidation, bullish pressure will resume, enabling the price to break the $1.1755 barrier and continue towards the $1.1820 target.
If this post is useful to you, you can support me with like/boost and advice in comments❤️
Disclaimer: As part of ThinkMarkets’ Influencer Program, I am sponsored to share and publish their charts in my analysis.

Structure break and trend shift🚀 After a clean breakout from the descending channel, price formed a rising structure—but momentum is fading.
🔴 Lower highs are forming and we’ve got a clear rejection at the top of the ascending channel.
📌 Trade Idea:
Entry: 1.1739
Stop Loss: 1.1778 (above recent high)
Take Profit: 1.1676 (structure support)
Risk-Reward: ~1:2 ✅
🧠 Why this setup?
Structure break & retest in action
Bearish pressure building after bullish exhaustion
Reversal patterns aligning at key zones (circles show historic turning points)

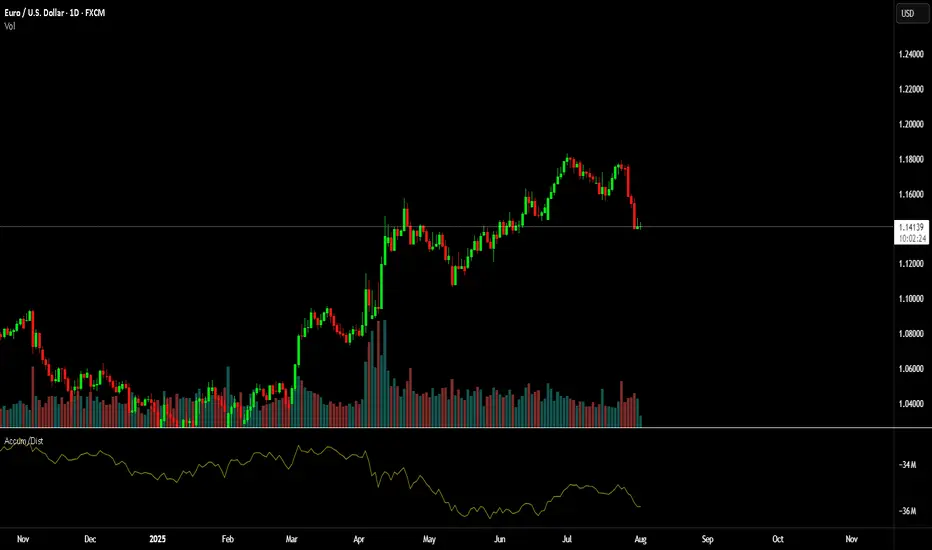
Simple Psychology Tips Using Volume for Better TradingMany newer traders assume that when someone says "psychology" in trading, they are referring to mindset.
It is also widely believed that trading is about the BEST entries.
Now, think of it this way. It is not about winning trades, it is actually about managing losses well to allow you to take the winners over and over again. You might think that a 3 to 1 risk-to-reward strategy is boring, you might have gone all in on your favourite crypto project. But what makes the difference between gambling and trading is actually very, very simple. So simple, in fact, many overlook it or simply ignore it.
Most seek a silver bullet - high win rates and perfectly timed entries, then they overleverage and move stops on the one "good trade" they are seeking to make.
Whilst doing this, they tend to overload the 6 monitors they have purchased to trade with a thousand indicators, which they don't really need.
The candlesticks tell a story, volume supports that story. When you learn any technique from Elliott Waves to Wyckoff, they all have a dependence on volume - even if the correlation is not apparent.
Look at this first image.
Price had moved down since the vertical line, the AD line also moved down - sell-off, in full swing. But then volume starts to shift before the AD line starts to increase.
Now, look at what happens next...
As we move forward and the new vertical line shows where volume spiked, the AD line starts to decrease as the price continues to rise.
This is enough of a story to start your analysis.
We then get a move with a lower high formed.
As this plays out, the sell-side volume rises, creating momentum for the short position.
Look a little closer and you will see, that the volume on the move up just before the drop was also decreasing. Making a divergence to price.
You might feel that the market is against you, or that the big players are single-handedly seeking your stops. But the truth is, the psychology in moves such as this one shown is where most retail traders either have greed that markets will only go up for ever or the fear that they are missing out on a market that only goes up forever.
It is that herd mentality that generates the liquidity for the professionals.
Losing 1% on a trade, is part of the process, risking 80%> on a single move will make you paper rich for about 10 minutes before the real losses set in.
This is where the psychology and the basic techniques such as risk management and understanding what candlesticks and volume bars are telling you, will make a world of difference to your results.
A/D line and volume are free on @TradingView and to be fair you don't need to overcomplicate it more than that!
Stay safe, have a great weekend all!!!
Disclaimer
This idea does not constitute as financial advice. It is for educational purposes only, our principal trader has over 25 years' experience in stocks, ETF's, and Forex. Hence each trade setup might have different hold times, entry or exit conditions, and will vary from the post/idea shared here. You can use the information from this post to make your own trading plan for the instrument discussed. Trading carries a risk; a high percentage of retail traders lose money. Please keep this in mind when entering any trade. Stay safe.
EURUSD may fall, but it's all about the FOMC DecisionEURUSD may fall, but it's all about the FOMC Decision
During the first 2 weeks of July, EURUSD fell from 1.18000 to 1.1550 and then the price rose again due to renewed tariffs.
Trump's comments regarding Powell and tariffs, according to which the EU and the US may reach an agreement soon, renewed the strength of EURUSD.
However, this time it is more related to the FOMC. If the FED cuts rates, EURUSD can drop further. When they didn't cut rates, the USD was weak or didn't move at all.
Let's see.
If Powell makes any surprises this time, EURUSD could fall, as shown in the chart, from 1.1800 to 1.1550, which is almost 250 pips lower.
Key support zones: 1.1660 and 1.1580
You may find more details in the chart!
Thank you and Good Luck!
PS: Please support with a like or comment if you find this analysis useful for your trading day
Disclosure: I am part of Trade Nation's Influencer program and receive a monthly fee for using their TradingView charts in my analysis.

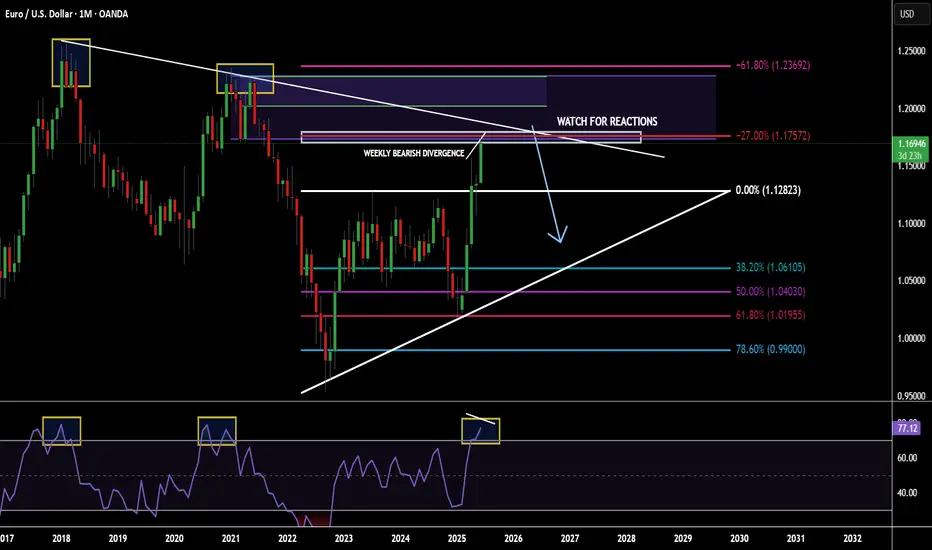
POTENTIAL EURUSD SHORT OPPORTUNITY...POSITION TRADEHello hello TradingView family! Hope you guys are doing amazingly well! Just wanted to come on here and make another post for a potential longer term opportunity I am seeing on the major currency pair EURUSD. So put your seat belts on and let's dive in!!
OK so I'm going to keep this very very simple. Not because I don't want to go in depth but because my trading is very simple and I'm just going to give it to you straight. So here are the points
1. Price is @ monthly supply
2. Price has made new highs & sitting at a monthly fib extension
3. Monthly RSI overbought conditions
4. Weekly has bearish divergence forming
5. Weekly/Daily buyer is slowing down
Make sense? If not..then I know you will figure it out. Watch for price to potentially poke a little higher but nice confluences for a fall in price. Appreciate you all!
EURUSD: Bullish Continuation is Expected! Here is Why:
Remember that we can not, and should not impose our will on the market but rather listen to its whims and make profit by following it. And thus shall be done today on the EURUSD pair which is likely to be pushed up by the bulls so we will buy!
Disclosure: I am part of Trade Nation's Influencer program and receive a monthly fee for using their TradingView charts in my analysis.
❤️ Please, support our work with like & comment! ❤️

Major U.S. News Ahead—Will EURUSD Pivot?Good morning, my friends 👋
Here’s my EURUSD market analysis 📉
Currently, the pair is in a downtrend. I expect this downward move to end around 1.14899 or 1.14536, where a potential buying opportunity may emerge. I personally plan to enter a buy position once price reaches those zones 💼
Also, keep an eye on major U.S. economic reports being released today—they could trigger increased volatility 🔔
Every like you send is a huge source of motivation for me to keep sharing high-quality analysis 🙏 Thanks to everyone supporting the channel 💙

EUR/USD Short Setup – Bearish Reversal OpportunityPrice has rejected near resistance, forming lower highs.
Potential bearish divergence on momentum indicators (RSI/MACD).
Market sentiment suggests euro strength may be cooling after recent ECB hold.
Dollar shows signs of stabilization, adding downward pressure to the pair.
🔹 Trade Details:
Entry: 1.17572
Take Profit: 1.16946
On the look out for a break above 1.14829 to confirm BullishHi Friends - Here is my own bias. Not a financial advise.
1. Buying intent spotted after the break of structure on the 1h time frame at 1.14381 BOS
2. Price retraced back to the liquidity that drove price back up on July 10th at 1.14005
3. We are looking out for price to close above 1.14805 and seek liquidity to move to the up side.
4. Possible consolidation between 1.14024 and 1.14858
Violation of the setup above will lead to a movement to the downside.
See you on the profitable end.
The Surge!
