eurusd upin my pov euro dollar is going up, first instance until 1.1670 then 1.1730 after that maybe until 1.18 oreven 1.19
USDEUR trade ideas

It has a good risk-reward ratio.Hello friends..
The transaction shown, if it reaches the specified area, you can enter the transaction in the lower time frame with confirmation.
Follow our page to see more analysis.
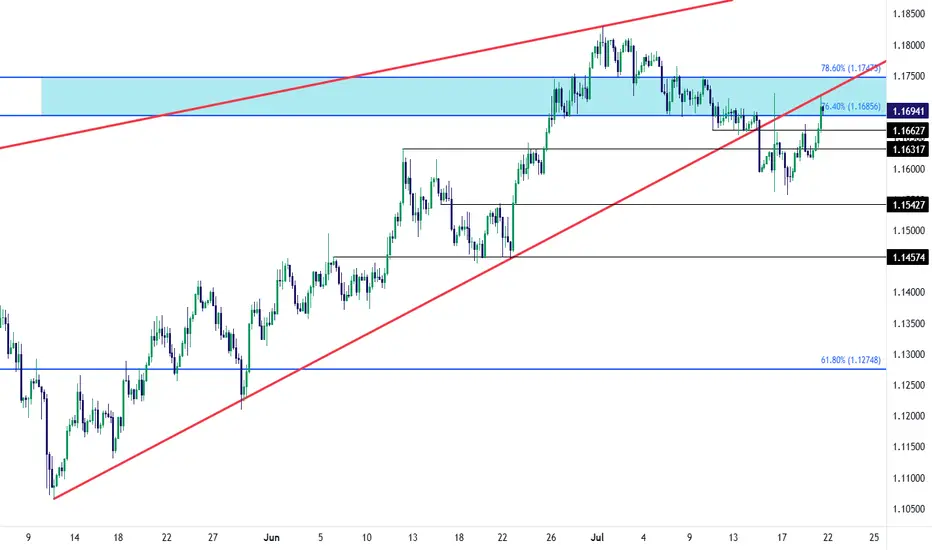
EUR/USD Recovery into Resistance TestEUR/USD bears had an open door to make a run last week and, so far, they've failed. The Wednesday turn around Trump's threat to fire Jerome Powell certainly made a mark, but the question now is whether the USD can respond to support at a longer-term trendline; and, in turn, EUR/USD is now testing in the zone between 76.4 and 78.6% Fibonacci retracements of the 2021-2022 major move.
There's also the underside of the falling wedge pattern that's now coming in as resistance as taken from prior support. The next resistance level overhead is the 1.1748 level, which is the 78.6% retracement that had offered both resistance and support with short-term price action in the pair. - js
EURUSD: Target Is Up! Long!
My dear friends,
Today we will analyse EURUSD together☺️
The recent price action suggests a shift in mid-term momentum. A break above the current local range around 1.16915 will confirm the new direction upwards with the target being the next key level of 1.17187 and a reconvened placement of a stop-loss beyond the range.
❤️Sending you lots of Love and Hugs❤️

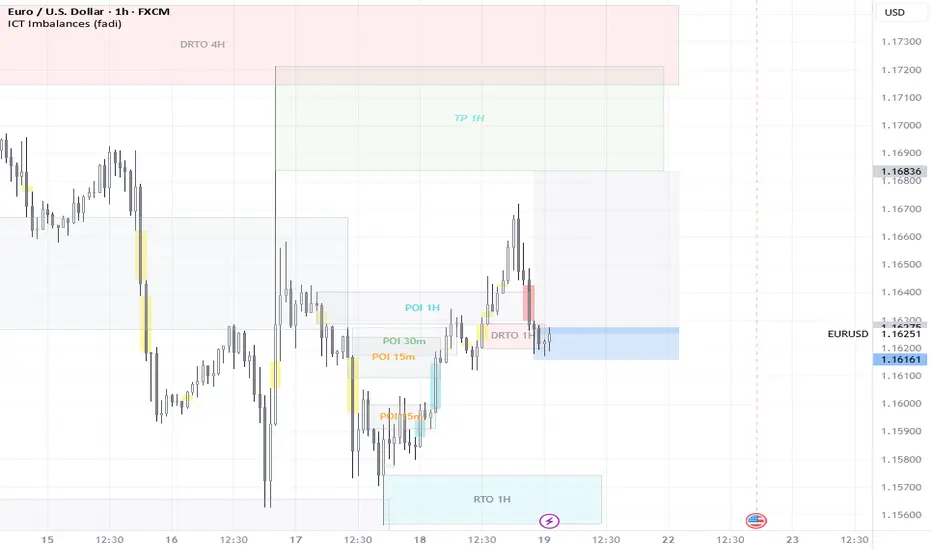
Analysis The market has gotten to the H1 FVG and idn it. Now we need to look for short opportunity. The lq has been taken.

Sell then Buy!Hello all. if market return right from here (IF IF IF IF), the response is the zone I have shown on the chart. I had no time to Optimize it. but enter with your confirmation method. I try to optimize it tonight (wink)

EURUSD TRADE IDEA EURUSD pulled back for a trade to the upside.
We got involved on the trade at our Fibonacci level and we seem to be powering to the upside.
Let's see how the market does it's thing.

EURUSD Bullish ProjectionIt’s been a while since my last update here.
Here’s my projection and actual entry/entries on EURUSD, based on a sweep of the previous 1H swing low and mitigation of a Daily imbalance (Fair Value Gap).
We're anticipating a full Change of Character to mark the end of the ongoing Daily pullback.

EUR/USD LIVE TRADE UPDATE📍Trade in Progress – Key S/R Retest
Price is currently pulling back into the same S/R zone we sold from.
If price breaks and closes above this zone, the setup could be invalidated.
However, this level has shown strong historical structure, and we may see a rejection here.
We’re watching closely for:
A sign of momentum turning
A potential engulfing candle confirming rejection
📌 A strong zone can hold—but we don’t guess. We observe and react with discipline.

EURUSD - BUY - Doesn't need any more confirmations..EURUSD - Bumping short term. Get your entries. Doesn't need any more confirmations..
EURUSD Approaches Key Technical Breakout Point📈 EURUSD at a Critical Decision Point Between Two Trends
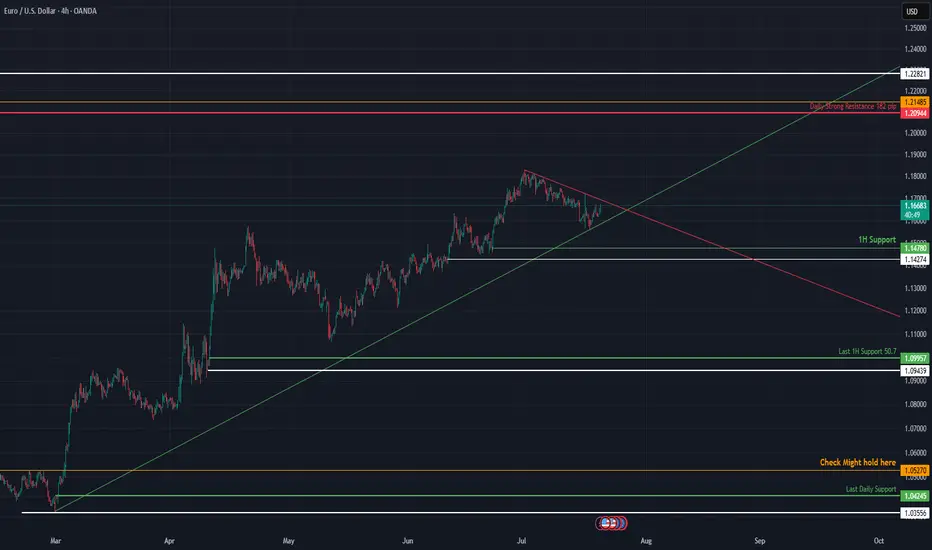
EURUSD is coiling between descending resistance and ascending support. A breakout from either direction will likely define the next leg of the move. This post breaks down the converging structure, high-probability levels, and what traders should watch to stay on the right side of the market.
🔍 Technical Analysis:
Price action is trapped between a downward sloping trendline (resistance) and a rising trendline (support), forming a symmetrical triangle. This compression indicates growing tension — and whichever trendline breaks first could dictate market direction in the coming weeks.
Currently, EURUSD is hovering near 1.1670, testing short-term structure while holding above prior swing supports.
🛡️ Support Zones (if downside breakout occurs):
🟢 1.1670 – 1H Support (High Risk)
First response zone on minor pullbacks.
Stop-loss: Below 1.1620
🟡 1.1470 – 1.1427 – Medium-Term Support (Medium Risk)
Confluence of diagonal and horizontal structure. Swing entry potential.
Stop-loss: Below 1.1380
🟠 1.0799 – Last 1H Support (Low Risk)
If the ascending trendline fails, this is the final zone to preserve a bullish structure.
Stop-loss: Below 1.0740
🔻 1.0242 – 1.0195 – Last Daily Support (Extreme Risk)
Loss of this zone marks a macro bearish shift.
🔼 Resistance Zones (if upside breakout occurs):
🔴 1.2094 – 1.2148: Daily Strong Resistance
Key breakout level. Strong historical supply. Clean close above here signals trend continuation.
Conclusion
EURUSD is at a technical fork — squeezed between opposing trendlines. The first decisive break will likely set the tone for Q3. Watch 1.2148 on the upside and 1.1427 on the downside for direction confirmation.
Not financial advice. Like & follow for more structured FX insights.
Uptrend Given the price behavior within the current support range, a trend change and the start of an uptrend is likely. Otherwise, a continuation of the downtrend is possible upon the support range being broken.

EURUSD Will Go Up! Long!
Please, check our technical outlook for EURUSD.
Time Frame: 2h
Current Trend: Bullish
Sentiment: Oversold (based on 7-period RSI)
Forecast: Bullish
The market is approaching a significant support area 1.166.
The underlined horizontal cluster clearly indicates a highly probable bullish movement with target 1.170 level.
P.S
Overbought describes a period of time where there has been a significant and consistent upward move in price over a period of time without much pullback.
Disclosure: I am part of Trade Nation's Influencer program and receive a monthly fee for using their TradingView charts in my analysis.
Like and subscribe and comment my ideas if you enjoy them!

EURUSDCOT data shows increasing net long positions on the euro, signaling bullish sentiment from institutional traders. This shift suggests growing confidence in the EUR against the USD.

EURUSD Considering the higher timeframe trend, I expect further downside in price.
It has reached a key price level on this same timeframe, and I anticipate a rejection from this area.
The highlighted blue zones represent the target levels for EUR/USD.

BUY EURUSD now for 4h time frame bullish trend continuation BUY EURUSD now for 4h time frame bullish trend continuation ...............
STOP LOSS: 1.1615
This buy trade setup is based on hidden bullish divergence trend continuation trading pattern ...
Always remember, the trend is your friend, so whenever you can get a signal that the trend will continue, then good for you to be part of it
TAKE PROFIT : take profit will be when the trend comes to an end, feel from to send me a direct DM if you have any question about take profit or anything...
Remember to risk only what you are comfortable with... trading with the trend, patient and good risk management is the key to success here

EURUSD: the ECB weekThe focus of the previous week was on US inflation figures. Posted data showed relatively stable figures for June, as inflation was standing at 0,3% for the month and 2,7% on a yearly basis. Both figures were in line with market expectations. Core inflation remained elevated and reached 0,2% for June and 2,9% y/y. At the same time, core inflation was by 0,1pp lower from market forecasts. The Producers Price Index in June was standing at 0%, same as core PPI. Compared to the year before, PPI was increased by 2,3%, while core PPI was higher by 2,6%. Retail sales in June were higher by 0,6%, and were better from market estimates of 0,1%. Building permits preliminary for June reached 1,397M and housing starts were standing at 1,321M in line with market expectations. The University of Michigan Consumer Sentiment preliminary for June was at the level of 61,8 in line with forecasts. Five year inflation expectations cooled a bit to 3,6%, from previous 4%. This year inflation expectations also eased to 4,4% from previous 5%.
The Industrial Production in the Euro Zone in May was higher by 1,7% for the month, bringing the indicator to the level of 3,7% on a yearly basis. Both figures were much higher from market forecasts of 0,9% for the month and 2,4% for the year. The ZEW Economic Sentiment Index in July for Germany reached the level of 52,7 a bit higher from forecasted. The final CPI in the Euro Zone in June was 2,3% y/y and core CPI at 2,3%, without change from the previous estimates.
For the second week in a row markets favored the US Dollar, which strengthened to the level of 1,1570 against euro. The currency pair ended the week at the level of 1,1626. The RSI continues to move around the level of 50 and is still not ready for a move toward the oversold market side. The MA50 continues to diverge from MA200, without an indication of a potential change in course in a near term period.
With a move toward the 1,1560, the eurusd tested the short term support line. At this level, the currency pair peaked in April this year. Charts are pointing to a potential for the short term reversal in the coming period. In this sense, levels modestly above the 1,17 resistance could be shortly tested. On the opposite side, 1,1560 might be tested for one more time at the start of the week, before the move toward upside. It should be considered that the ECB meeting will be held in a week ahead, where ECB members will draw the interest rate decision. A pause in rate cuts is overwhelmingly expected by market participants.
Important news to watch during the week ahead are:
EUR: GfK Consumer Confidence in august in Germany, HCOB manufacturing PMI flash for July for both Germany and Euro Zone, ECB meeting and interest rate decision will be held on Thursday, July 24th, Ifo Business Climate in July in Germany,
USD: Existing Home Sales in June, Durable Goods Orders in June.

3-Year Euro Uptrend — An Absurdity Amid a Weak EconomyCMCMARKETS:EURUSD
The euro is climbing, hitting its highest levels since late 2021 near $1.18. This surge is driven by diverging central bank policies—with the ECB holding rates steady while the Fed leans dovish—amid global tensions that push gold higher and rattle markets, weakening the dollar even though the eurozone economy remains fragile.
📉 1️⃣ Dollar Weakness Takes Center Stage
Since its January 2025 peak, the U.S. Dollar Index (DXY) has fallen by over 11% 📉—one of its worst starts in decades, comparable to the slumps of 1986 and 1989. As inflation cools, markets are betting on Fed rate cuts, pulling U.S. Treasury yields lower. Coupled with monetary policy divergence and tariff drama, the dollar’s usual safe-haven appeal is fading, even amid ongoing geopolitical tensions.
📊 2️⃣ Fed–ECB Policy Divergence
While the ECB has signaled the possibility of one or two cuts this year, markets are pricing in a milder path. By contrast, the Fed is tilting dovish, with swaps markets expecting a rate cut in September and another by December 🗓️. This widening yield differential supports EUR/USD, even though eurozone growth remains soft.
⚖️ 3️⃣ Trump Tariff Risks and Sentiment Shift
Uncertainty around U.S. trade policy—especially the threat of renewed tariffs—has weighed more heavily on USD sentiment than on eurozone currencies. Markets view these tariffs as inflationary and damaging to U.S. growth prospects. Speculative positioning data confirms record bearish sentiment on the dollar, with funds underweight USD for the first time in 20 years 💼.
💶 4️⃣ Eurozone’s Fiscal Shift
Germany has begun spending and borrowing, marking a dramatic pivot from years of fiscal restraint. This has raised hopes for an investment-driven recovery across the eurozone. Meanwhile, ECB President Christine Lagarde is avoiding signaling aggressive cuts, stabilizing market expectations and maintaining a sense of monetary calm—for now 🛡️.
🛡️ 5️⃣ Safe-Haven Flows Shifting
Traditionally, geopolitical stress boosts the USD as a safe haven. This cycle is different: investors are increasingly turning to gold, the Swiss franc, and the yen as defensive assets, indirectly supporting the euro. In April, when Trump delayed tariff plans, safe-haven USD flows unwound further, fueling euro gains 💰.
⚠️ Risks Ahead for EUR/USD:
💔 Weak Eurozone Fundamentals:
The eurozone economy is not booming. The IMF projects just 0.9% growth for 2025, with Germany, France, and Italy struggling to regain momentum. The ECB’s Financial Stability Review flags worsening credit conditions, weak private investment, and deteriorating balance sheets, none of which support sustained euro appreciation 📉.
🚢 A Strong Euro Hurts Exports:
Eurozone exporters in machinery, chemicals, and autos are already facing squeezed margins from rising input costs and global protectionism. A stronger euro makes exports less competitive, shrinking the eurozone’s current account surplus, which dropped sharply from €50.9 billion in March to €19.8 billion in April, according to the ECB 📊.
⚡ Political Risks Looming:
Fragile coalitions in Germany, budget battles in France, and rising anti-EU sentiment in Italy and the Netherlands could swiftly unwind euro gains if tensions escalate. Should the ECB turn dovish to support a weakening labor market, the euro’s rally could reverse quickly 🗳️.
📈 7️⃣ Technical Picture: Overextension Warning
In addition to the macro drivers, EUR/USD is now technically overextended. The pair has already retraced exactly 78.6% of its major bearish trend that started in January 2021 and ended in September of that year. Ahead lies a strong resistance zone at 1.18000–1.20000, which will be difficult to break without a significant catalyst.
Notably, the daily chart shows bearish RSI divergence, indicating fading momentum beneath the surface of this rally. A pullback toward the 1.13000 level would not be surprising, even as near-term momentum remains strong. This technical setup calls for caution while the pair tests these critical levels.
📈 Technical Outlook: EUR/USD Showing Signs of Overextension
Beyond macroeconomic factors, EUR/USD is currently technically overextended. The pair has retraced exactly 78.6% of its major bearish trend that began in January 2021 and concluded in September the same year. It is now approaching the upper boundary of a 3-year ascending channel, facing a significant resistance zone between 1.18000 and 1.20000—a hurdle unlikely to be crossed without a strong catalyst.
Additionally, the weekly chart reveals a bearish RSI divergence, signaling that underlying momentum is weakening despite the recent rally. Given this, a pullback toward the 1.13000 level is plausible, even as short-term momentum remains robust. This technical setup advises caution as the pair navigates these critical resistance levels.

EURUSD has broken channal.EURUSD has broken channal. Now consolidating waiting for Global cues to strenthen dollar before EURUSD start fallimg.

EURUSD InsightWelcome to all our subscribers.
Please feel free to share your personal opinions in the comments. Don’t forget to like and subscribe.
Key Points
- Christopher Waller, a member of the Federal Reserve Board, commented on interest rate cuts, saying, “Why wait until September? It's only six weeks away and not that significant.”
- With the August 1st negotiation deadline approaching, Trump reportedly wants to impose tariffs on most EU goods at a level higher than the minimum 10%. Negotiations with the EU are said to be facing difficulties due to the U.S.’s hardline stance. The EU is expected to take retaliatory measures if the talks fail.
- Japan’s NHK reported that the ruling coalition of the Liberal Democratic Party (LDP) and Komeito is certain to fail to secure the 50 seats needed for a majority. As a result, Prime Minister Ishiba is likely to face difficulties in implementing his policies following a victory by the opposition.
This Week’s Key Economic Events
+ July 22: Speech by Fed Chair Jerome Powell
+ July 24: ECB Interest Rate Decision
EURUSD Chart Analysis
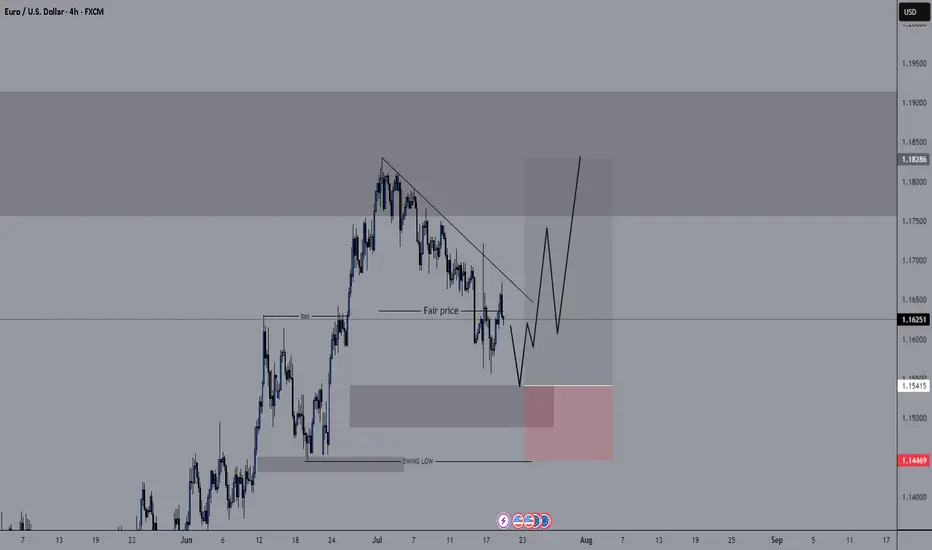
The downtrend continues, with the pair having dropped to the 1.16000 level. A further decline toward the 1.15000 area is possible if this level is breached, though a rebound from this zone is also a possibility. If a bounce occurs, attention should be paid to how the price behaves around the 1.18000 level. Conversely, if the pair drops to 1.15000 and then successfully rebounds, an upward move toward 1.19500 could be expected.

EURUSD M15 I Bearish Reversal Based on the M15 chart, the price could rise toward our sell entry level at 1.1641, a pullback resistance.
Our take profit is set at 1.1604, a pullback support that aligns closely with the 62.8% Fib retracement.
The stop loss is set at 1.1670, an overlap resistance.
High Risk Investment Warning
Trading Forex/CFDs on margin carries a high level of risk and may not be suitable for all investors. Leverage can work against you.
Stratos Markets Limited (tradu.com ):
CFDs are complex instruments and come with a high risk of losing money rapidly due to leverage. 66% of retail investor accounts lose money when trading CFDs with this provider. You should consider whether you understand how CFDs work and whether you can afford to take the high risk of losing your money.
Stratos Europe Ltd (tradu.com ):
CFDs are complex instruments and come with a high risk of losing money rapidly due to leverage. 66% of retail investor accounts lose money when trading CFDs with this provider. You should consider whether you understand how CFDs work and whether you can afford to take the high risk of losing your money.
Stratos Global LLC (tradu.com ):
Losses can exceed deposits.
Please be advised that the information presented on TradingView is provided to Tradu (‘Company’, ‘we’) by a third-party provider (‘TFA Global Pte Ltd’). Please be reminded that you are solely responsible for the trading decisions on your account. There is a very high degree of risk involved in trading. Any information and/or content is intended entirely for research, educational and informational purposes only and does not constitute investment or consultation advice or investment strategy. The information is not tailored to the investment needs of any specific person and therefore does not involve a consideration of any of the investment objectives, financial situation or needs of any viewer that may receive it. Kindly also note that past performance is not a reliable indicator of future results. Actual results may differ materially from those anticipated in forward-looking or past performance statements. We assume no liability as to the accuracy or completeness of any of the information and/or content provided herein and the Company cannot be held responsible for any omission, mistake nor for any loss or damage including without limitation to any loss of profit which may arise from reliance on any information supplied by TFA Global Pte Ltd.
The speaker(s) is neither an employee, agent nor representative of Tradu and is therefore acting independently. The opinions given are their own, constitute general market commentary, and do not constitute the opinion or advice of Tradu or any form of personal or investment advice. Tradu neither endorses nor guarantees offerings of third-party speakers, nor is Tradu responsible for the content, veracity or opinions of third-party speakers, presenters or participants.

EURUSD: Support & Resistance Analysis For Next Week 🇪🇺🇺🇸
Here is my latest structure analysis and important supports/resistances
for EURUSD for next week.
Consider these structures for pullback/breakout trading.
❤️Please, support my work with like, thank you!❤️
I am part of Trade Nation's Influencer program and receive a monthly fee for using their TradingView charts in my analysis.

eurusddrops, high posibilitys that it falls in yellow area, this idea is form from old paterns which indicates the same type of bears structure market, it should make a balance between the wars and the trump assumptions, its finishing the bull runs, be prepare for the sells. good luck.
