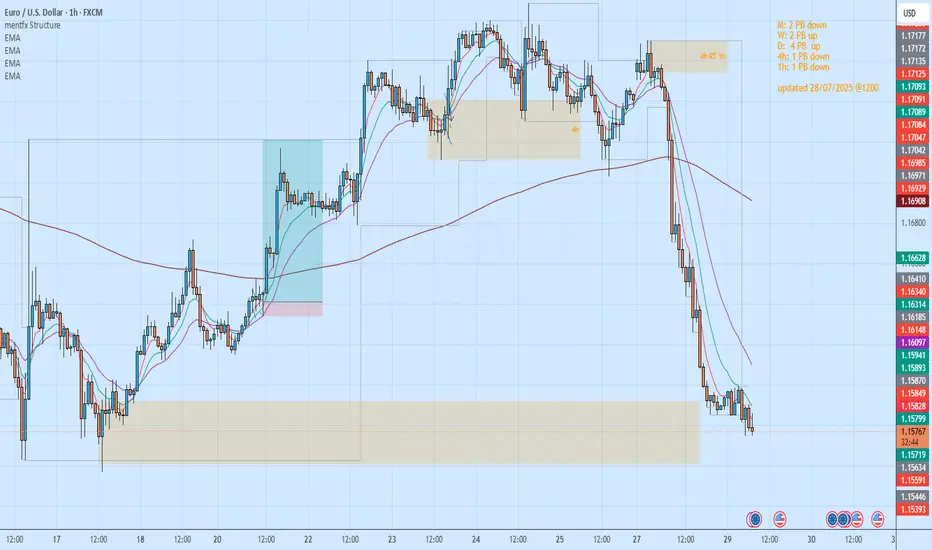
Getting short on EUR/USD!The dollar has looked set for a reversal and coming into the week it didn't hang around at all. I had a bit of a short bias on EUR/USD and was looking for confirmation signal which pretty much came at market open.
Price pushed higher back into the key level taking out a short term high, but was unable to follow through to form a new higher high. Heading into Monday London session, momentum immediately took hold with a clear bearish change of character and price didn't look back > breaking structure and key levels with minimal effort.
I was waiting for a pull back to get short early which didn't occur. But no need to chase price, waiting and patience is part of the game.
Price has now broken another key support level and is set to retest it as resistance. This will be my entry point (see screenshot) > using the 70.5%-78.6% fib retracement level and my stop above Tuesdays high. Keep it simple.
s3.tradingview.com
USDEUR trade ideas

Fundamental Market Analysis for July 30, 2025 EURUSDEvents to watch today:
30.07 15:30 EET. USD - Gross Domestic Product
30.07 21:30 EET. USD - FOMC Rate Decision
EURUSD:
Exclusive for our readers – a 202% bonus on deposits of $202 or more! Give the promo code PROFIT202 to customer support and start trading with TRIPLED capital.
EUR/USD remains under pressure amid stronger demand for the US Dollar ahead of the Federal Reserve decision (July 30, 2025). Market sentiment reflects the perception that the recent US–EU trade arrangements are relatively more favorable for the US economy, reinforcing expectations for stronger corporate earnings and a more supportive external balance in the coming months. Capital flows are skewed toward dollar-denominated assets, also because investors prefer to wait out key central‑bank communications in “quality” instruments.
A further driver is the divergence in macro momentum: the US economy shows greater resilience in consumption and labor markets, while the euro area faces constrained growth and a cautious ECB tone. With little reason for ECB tightening and with lingering risks for European industry and exports after tariff headlines, the euro’s fundamental support looks softer. Persisting uncertainty around the inflation path in the euro area adds to the preference for the USD.
Given these factors, the near‑term fundamental tilt remains to the downside for EURUSD. Risks to this view include unexpectedly dovish Fed communication, a pullback in US Treasury yields, and/or positive euro‑area data surprises that could improve growth expectations and support the euro.
Trading recommendation: SELL 1.15650, SL 1.16000, TP 1.15150

#AN022: Geopolitical Tensions and Forex Pressure
Hello, I'm Forex Trader Andrea Russo, and today I want to talk to you about this week's latest geopolitical tensions.
1. The Russian ruble in crisis, weakening against the USD and CNY
The ruble fell 1.5% against the dollar and 0.8% against the yuan, following a US ultimatum to Moscow for an immediate truce in Ukraine.
FX Impact: The ruble remains vulnerable, fueling demand for safe-haven currencies such as the USD, EUR, and CHF. Crosses against the RUB show potential technical short reversals.
2. Oil Rises: First Impacts on Energy Costs
Brent prices rose 3.5% to $72.50 a barrel following the announcement of possible US sanctions on buyers of Russian oil.
FX Impact: Oil-related currencies such as the CAD and NOK benefit; USD risks weakness if importing countries experience inflationary pressures.
3. Euro falls monthly for the first time, dollar strengthens
The euro is in the red on a monthly basis for the first time in 2025, while the dollar benefits from cautious Fed rate expectations and the EU-US trade deal perceived as biased toward Washington.
Forex Impact: EUR/USD is under structural pressure. Euro-commodity correlates (EUR/CAD, EUR/AUD) are showing signs of weakness.
4. IMF warns of US tariffs and rising global inflation
In its latest report, the IMF emphasized that US tariffs are slowing global growth and fueling persistent inflationary pressures.
FX Impact: Increased uncertainty favors the USD and CHF. Emerging economies and commodity-linked economies (MXN, ZAR, BRL) could weaken further.
5. India Strengthens: Growing Exports and Solid Reserves
India recorded a 7.2% increase in merchandise exports and maintains stable foreign exchange reserves, demonstrating macroeconomic resilience and the resilience of the rupee.
Forex Impact: The INR could strengthen or consolidate at robust levels, while USD/INR pairs signal potential support.
6. Global Digital Projects and Fragmentation of Payment Systems
The adoption of alternative systems to SWIFT such as mBridge or Project Agorá reflects a push toward global financial independence.
Forex Impact: The euro and dollar remain dominant, but the RMB is gaining ground in Asia-Pacific countries. RMB crosses (USD/CNH, EUR/CNH) require attention, especially from a long-term perspective.

EUR/USD: ECB Pauses Amid UncertaintyBy Ion Jauregui – Analyst at ActivTrades
The European Central Bank has decided to pause its rate-cutting cycle after seven consecutive reductions over the past twelve months, leaving the deposit rate at 2%, the refinancing rate at 2.15%, and the marginal lending facility at 2.4%. This move, largely priced in by the markets, reflects the ECB’s growing caution in the face of inflation that has officially reached its 2% target but may rebound if certain fiscal and geopolitical risks materialize.
Christine Lagarde’s message has been interpreted with a hawkish tone. Although both headline and core inflation have eased — the latter standing at 2.3% — the ECB warns that surprises may still occur. Massive defense spending, fiscal imbalances, and international trade tensions (such as tariffs recently signed by Trump with Japan) could disrupt the current equilibrium.
Markets have reacted calmly: the EUR/USD barely moved a tenth of a percent after the decision, while implied interest rates in the money markets have lowered the odds of another rate cut in September. Now, only a symbolic 5 basis point cut is priced in at most.
Technical Analysis
Overall trend: Sideways to bearish in the short term; bullish in the long term.
Key support levels:
1.1488: technical and psychological reference level
1.1275: recent July low
Key resistance levels:
1.8291: short-term high
1.2278: next resistance level
The pair attempted to break higher last week but failed, starting this week with a bearish tone. As long as the price holds above key support, the bullish trend may continue. A daily close below the first support could trigger a move toward the point of control (POC) zone at 1.0419. The daily RSI is in oversold territory at 38.95%, while the MACD shows signs of turning lower, indicating a loss of bullish momentum.
There is growing speculation that the ECB's rate-cutting cycle may be over. Within the ECB, figures like Isabel Schnabel are calling for patience, while others, such as Philip Lane and Luis de Guindos, still don’t rule out a final adjustment if September projections show economic weakness.
In this context, the price range that began from the point of control zone toward recent highs appears to be losing steam. Going forward, the evolution of the EUR/USD will depend on inflation trends, European fiscal policy, and the ECB’s response to tariff tensions with the United States and other global challenges as summer draws to a close.
*******************************************************************************************
The information provided does not constitute investment research. The material has not been prepared in accordance with the legal requirements designed to promote the independence of investment research and such should be considered a marketing communication.
All information has been prepared by ActivTrades ("AT"). The information does not contain a record of AT's prices, or an offer of or solicitation for a transaction in any financial instrument. No representation or warranty is given as to the accuracy or completeness of this information.
Any material provided does not have regard to the specific investment objective and financial situation of any person who may receive it. Past performance and forecasting are not a synonym of a reliable indicator of future performance. AT provides an execution-only service. Consequently, any person acting on the information provided does so at their own risk. Political risk is unpredictable. Central bank actions can vary. Platform tools do not guarantee success.

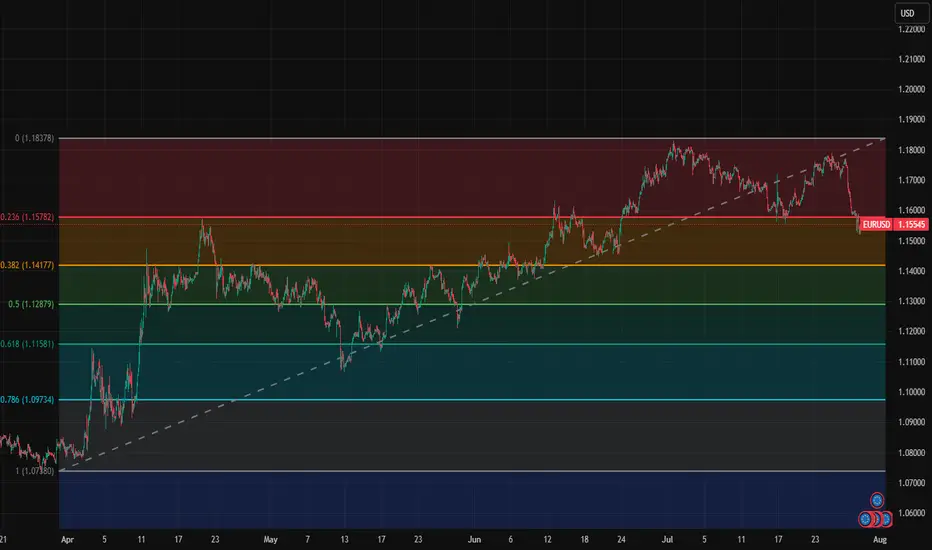
EurUsd short term key levelsThese are short term key levels for intra day and swing trading on 1h chart.
1.0718
1.0973
1.1158
1.1288
1.1418
1.1578
1.1838
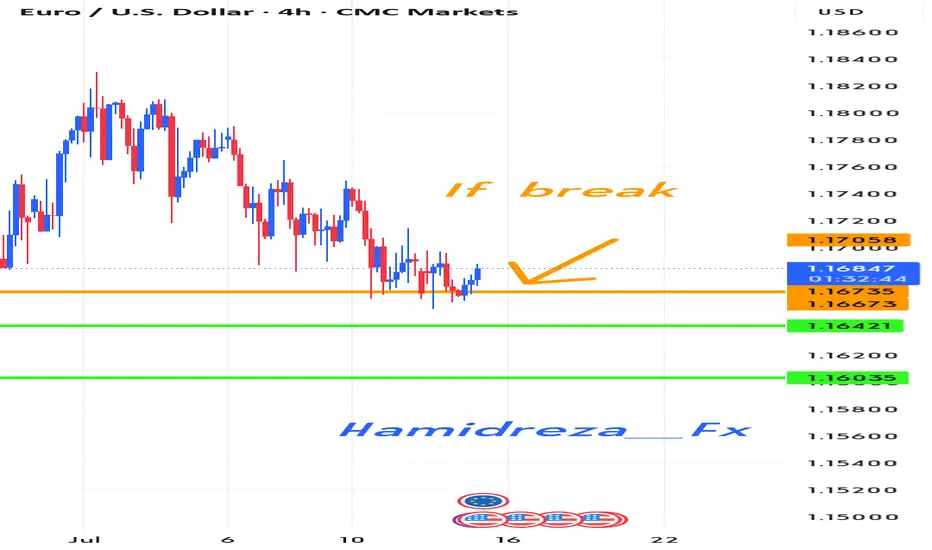
Could something similar happen to the EURUSD?
Hi everyone
We are in a state of downward suffering
This state of suffering seems to continue
Of course, there is a condition that if the condition is met, we will probably see the first and second goals.
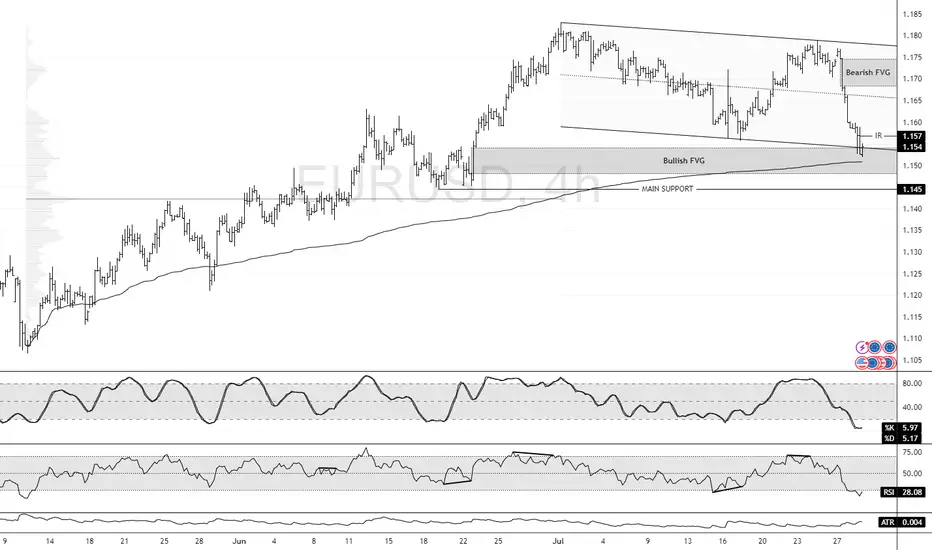
EUR/USD at Discount Level: Bullish Setup in FocusFenzoFx—EUR/USD bearish momentum extended to $1.154, the lower line of the flag. This is a support area backed by the Bullish FVG.
The immediate resistance is at $1.157. From a technical perspective, a close above this level can trigger an uptrend, targeting the bearish FVG at approximately $1.170 to $1.175.
Please note that the bullish outlook should be invalidated if EUR/USD falls below the main support level at $1.145.
Where to next for EURUSD? With Monday's opening, we saw price sell off at a great force and attacked the previous week's low, taking it out, with short term liquidity taken, will price reverse and start moving up or is there no end in sight for this bearishness?


Should You Still Sell Your USD for EUR? A 2025 PerspectiveWith currency markets in constant flux, the decision to hold USD or convert to EUR carries major financial implications for investors, expatriates, businesses, and frequent travelers. As of July 29, 2025, the USD/EUR exchange rate is around 0.86–0.87, with $1 buying roughly €0.86. Is now the right time to sell your US dollars for euros? Here’s a balanced look at the latest data and forecasts.
Current Market Context: Dollar Weakness and Euro Stabilization
USD Slide in 2025: The US dollar has experienced its steepest decline in over three years, falling nearly 10% year-to-date. This sustained weakness is attributed to policy volatility, capital flowing out of the US, and narrowing interest rate differentials.
Key Exchange Rate: Recent rates hover between 0.85 and 0.87, representing moderate stability following a period of volatility.
Euro’s Resilience: While the euro has had its own struggles, from slower economic growth to political uncertainty in Germany and France, analysts forecast no major sustained fall for the euro through 2025.
2025 Forecasts: USD/EUR Direction—What Do the Experts Say?
Year-End 2025 Outlook: Major banks and forecasting firms expect the EUR/USD rate could climb even higher by year-end, meaning the euro could gain modestly versus the dollar if current trends continue.
Factors to Watch:
Fed Rate Cuts: Potential US rate cuts in Q3–Q4 remain a key driver for further USD weakness.
Trade & Tariff Uncertainty: Ongoing US tariff announcements and global trade tensions add volatility but also support safe haven flows to the dollar.
Eurozone Politics: Any resolution of political uncertainty in Europe could buoy the euro.
Most Important One: Fed's Money Printer...
Strategic Considerations: Should You Sell Now?
Locking in Current Rates: If you need euros to make payments, pay salaries, or make investments in the short term, converting a portion now could reduce your exposure to further USD downside.
If You Can Wait: Analysts see some chance for USD recovery in late Q3 or early 2026, but this is contingent on US policy stability and Fed decisions.
Averaging In: For larger transfers, consider splitting your transaction over time (also called dollar-cost averaging), which can help mitigate volatility.
Bottom Line
If you have an immediate need for euros, current rates present a reasonable opportunity. The dollar’s weakness throughout 2025 is well documented, but much of the pessimism may already be priced in. If you’re flexible with timing, monitor central bank policy signals throughout Q3/Q4, a more dovish Fed or unexpected eurozone stability could push rates further in your favor, but event risks remain elevated. Ultimately, a phased or hedged approach may offer both protection and potential upside
*not investment advice*
#forex #fx #dollar #usd #euro #eur #economy #trade #tariff #trading #indicator

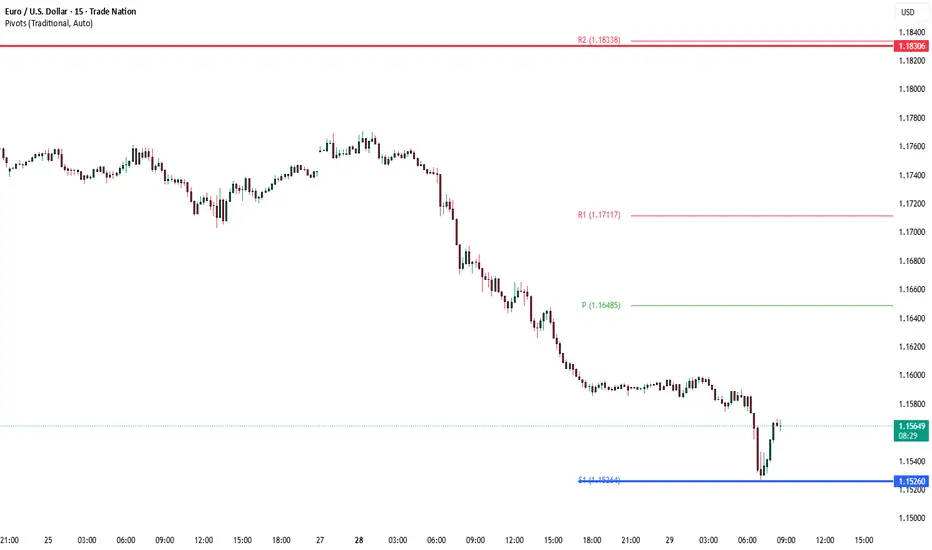
Downtrend If the price can break through the support trend line, a continuation of the downtrend to the support levels is likely. Otherwise, an uptrend is possible with consolidation above the support level.

EUR/USD 30-MIN ANALYSISThis EURUSD setup showcases a clean bullish continuation scenario following a confirmed Break of Structure (BOS) and a sharp rally driven by momentum and liquidity imbalance.
After sweeping a key low (XXX), price impulsively broke structure to the upside, confirming a potential shift in market intent. A retracement is now expected to mitigate the Buy-Side Imbalance (BISI) zone.
BOS & SSS (Short-Term Structural Shift): Confirmed bullish intent.
Imbalance (BISI): Price left behind an unfilled imbalance zone a likely magnet for a pullback.
Re-Entry Zone: (BISI) provides a high probability area for long re-entry.
Upside Targets:
Target 1: 1.15483 – intermediate structural level.
Target 2: 1.16158 – premium supply / liquidity target.
#EURUSD 30M Technical Analysis Expected Move.

The Day AheadKey Data Releases
US:
JOLTS (June): Provides insight into labor market slack; a tighter reading could delay Fed rate cuts.
Advance Goods Trade Balance & Wholesale Inventories: Important for Q2 GDP revisions.
Consumer Confidence (July): A strong print would reflect continued consumer resilience, a weak one could pressure cyclicals.
Dallas Fed Services Activity (July): Regional business sentiment.
FHFA House Price Index (May): Monitors housing market health.
UK:
Consumer Credit & M4 (June): Key for BoE rate path.
France: Q2 total jobseekers – labor market stress indicator.
Sweden: June GDP indicator – recession risk watch.
Central Bank Focus
ECB Consumer Expectations (June): Watch for shifts in inflation expectations that could impact eurozone policy outlook.
Corporate Earnings
A major earnings deluge with over 25 high-profile companies, highlighting:
Tech/Payments: Visa, PayPal, Spotify, Electronic Arts
Consumer/Healthcare: Procter & Gamble, UnitedHealth, Starbucks, Mondelez, AstraZeneca, Merck & Co
Industrials/Travel: Boeing, UPS, Royal Caribbean, Stellantis
Luxury/Retail: Kering, L’Oreal
Financials: Barclays, Corning, Keyence
Sentiment hinges on guidance outlooks and margin commentary, particularly as investors watch for signs of consumer fatigue or pricing power erosion.
Auctions
US 2-year FRN & 7-year Notes: Will test demand amid shifting Fed expectations; weak uptake could push yields higher.
Conclusion for Today's Trading
Today is data- and earnings-heavy, setting up for potentially elevated volatility. The US JOLTS and consumer confidence data will be pivotal for shaping Fed expectations. Meanwhile, a massive cross-sector earnings lineup could lead to stock-specific dispersion, especially in tech, healthcare, and consumer sectors. Treasury auctions may steer yield curves and weigh on equity sentiment if demand is weak.
Trading Bias: Expect range-bound to choppy action in broader indices, with stock rotation driven by earnings surprises. Stay alert to macro data prints, particularly if they shift views on a September Fed move.
This communication is for informational purposes only and should not be viewed as any form of recommendation as to a particular course of action or as investment advice. It is not intended as an offer or solicitation for the purchase or sale of any financial instrument or as an official confirmation of any transaction. Opinions, estimates and assumptions expressed herein are made as of the date of this communication and are subject to change without notice. This communication has been prepared based upon information, including market prices, data and other information, believed to be reliable; however, Trade Nation does not warrant its completeness or accuracy. All market prices and market data contained in or attached to this communication are indicative and subject to change without notice.
EURUSD Buy OfferThere is a Demand area in Daily time frame which I've specified on the chart.
Can enter right now ...
Has the Bleeding STOPPED?Yesterday witnessed a great deal of unidirectional push on major USD crosses. The EURUSD was not an exception. With the DXY strengthening for the most yesterday, the ripple effect on all USD crosses was bound to happen.
We were looking at the market for the most yesterday, trying to find a potential reversal point. While it seemed unclear, we were still able to narrow our probability into a rather slim perspective and spectrum.
Looking at the market right now, i will say that our reverssal should begin to show up any time soon.
I can already see reversals on some other USD crosses.
Price on the EURUSD is currently at a critical zone. Even though not an anticipated zone, price can see some reversal in that zone.
We still wait to see clear sign and confirmation of the reversal on the EURUSD, but for now, we still keep fingers crossed
EURUSD BuyPrice did a ‘LG’ off the ‘POI’(looking left). Daily cycle not fully complete. Price should take out asia high.

EURUSD 3:1 Intraday SnipeThe H4 Doji on resistance
The downtrend on H4 H1 and M15
We are just shorting to next support
With a stop above m15 / h1 resistance nearest one - pretty solid also
3:1 Risk Reward
75%-80% odds (my rank)

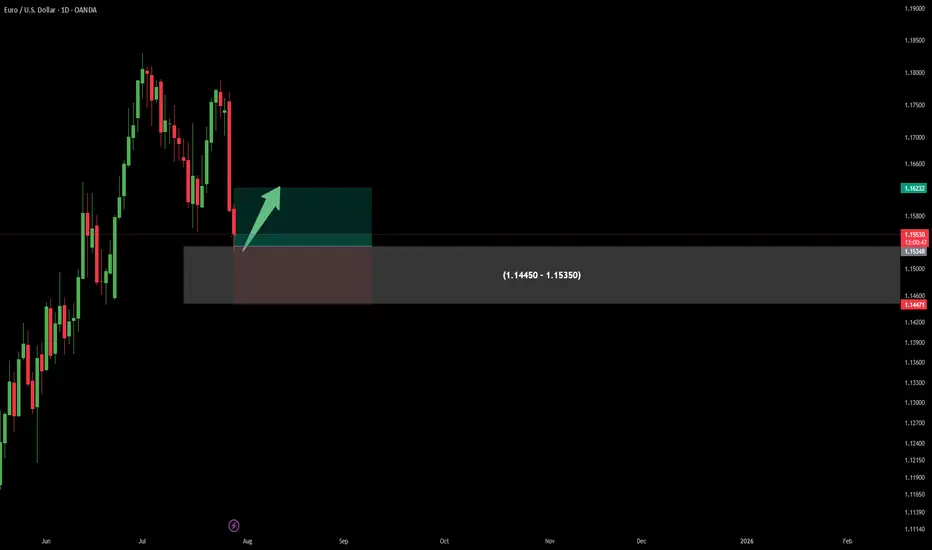
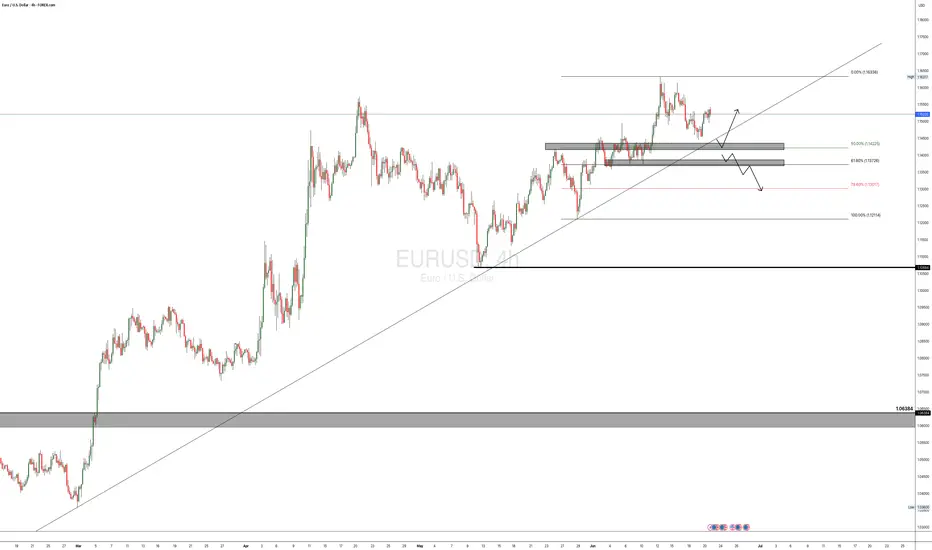
EURUSD POSSIBLE TRADE SETUP💶 Potential Trade Setup on EURUSD
Overview:
Since March, EURUSD has shown consistent bullish momentum, especially after breaking through the key 1.0600 supply zone.
The pair has maintained higher highs and higher lows, suggesting continued strength in the medium term.
That said, I am still quite anticipating for a possible continuation of the bullish momentum that started a long time ago, and moving forward, I will anticipate for a clear retest of the 50% fib at the 1.1425 region, then I go in for the kill.
Alternatively, there is a clear short opportunity, provided that, the bullish trendline is broken and the 1.1370 region is broken to the downside, this is a bit far a stretch, but it is in play. "IF" the DXY keeps the bullish momentum going.
🧭 Trading Plan:
✅ BUY Bias (Primary Plan):
Look for a retest of the 50% Fibonacci retracement zone around 1.1425. This aligns with the ongoing momentum on the 4H timeframe.
🔻 SELL Bias (Alternative Scenario):
If price breaks the bullish trendline and the 1.1370 support zone, a short opportunity opens up.
This is only valid if DXY continues to strengthen, shifting sentiment.
🎯 Targets & Risk Management: Targeting 1:2 R:R on both setups.
Ensure entries are backed by price action signals and confluences.
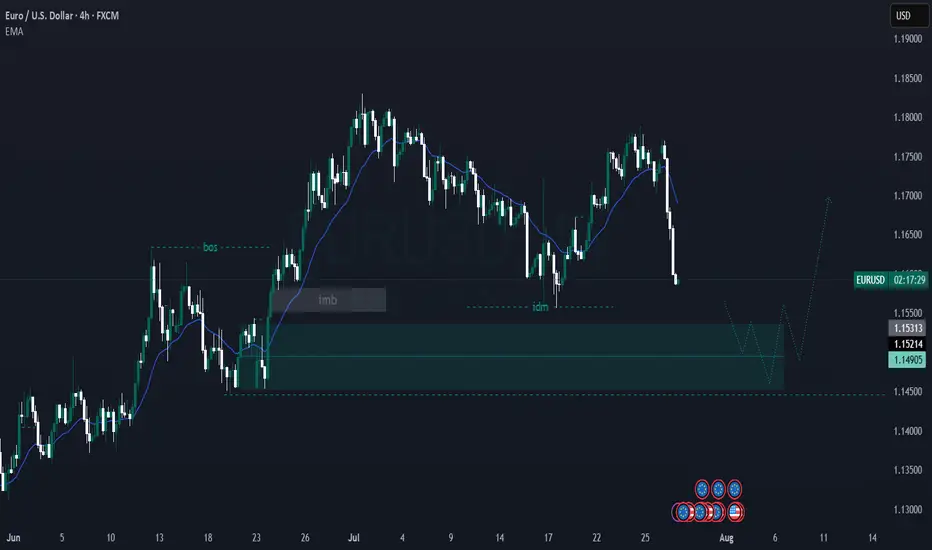
EUR/USD – 4H Technical Analysis AnticipatingPrice is currently in a bullish structure, printing consecutive Breaks of Structure (BOS) to the upside, confirming strong bullish momentum FX:EURUSD FX:EURUSD
On the 4H timeframe, price has:
Left behind an imbalance, signaling inefficiency in price delivery
Formed an unmitigated demand zone (internal OB) that aligns with bullish order flow
We now wait for price to return to this zone for a potential mitigation
📍 Plan of Action:
Monitor the mitigation area
Drop down to the 15-minute timeframe
Look for LTF (lower timeframe) confirmation: CHoCH, BOS, and internal structure shift before entering
Eurusd retraces1st target is low channel 1 line (1,1543).
Red line is magnet... (1,1684-92)
Oscilation between theese two lines....
Expect slow corrective pattern (>1.1610,1,16411,1692)

Countdown to Powell’s rate decision: What to watch WednesdayFederal Reserve Chair Jerome Powell is under mounting pressure from President Donald Trump to begin cutting interest rates.
Markets and analysts overwhelmingly expect the Fed to hold rates steady this Wednesday.
But what if the political heat is becoming too much to bear, and Powell and the Fed board advocate for a cut this week? Some Fed governors, Chris Waller and Michelle Bowman , have already signaled support for an early cut.
FX pairs to watch
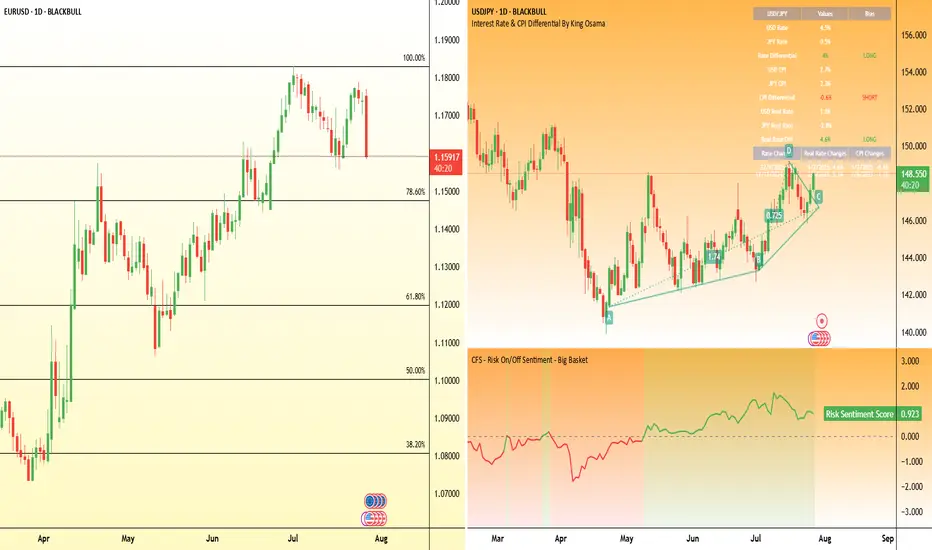
USD/JPY:
This pair remains highly sensitive to yield differentials and broader risk sentiment. However, any hawkish resistance or emphasis on data dependency may keep the pair supported, especially if risk appetite holds.
EUR/USD:
The euro has shown relative strength in recent sessions, but the pair has been hit by the announcement of the trade deal struck between the EU and US. If the Fed clearly signals it's not ready to ease, the USD could regain even ground.
EUR-USD Support Ahead! Buy!
Hello,Traders!
EUR-USD is making a massive
Bearish correction and the pair
Is already locally oversold
So after it hits a horizontal
Support level below at 1.1568
We will be expecting a local
Bullish rebound
Buy!
Comment and subscribe to help us grow!
Check out other forecasts below too!
Disclosure: I am part of Trade Nation's Influencer program and receive a monthly fee for using their TradingView charts in my analysis.

