Top 3 Steps to Trading EUR/USD Long-Term✅ Top 3 Steps to Trading EUR/USD Long-Term – Rocket Booster Buy Setup 🚀
Pair: EUR/USD
Timeframe: Daily
Trade Type: Long-Term Swing / Investment
Direction: BUY
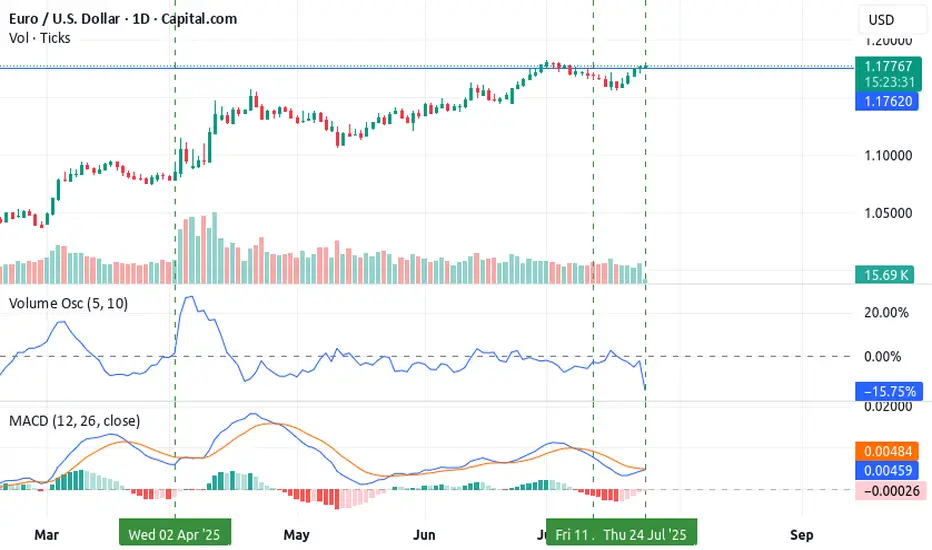
Looking for a high-confidence swing trade? EUR/USD has triggered all 3 key steps for a long-term bullish entry using the proven Rocket Booster Strategy.
Here’s the breakdown:
🔑 Step 1: Volume Oscillator – Buy Rating
Volume is trending above the zero line, showing signs of accumulation and increasing demand. This suggests smart money may be entering quietly.
🔑 Step 2: MACD – Bullish Momentum
A bullish MACD crossover above the zero line on the daily timeframe confirms that momentum has shifted in favor of the bulls. Histogram bars are expanding—classic trend continuation behavior.
🔑 Step 3: Rocket Booster Strategy – Fully Aligned
All three pillars of the strategy are locked in:
✅ Price is above the 50 EMA
✅ Price is above the 200 EMA
✅ Volume spike confirms momentum ignition
This setup shows strong potential for trend continuation on the higher timeframe.
🧠 Trade Perspective:
This is a long-term investment-grade signal, not a short-term scalp. Patience and disciplined trade management are key.
🛑 Disclaimer:
This post is for educational and informational purposes only. It does not constitute financial advice. Always do your own research and manage risk appropriately. Use a simulation trading account before you trade with real money
USDEUR trade ideas
all in all 1.180-1.183 i think is before us.In my opinion we will be checking 3year up trend canal in few days . its only my opinion. If 1.18-1.19 broken then i think 1.2-1.25 will be open to reach. if not, then in that canal we can reach even 1.12 in the months

EUR/USD – Buy Setup Analysis (1H Chart)EUR/USD – Buy Setup Analysis (1H Chart)
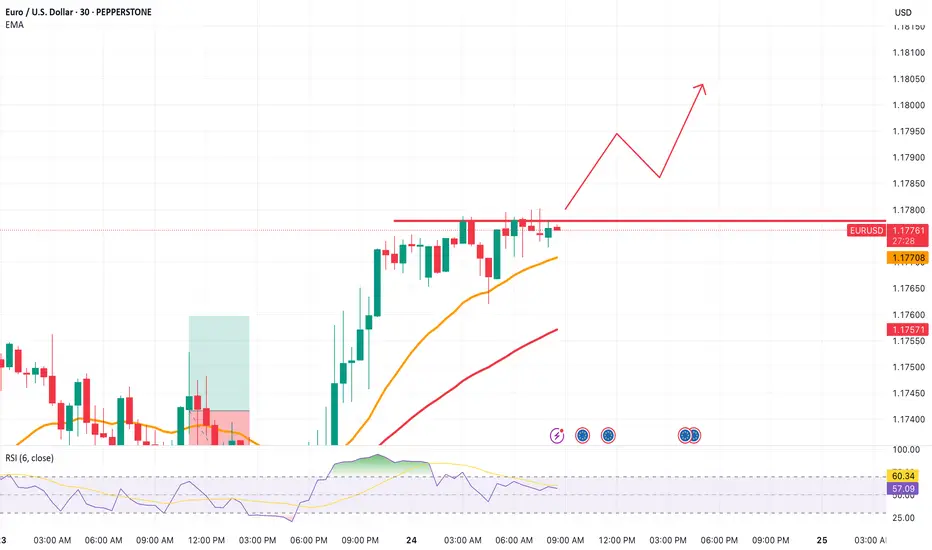
📈 **Trend**: Uptrend
The pair is respecting the ascending trendline and is trading above both the EMA 7 and EMA 21, indicating bullish momentum.
**🔹 Long Setup**
* **Entry:** Around 1.1774 (current price)
* **Stop-Loss (SL):** 1.1731 (below trendline & EMAs)
* **Take-Profit (TP):** 1.1872 (based on recent swing high)
**🔎 Technical Signals**
* Price is forming higher highs and higher lows.
* Strong volume surge on bullish candles.
* EMA crossover (7 > 21) supports continuation.
**Conclusion**
As long as EUR/USD holds above the trendline and the EMAs, the bullish setup remains valid. A break below 1.1730 would invalidate this outlook.

EURUSD expected to continue the uptrend once it breaks the HHIf EURUSD pushes upwards and breaks that resistance line, we can look to enter into a LONG position.
EURUSD H4 I Bearish Reversal Based on the H4 chart analysis, we can see that the price is rising toward our sell entry at 1.1787, which is a pullback resistance aligning close to the 161.8% Fibo extension.
Our take profit will be at 1.1750, a pullback support level.
The stop loss will be placed at 1.1829, a swing-high resistance level.
High Risk Investment Warning
Trading Forex/CFDs on margin carries a high level of risk and may not be suitable for all investors. Leverage can work against you.
Stratos Markets Limited (tradu.com ):
CFDs are complex instruments and come with a high risk of losing money rapidly due to leverage. 63% of retail investor accounts lose money when trading CFDs with this provider. You should consider whether you understand how CFDs work and whether you can afford to take the high risk of losing your money.
Stratos Europe Ltd (tradu.com ):
CFDs are complex instruments and come with a high risk of losing money rapidly due to leverage. 63% of retail investor accounts lose money when trading CFDs with this provider. You should consider whether you understand how CFDs work and whether you can afford to take the high risk of losing your money.
Stratos Global LLC (tradu.com ):
Losses can exceed deposits.
Please be advised that the information presented on TradingView is provided to Tradu (‘Company’, ‘we’) by a third-party provider (‘TFA Global Pte Ltd’). Please be reminded that you are solely responsible for the trading decisions on your account. There is a very high degree of risk involved in trading. Any information and/or content is intended entirely for research, educational and informational purposes only and does not constitute investment or consultation advice or investment strategy. The information is not tailored to the investment needs of any specific person and therefore does not involve a consideration of any of the investment objectives, financial situation or needs of any viewer that may receive it. Kindly also note that past performance is not a reliable indicator of future results. Actual results may differ materially from those anticipated in forward-looking or past performance statements. We assume no liability as to the accuracy or completeness of any of the information and/or content provided herein and the Company cannot be held responsible for any omission, mistake nor for any loss or damage including without limitation to any loss of profit which may arise from reliance on any information supplied by TFA Global Pte Ltd.
The speaker(s) is neither an employee, agent nor representative of Tradu and is therefore acting independently. The opinions given are their own, constitute general market commentary, and do not constitute the opinion or advice of Tradu or any form of personal or investment advice. Tradu neither endorses nor guarantees offerings of third-party speakers, nor is Tradu responsible for the content, veracity or opinions of third-party speakers, presenters or participants.

EURUSD Analysis - Can Buyers Push Price To $1.18000?Hello all dear traders!
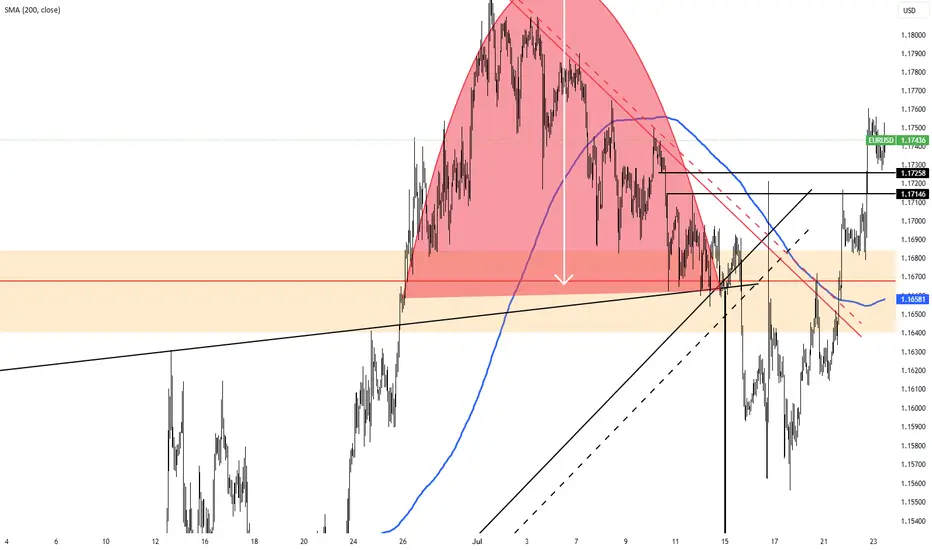
EURUSD is trading within a clear bullish channel, with price action consistently respecting both the upper and lower boundaries. The recent bullish momentum shows that buyers are in control, suggesting further upside.
The price recently broke above a key resistance zone and is now coming back to retest it. If this level holds as support, it will consolidate the bullish structure and increase the likelihood of a move towards the 1.18000 target, which is in line with the upper boundary of the channel.
As long as the price remains above this support zone, the bullish outlook remains intact. However, a failure to hold this level could invalidate the bullish scenario and increase the likelihood of a deeper pullback.
Remember, always validate your setups and use appropriate risk management.

EURUSD : Status @ 23/7Direction: Buy
Signal triggered: 23/7/2025
Stop when:
a) Stop Loss @ 1.1700 ; or if
b) Sell signal triggered
Action:
Buy the dip
Good luck.
P/S: Note that the Buyer finally won the battle. But it did so, fighting the Seller all the way to the top. Now, they are at 1.1790 resistance with a potential to reach the long-term D @ 1.1900/30. My preference is not to buy. Instead, wait for a SELL as it is a bit late now to buy.

EURUSD(20250724) Today's AnalysisMarket news:
U.S. President Trump continued to lash out at the Federal Reserve on Tuesday, but seemed to back off from the remaining plan to fire Chairman Powell. "I think he's doing a bad job, but he's going to be out of office soon anyway," Trump said in an exchange with reporters at the White House. "In eight months, he'll be out of office."
Technical analysis:
Today's buying and selling boundaries:
1.1751
Support and resistance levels:
1.1814
1.1791
1.1775
1.1726
1.1711
1.1687
Trading strategy:
If the price breaks through 1.1775, consider buying in, with the first target price at 1.1791
If the price breaks through 1.1751, consider selling in, with the first target price at 1.1726

EURUSD Solid LongH4 H1 M15 trends up
Target solid next resistance
Stop solid nearest support - behind it
1:1 RR
80% odds+


EURUSD: Strong Growth Ahead! Long!
My dear friends,
Today we will analyse EURUSD together☺️
The market is at an inflection zone and price has now reached an area around 1.17463 where previous reversals or breakouts have occurred.And a price reaction that we are seeing on multiple timeframes here could signal the next move up so we can enter on confirmation, and target the next key level of 1.17589.Stop-loss is recommended beyond the inflection zone.
❤️Sending you lots of Love and Hugs❤️

EURUSD: Strong Growth Ahead! Long!
My dear friends,
Today we will analyse GOLD together☺️
The market is at an inflection zone and price has now reached an area around 1.17463 where previous reversals or breakouts have occurred.And a price reaction that we are seeing on multiple timeframes here could signal the next move up so we can enter on confirmation, and target the next key level of 1.17589.Stop-loss is recommended beyond the inflection zone.
❤️Sending you lots of Love and Hugs❤️

EURUSD LONG AND EDUCATIONAL EXPLANATION ON SNIPER TRADESEUR/USD climbs to two-week tops around 1.1760
EUR/USD now gathers extra steam and advances to new two-week peaks around 1.1760 on Tuesday. The increasing selling pressure continues to hurt the US Dollar amid steady trade concerns and rising effervescence surrounding the Trump-Powell spat.

The dollar is still weak against the euroThe EURUSD has risen directly with the market opening without visiting the OB, which was a good area to buy,
but that's okay, we now know where its next target will be, which is to sweep the liquidity that is above the Trend line and then break the Main High.
An expected scenario may occur when this high is broken, which is SMT (divergence), and there will be a good selling entry with GBPUSD, but until now, we have not anticipated events until this break occurs.

EUR USD LONG RESULT Price had broken down the falling channel and held the the 4HTF Trendline Support and rejected twice already, so expect a third rejection from the indicated zone from which I entered the trade and It moved just as expected and TP Done ✅
_THE_KLASSIC_TRADER_.🙏🔥

EURUSD TECHNICAL ANALYSIS📊 EUR/USD Technical Analysis – July 23, 2025
The pair is currently respecting an ascending trendline on the 1H timeframe, showing bullish momentum after breaking previous highs. Price is consolidating just below a key resistance zone, suggesting a potential breakout or rejection scenario in the coming sessions.
🔍 Key Levels:
🔴 Resistance 1: 1.17607
🔴 Resistance 2: 1.18415
🟢 Support 1: 1.16793
🟢 Support 2: 1.15983
✅ Bullish Scenario:
If price holds above the ascending trendline and breaks above the 1.17607 resistance zone with strong volume, we could see a continuation towards the next resistance at 1.18415. A bullish breakout with a retest offers a buy opportunity, targeting the higher resistance level with a stop below the trendline.
Buy Entry Idea:
Entry: After breakout and retest of 1.17607
TP: 1.18415
SL: Below 1.17250
❌ Bearish Scenario:
If price fails to hold above the trendline and breaks below 1.16793, it may signal a shift in momentum. In that case, a sell opportunity could emerge on the retest of broken support, targeting the next support level at 1.15983.
Sell Entry Idea:
Entry: Below 1.16793 after confirmation
TP: 1.15983
SL: Above 1.17000
💡Conclusion:
EUR/USD is currently at a key decision point. Traders should wait for a confirmed breakout in either direction before entering. Monitor volume and price action around the resistance and trendline area for the best setup.
📌 Always manage your risk and stick to your trading plan.
#EURUSD #ForexAnalysis #TradingSetup #PriceAction #SupportResistance #FXSMART

Euro Steady at $1.17 as ECB Holds FireThe euro hovered near $1.17 as traders awaited Thursday’s European Central Bank decision. With rates expected to remain steady following eight consecutive cuts, policymakers tread cautiously amid strength in the euro and lingering U.S. tariff uncertainty. Meanwhile, EU officials are preparing contingency plans in case trade negotiations with President Trump collapse before the August 1 deadline.
Resistance for the pair is at 1.1830, while support is at 1.1660.
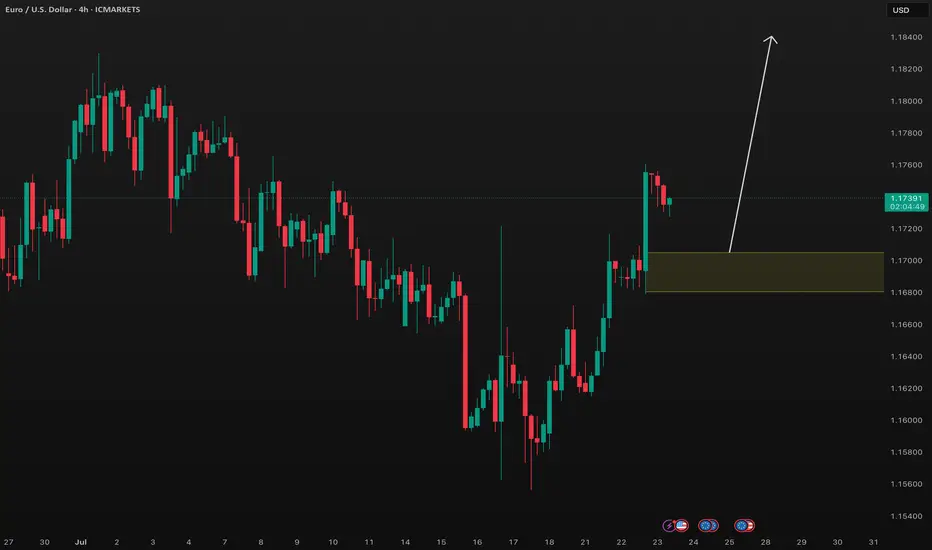
EURUSD - Price ActionYesterday’s accumulation phase pushed the market to new highs 📈, with a top forming at 1.17605. After the price pullback during the Asian session, it appears that London used the opportunity to enter short positions, potentially forming a distribution range.
As long as we remain above the vWAP from yesterday’s accumulation, I still see a possibility for a continued move to the upside 🚀
The next key level where I’ll be watching for long entries is the demand zone supported by vWAP around 1.16940 📊
👉 Follow me for more EUR/USD trade ideas, market updates. 💼
I share structured analysis every Monday and Wednesday to help you stay aligned with the market 🗓️📊

EURUSD BUY TRADE PLAN WITH CAUTIONEURUSD TRADE PLAN** 🔥
📅 Date: July 23, 2025
---
### 📋 Trade Plan Overview
| Plan ID | Type | Direction | Confidence | R\:R | Status |
| ----------------- | -------- | ----------------- | ---------- | ----- | ---------- |
| EURUSD-20250723-A | Swing | **Buy** (Primary) | ⭐⭐⭐⭐ (80%) | 3.5:1 | 🕒 Waiting |
| EURUSD-20250723-B | Tactical | Sell (Alt. Setup) | ⭐⭐⭐ (65%) | 2.5:1 | 🕒 Waiting |
🧭 **Guidance:**
Favor the **buy plan** due to HTF trend and liquidity sweep setup. Sell setup is tactical against trend.
---
## 📈 Market Bias & Trade Type
* **Bias:** Bullish overall (HTF)
* **Trade Type A:** Continuation (Buy) - PRIMARY / PREFERRED
* **Trade Type B:** Countertrend (Sell) - ALTERNATIVE
---
## 🔰 Confidence Level Breakdown
* ⭐⭐⭐⭐ 80% (Buy Plan A)
* H4 OB + Volume Imbalance = 35%
* Fib Confluence = 25%
* Sentiment Score +6/10 = 10%
* DXY Divergence = 10%
* ⭐⭐⭐ 65% (Sell Plan B)
* Short-term exhaustion pattern
* Inducement to the downside
---
## 📍 Entry Zones & Status
### 🟩 **Primary Buy Zone**
* **Zone:** 1.1680 – 1.1705 (H4 OB + Fib 61.8%)
* **Status:** 🕒 *Waiting*
### 🟧 **Secondary Buy Zone**
* **Zone:** 1.1640 – 1.1660 (Deeper imbalance)
* **Status:** 🕒 *Waiting*
---
### 🟥 **Sell Zone (Scenario B)**
* **Zone:** 1.1760 – 1.1790 (Liquidity sweep, bearish engulfing risk)
* **Status:** 🕒 *Waiting*
---
## ❗ Stop Loss Levels
* **Buy SL:** 1.1620 (Below OB + 1.5x ATR)
* **Sell SL:** 1.1815 (Above H4 supply & wick inducement)
---
## 🎯 Take Profit Targets
* 🥇 **TP1:** 1.1745 (OB imbalance reclaim) – \~65 pips
* 🥈 **TP2:** 1.1785 (Swing high) – \~100 pips
* 🥉 **TP3:** 1.1840 (Full extension / trail) – *Swing only*
---
## 📏 Risk\:Reward
* Buy Plan A: **3.5:1** to TP2, **5.2:1** to TP3
* Sell Plan B: **2.5:1** to TP2
---
## 🧠 Management Strategy
* Risk: 1.0% of account ($\ , \ lots)
* SL to breakeven at TP1
* Take: 30% at TP1, 50% at TP2, trail final 20%
* Exit if: H4 BOS or USD Index flips strongly bullish
---
## ⚠️ Confirmation Checklist
* Bullish engulfing or inside bar (H1-H4)
* Volume confirmation on bounce (preferably NY or London open)
* Optional: M30 RSI divergence
* **Avoid:** FOMC / ECB pressers
---
## ⏳ Validity
* **Buy Plan (H4):** Valid 48–72 hours → until July 26
* **Sell Plan (H1):** Valid 12–16 hours → intraday only
---
## ❌ Invalidation Conditions
* Close below 1.1620 (Buy)
* Close above 1.1815 (Sell)
* Major USD macro shift
---
## 🌐 Fundamental & Sentiment Snapshot
* COT: USD weak bias
* DXY: Retracing lower from 106.00
* Retail: 68% short EURUSD
* Cross-Pair: EURGBP also trending up
* Macro: EUR resilience post-ECB minutes
* Sentiment Score: **+6/10**
---
## 📋 Final Trade Summary
🟩 **Buy plan is preferred**, aligned with HTF trend, clean OB-Fib structure, and good RR.
🟥 **Sell plan** is tactical, potential liquidity grab before bullish continuation.
Both setups allow flexibility with proper confirmation and risk control.
---
Major EUR-related news is scheduled this week, and it's critical to factor into both trade timing and plan execution. Here's your ⚠️ Fundamental Update for EURUSD:
🌐 EUR Fundamental Events – This Week
Date Event Time (UTC) Impact Level Forecast / Notes
July 24 (Wed) 🇪🇺 Eurozone PMIs (Manu. & Services) 08:00 UTC 🔴 High Strong driver of EUR intraday volatility
July 25 (Thu) 🇪🇺 ECB Interest Rate Decision 12:15 UTC 🔴🔴🔴 Very High Key market mover – Dovish = bearish EUR
ECB Press Conference 12:45 UTC 🔴🔴🔴 Critical High volatility expected
July 26 (Fri) 🇩🇪 IFO Business Climate 08:00 UTC 🟡 Medium Impactful for EUR strength sentiment
🔍 Implications for Your EURUSD Trade Plan
✅ Buy Plan
Wait until post-ECB OR only take the setup with strong candle confirmation, ideally after NY session pullback.
Hold reduced exposure before July 25 ECB to avoid whipsaw.
❌ Sell Plan
Be extremely cautious; if ECB is neutral/hawkish, any tactical short may get invalidated rapidly.
If you take the short, exit before Thursday's ECB, unless trailing with SL to breakeven.
📊 Summary:
Yes, major EUR events this week — especially Thursday's ECB — could invalidate technical setups or accelerate them violently. Patience + confirmation = priority. Avoid entry during red events. Let volatility settle.
Let me know if you'd like to pause your trade plan until post-news or want a modified low-volatility alternative!
🧠 Always manage risk tightly around macro events. This is not investment advice.
🧠 Fundamental Snapshot
🔵 EUR Macro Landscape:
Factor Signal Explanation
Inflation 🔼 Still elevated Keeps ECB hawkish bias alive
ECB Policy ⚠️ Potentially hawkish hold Market expects no cut, but hawkish tone could push EUR higher
Economic Activity ⚪ Mixed PMIs Slight slowdown, but not recessionary
COT/Positioning 🟢 Light EUR longs Room for upside without overcrowding
Retail Sentiment 🔴 Bearish crowd Contrarian signal supports buys
USD Pressure 🟠 Mixed Fed possibly done hiking, but US economy resilient
⚠️ ECB SCENARIOS (July 25):
Scenario Likelihood Market Reaction
🟢 Hawkish Hold (no cut, firm inflation tone) 60% 🔼 EURUSD likely rallies
🟡 Neutral/Dovish Hold 30% 🔄 EUR consolidates or fades spike
🔴 Surprise Cut / Dovish Pivot 10% 🔽 EUR drops hard – buy invalidated
Most institutional forecasts lean toward a hawkish or neutral hold, giving EURUSD room to rise after the event.
🎯 Conclusion:
✅ Fundamentals support a buy, especially post-ECB.
❗ Best entry is after July 25, when market digests Lagarde's tone.
🔄 If entering early, stay small and manage risk very tightly — ECB surprises = volatility.
EURUSD M30 I Bearish Drop Based on the M30 chart analysis, we can see that the price is testing our sell entry at 1.1736, which is an overlap resistance.
Our take profit will be at 1.1712 a pullback support level.
The stop loss will be placed at 1.1768, which is above a swing high resistance level.
High Risk Investment Warning
Trading Forex/CFDs on margin carries a high level of risk and may not be suitable for all investors. Leverage can work against you.
Stratos Markets Limited (tradu.com ):
CFDs are complex instruments and come with a high risk of losing money rapidly due to leverage. 66% of retail investor accounts lose money when trading CFDs with this provider. You should consider whether you understand how CFDs work and whether you can afford to take the high risk of losing your money.
Stratos Europe Ltd (tradu.com ):
CFDs are complex instruments and come with a high risk of losing money rapidly due to leverage. 66% of retail investor accounts lose money when trading CFDs with this provider. You should consider whether you understand how CFDs work and whether you can afford to take the high risk of losing your money.
Stratos Global LLC (tradu.com ):
Losses can exceed deposits.
Please be advised that the information presented on TradingView is provided to Tradu (‘Company’, ‘we’) by a third-party provider (‘TFA Global Pte Ltd’). Please be reminded that you are solely responsible for the trading decisions on your account. There is a very high degree of risk involved in trading. Any information and/or content is intended entirely for research, educational and informational purposes only and does not constitute investment or consultation advice or investment strategy. The information is not tailored to the investment needs of any specific person and therefore does not involve a consideration of any of the investment objectives, financial situation or needs of any viewer that may receive it. Kindly also note that past performance is not a reliable indicator of future results. Actual results may differ materially from those anticipated in forward-looking or past performance statements. We assume no liability as to the accuracy or completeness of any of the information and/or content provided herein and the Company cannot be held responsible for any omission, mistake nor for any loss or damage including without limitation to any loss of profit which may arise from reliance on any information supplied by TFA Global Pte Ltd.
The speaker(s) is neither an employee, agent nor representative of Tradu and is therefore acting independently. The opinions given are their own, constitute general market commentary, and do not constitute the opinion or advice of Tradu or any form of personal or investment advice. Tradu neither endorses nor guarantees offerings of third-party speakers, nor is Tradu responsible for the content, veracity or opinions of third-party speakers, presenters or participants.

EU London Protocol, Bread & ButterOn this quick video I share my past trade I took using the London protocol. And the anticipation of the next day and how I will look to take my setup, if it will form.

Already LONG EURUSD, come join the party !Come join the party and bring the USD down, haha.
This is the 4H chart and the day is still showing a bullish trend.
Please DYODD

