USDEUR trade ideas

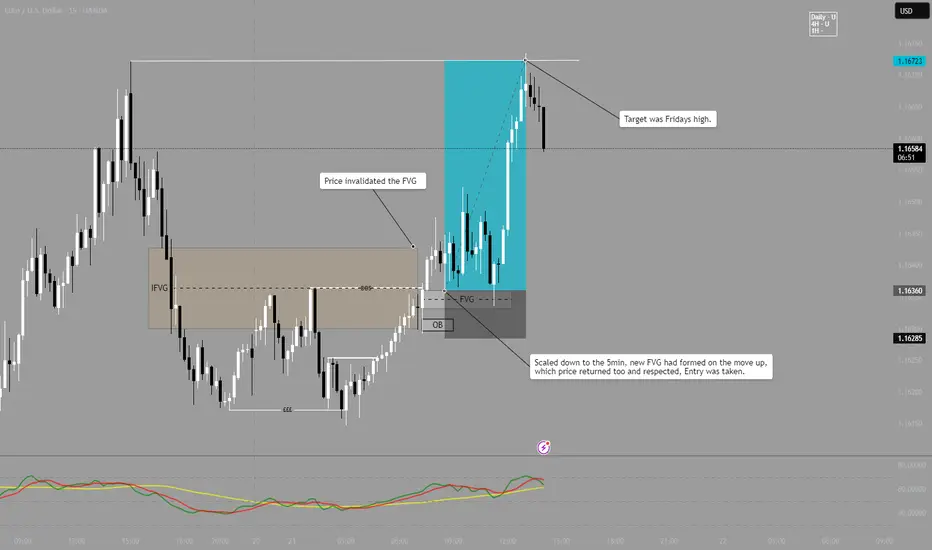
EUR/USD LONG - Follow upAs can be seen, Price invalidated the FVG, indicating a bullish momentum.
After price broke, I then look at the 5 minute for a precise entry.
On the 5m an FVG had been created on the initial move up, price then returned to this area and an entry long was taken.
Target was Fridays Highs.
Note - This is published on the 15m as it wont allow to post with 5m timeframe.
buy ideahi all. price return at 11 from middle of the know where and will react to a special level. be happy(wink)

EUR/USD Analysis by zForex Research Team - 07.21.2025EUR/USD Pulls Back Amid Trade Deal Uncertainty
EUR/USD edged down to 1.1620 during Monday’s Asian session, after gains in the previous session, as the US Dollar stayed firm and traders remained cautious ahead of the August 1 tariff deadline.
US Commerce Secretary Howard Lutnick said the Trump administration expects to finalize trade deals with major partners in the coming weeks, calling the next two weeks “historic.” He expressed optimism about reaching an agreement with the EU but confirmed that August 1 remains a firm deadline for new tariffs.
Resistance levels for EUR/USD are set at 1.1670, followed by 1.1700, and extend up to 1.1750. On the downside, support is found at 1.1580, with additional levels at 1.1540 and 1.1500.
EUR/USD 21.07.25EUR/USD: Uptrend Continues — Targeting 1.1859**
Market Overview:
EUR/USD has bounced off the 1.1570–1.1540 support zone, confirming the integrity of the uptrend. The pair remains inside a rising channel and is approaching key resistance on the D1 level.
Technical Signals & Formations:
— EMA(144) on 8H acts as dynamic support
— Key support at 1.1570–1.1540 held strong
— Bullish momentum targets the 1.1859 resistance (D1)
— Bullish candlestick pattern formed on rebound
Key Levels:
Support: 1.1570, 1.1540
Resistance: 1.1859 (D1)
Scenario:
Primary: continuation toward 1.1859
Alternative: if 1.1540 breaks, possible retracement to 1.1450

EUR/USD BEST PLACE TO SELL FROM|SHORT
Hello, Friends!
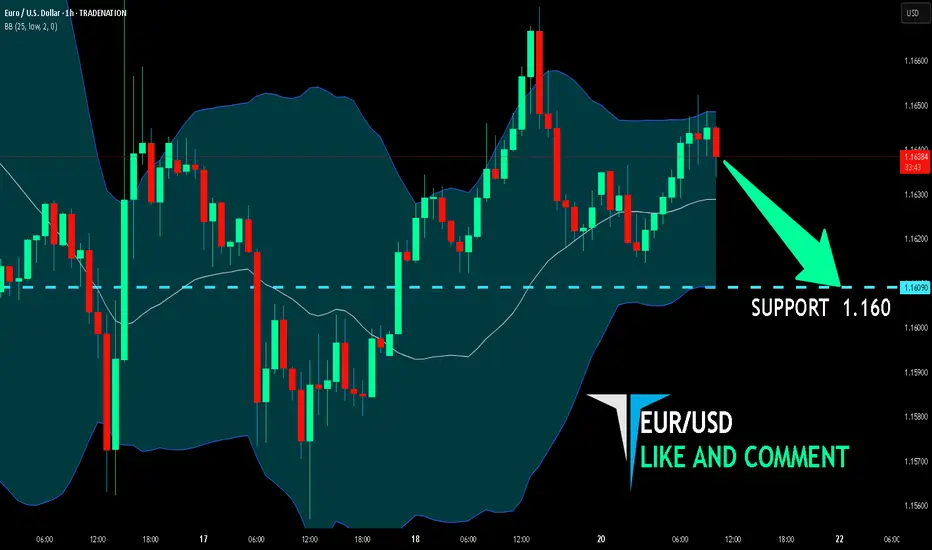
EUR/USD is making a bullish rebound on the 1H TF and is nearing the resistance line above while we are generally bearish biased on the pair due to our previous 1W candle analysis, thus making a trend-following short a good option for us with the target being the 1.160level.
Disclosure: I am part of Trade Nation's Influencer program and receive a monthly fee for using their TradingView charts in my analysis.
✅LIKE AND COMMENT MY IDEAS✅
EUR/USD BEST PLACE TO SELL FROM|SHORT
Hello, Friends!
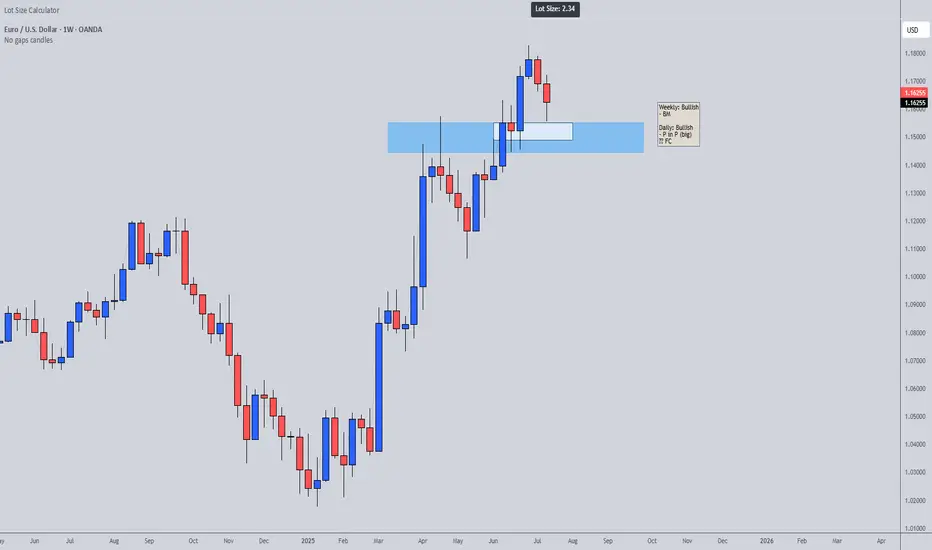
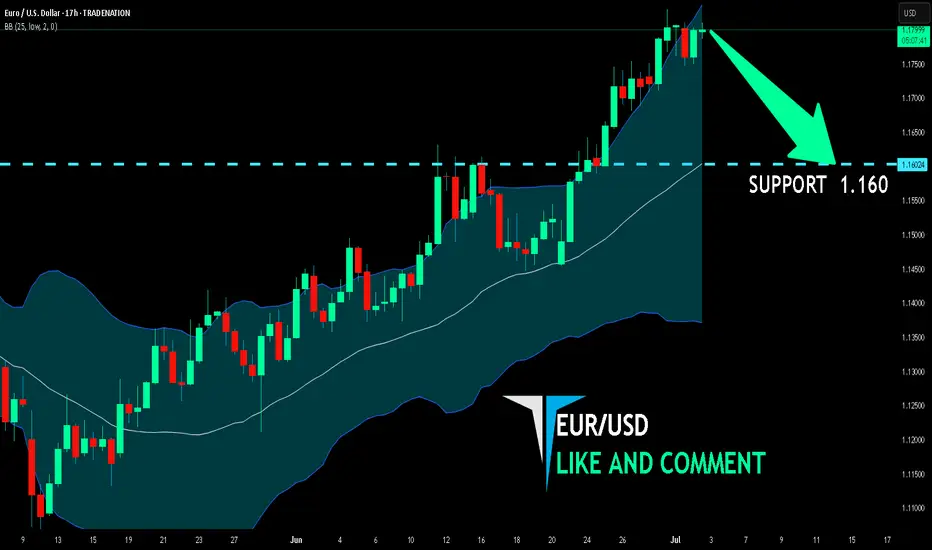
EUR/USD pair is trading in a local downtrend which know by looking at the previous 1W candle which is red. On the 17H timeframe the pair is going up. The pair is overbought because the price is close to the upper band of the BB indicator. So we are looking to sell the pair with the upper BB line acting as resistance. The next target is 1.160 area.
Disclosure: I am part of Trade Nation's Influencer program and receive a monthly fee for using their TradingView charts in my analysis.
✅LIKE AND COMMENT MY IDEAS✅
EURUSD Possible Up Reverse zoneAccording to the current market situation EURUSD experiencing a bullish signal as sellers has been fading since last couple of weeks. Sellers tried couple of times to push more with the previous downtrend. But looks like it's failed. Buyers are pushing more than sellers here now.
# EURUSD Forecast July 2025: Complete Technical & Fundamental Analysis - 7-Day Trading Outlook
Last Updated: July 21, 2025 | Market Price: 1.1625
EURUSD Market Sentiment & Direction
The EUR/USD currency pair is currently navigating a critical juncture as we enter the final week of July 2025. With the pair trading near 1.1625, **forex traders** are witnessing a fascinating interplay between **bullish technical patterns** and **bearish fundamental pressures**. This comprehensive **EURUSD analysis** combines **sentiment analysis**, **technical indicators**, and **fundamental factors** to provide a complete 7-day trading roadmap.
Current Market Position: Key Price Levels & Trading Range
Live EURUSD Price Action
The **EUR/USD pair** has experienced significant volatility, settling around **1.1650** after bottoming at **1.1555** last week. This consolidation phase represents a crucial decision point for **currency traders** looking to capitalize on the next directional move.
Critical Support & Resistance Levels
🔻 Key Support Zones:
Primary Support: 1.1570 (Major psychological level)
Secondary Support: 1.1500 (Round number significance)
Tertiary Support: 1.1430 (Weekly low projection)
🔺 Key Resistance Zones:**
Immediate Resistance: 1.1700 (Daily pivot)
Secondary Resistance: 1.1780 (Technical confluence)
Major Resistance: 1.1900 (Multi-week high)
Technical Analysis : Chart Patterns & Trading Signals
Wedge Breakout Pattern Analysis
Our technical analysis reveals a compelling **wedge breakout formation** on the M30 timeframe, suggesting a potential buying opportunity. This **bullish pattern** indicates that despite recent weakness, the **EURUSD forecast** may favor upside momentum in the short term.
Multi-Timeframe Rating System
Daily Rating: BUY signal confirmed
Weekly Rating: BUY bias maintained
Monthly Outlook: Bullish continuation expected
Key Technical Indicators
The trading signals are currently mixed, with momentum oscillators showing:
- RSI approaching oversold territory (potential bounce)
- MACD showing bullish divergence
- Moving averages providing dynamic support
Fundamental Analysis: Economic Drivers & Market Catalysts
Bearish Fundamental Factors
1. US Dollar Strength Persists
The USD strength continues to pressure the euro, with the greenback maintaining its firm positioning across major currency pairs. This **dollar dominance** is creating headwinds for EUR/USD bulls.
2. Geopolitical Concerns & Tariff Fears
Recent developments regarding **tariff implementation and trade war concerns are weighing on European assets, creating additional selling pressure for the euro.
3. ECB Policy Expectations
The European Central Bank is expected to continue its dovish stance, with rate cuts toward the 2.0% target anticipated through mid-2025, according to economist surveys.
Bullish Fundamental Catalysts
1. German Economic Recovery Potential
Improved German governance and economic reforms could strengthen the Eurozone's largest economy, providing fundamental support for the euro.
2. Inflation Dynamics
Eurozone inflation trends and upcoming CPI data releases may shift ECB policy expectations, potentially supporting euro strength.
Sentiment Analysis: Retail vs Institutional Positioning
Retail Trader Sentiment (Contrarian Indicator)
Current market sentiment shows that 70% of retail traders are selling EURUSD, creating a potentially bullish contrarian setup. This heavy short positioning often precedes trend reversals in the forex market.
Institutional Flow Analysis
While retail sentiment suggests upside potential, institutional flows remain mixed, with smart money positioning cautiously amid fundamental uncertainties.
## Trading Strategy & Risk Management
### Short-Term Trading Setup (1-3 Days)
🎯 Buy Setup:
Entry Zone: 1.1560-1.1580 (Support confluence)
Target 1: 1.1700 (Immediate resistance)
Target 2: 1.1780 (Extended target)
Stop Loss: 1.1500 (Risk management)
📉 Sell Setup:
Entry Zone: 1.1660-1.1670 (Resistance test)
Target 1: 1.1570 (Support retest)
Target 2: 1.1500 (Extended downside)
Stop Loss: 1.1750 (Invalidation level)
Risk Factors & Event Calendar
High-Impact Events to Watch:
US Non-Farm Payrolls data
ECB policy communications
German economic indicators
CPI inflation** releases
Geopolitical developments
7-Day EURUSD Forecast: Price Predictions & Scenarios
Base Case Scenario (60% Probability)
Range-bound trading between 1.1500-1.1750 with eventual upside resolution toward 1.1800 as retail short covering accelerates.
Bullish Scenario (25% Probability)
Breakout above 1.1750 triggers momentum buying toward 1.1900, supported by improved European economic data and USD weakness.
Bearish Scenario (15% Probability)
Break below 1.1500 could accelerate selling toward 1.1400, driven by continued USD strength and deteriorating risk sentiment.
Professional Trading Tips & Best Practices
Position Sizing & Money Management
- Risk no more than 2% per trade
- Use **proper position sizing** based on stop-loss distance
- Consider **correlation** with other EUR pairs
Entry & Exit Strategies
- Wait for **price confirmation** at key levels
- Use **multiple timeframe analysis** for better entries
- Implement **trailing stops** for profit protection
Market Outlook Summary: Key Takeaways for Forex Traders
The **EURUSD outlook** for the next 7 days presents a mixed picture with slight **bearish bias** in the immediate term. Key factors to monitor include:
1. Technical support test at 1.1625-1.1605
2.Retail sentiment providing contrarian bullish signals
3. Fundamental headwinds from USD strength
4. Event risk from economic data releases
Trading Recommendation
Tactical approach: Look for buy opportunities near support with tight risk management, while remaining prepared for range-bound conditions until a clear directional catalyst emerges.

EURUSD - Monday AnalysisAt the beginning of the new week, we're in a local uptrend following the completion of Friday’s bullish wave. I'm currently anticipating two scenarios, which I positioned for on Friday:
Continuation of the trend toward new highs, targeting 1.172
A potential correction into the demand zone around 1.1594
Follow me for more EUR/USD insights and analysis 🔍

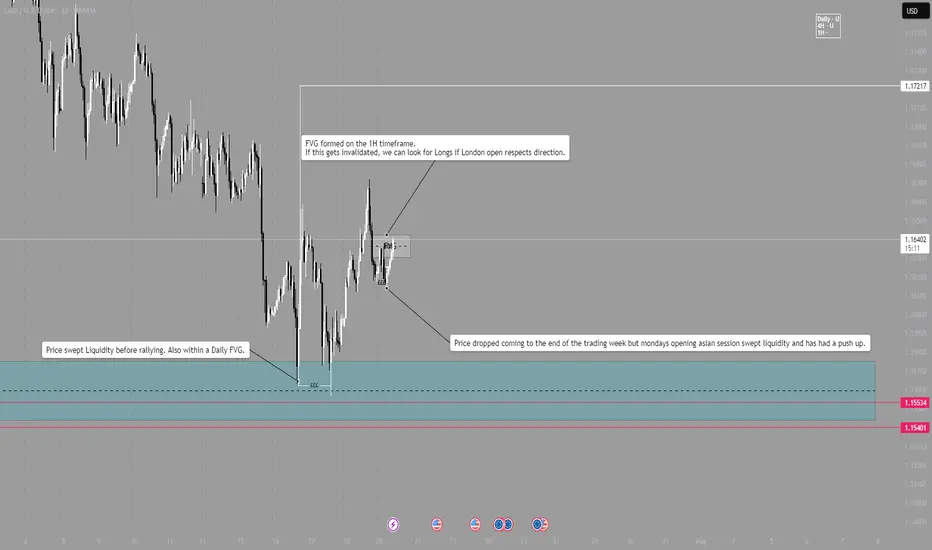
EUR/USD - LONGLondon Session Pre market breakdown.
Daily bias is long.
4H bias is Long.
1H bias is Long.
After last weeks sweep on liquidity within a Daily FVG, market pushed higher, providing several long opportunities.
Now at the beginning of the week, price dropped during Asia session and swept some of Fridays New York liquidity.
Price is pushing higher and is now in a 1H Bearish FVG, if the FVG is broken, we can look for Longs around that range.
NOTE - Wait and see how London open plays out, DO NOT enter within first 15mins and wait for trend continuation to be verified before entering. Always wait for a candle close and a break of structure.
Eurousd techinical analysis.Eurousd techinical analysis next move posibale at h1 time frame.not finchinal advice.

EUR USD SHORTLets go for the first idea for this week, I will be watching other currency pairs, if we have a clear opportunity, we can get in.

EURUSD - M15 Supply Zone RetestThe current price action shows that the market is expected to first fill the Fair Value Gap (FVG) area, which acts as a price inefficiency zone demanding liquidity clearance. After the FVG is filled, the price is anticipated to retest the Higher Time Frame (HTF) Supply Zone, which serves as a strong resistance area.
Following the retest of the supply zone, the prevailing downtrend is likely to resume, pushing the price downwards towards the HTF Demand Zone. This demand zone is identified as a key support level where buying interest is expected to emerge, potentially halting the decline temporarily or initiating a reversal.
This trading plan emphasizes waiting patiently for the FVG fill as a prerequisite step before looking for a supply zone retest confirmation to enter short positions targeting the demand zone below, aligning with the overall bearish trend continuation.

EURUSDThis is the EURUSD 1H chart showing a potential bullish setup. Here’s a breakdown of your market structure and what you can do:
Observations:
1. Trendline Support: Price is respecting a daily trendline, which shows potential for upward continuation.
2. Order Block: Price has tapped into a clear order block zone, indicating institutional interest and potential for a reversal.
3. BOS (Break of Structure) & CHoCH (Change of Character): Previous BOS confirms downward movement, but recent CHoCH suggests a possible shift to bullish momentum.
4. Bullish Projection: Your markup shows a forecasted bullish leg with a minor pullback before continuation.
What to do:
- Entry: Wait for a confirmation candle (bullish engulfing or strong rejection wick) within or just above the order block to go long.
- Stop Loss: Place it just below the order block or trendline for safety.
- Take Profit: You can scale out at recent highs or follow price using trailing stops. Consider targeting previous supply zones for partial exits.

Eurusd changing trendPrepeair Ur selv to see euro against US dollar with a kinda big or minimum huge profit, going 2 cents above, from 1.1620 to 1.1840, ofc this is only in my POV.
Keep Ur investment safe and use lways a stop loss under wht you can lose, and I don't mean this trade, but all I mean, is that it need to be after Ur analista and Ur own Point of View.
Keep Ur trade simple
Abd do your own research, always.

EURUSD BUY SETUPEURUSD has touched our sloping support trendline and support zone , ITS still in an uptrend it just came for retest . so our expectations is that we might see it going up since it has tested the major zone but we stay watch on what's going to follow next .

Week of 7/20/25: EURUSD AnalysisLast week's price action was bearish and has finally reached the extreme daily demand level and provided some reaction. Price has swept bulls and bears, so now we follow internal structure and wait to see where price actually wants to go. If internal 1h structure breaks bearish, we have confirmation to trade bearish until price goes deeper into the daily extreme zone.

EURUSD - Bullish Bias with Tactical Short Setup• Pair: EURUSD
• Bias: Bullish overall | Tactical short into demand
• HTF Overview (4H):
• Bullish structure confirmed.
• Price took out SSL liquidity — likely draw is internal structure OB below.
• Expecting deeper pullback before continuation.
• MTF Refinement (30M):
• Looking for price to sell off into 4H OB.
• Price already mitigated 30M OB and rejected — watching for follow-through.
• LTF Confirmation (5M):
• Still in analysis mode — waiting on a CHoCH from 5M OB.
• Green lines on chart reflect 5M internal structure.
• Entry Zone:
• Enter short only after 5M shift confirms.
• Ride short into 4H OB demand zone.
• Targets:
• Short-term: 30M lows.
• Major: 4H OB for bullish reaction.
• Mindset Note:
• No rush to enter — analysis leads, execution follows.
• Let price deliver confirmation before switching to trader mode.
Bless Trading!

EUR/USD - Pattern & SMA PerspectiveDear Friends in Trading,
How I see it,
Keynotes:
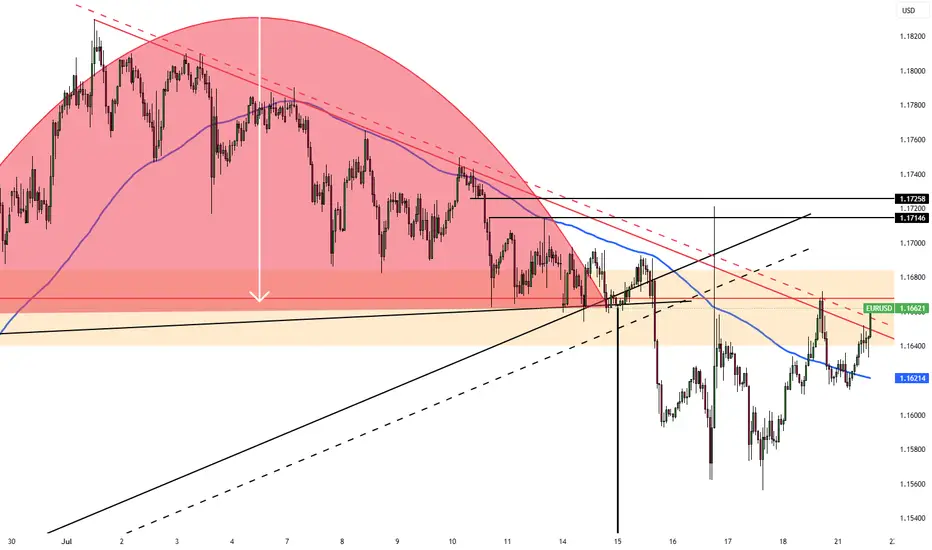
A] Under Pressure
B] Previous Swing Support Area
C] Contraction/Accumulation
Rangebound pattern:
1) Short term correction trend holding firm
2) Decisive breakout expansion required above or below range
3) Pair suggests that greenback bulls are in charge at this time
I sincerely hope my point of view offers a valued insight.
Thank you for taking the time study my)) analysis.

DXY was looking for More Liquidity to sweepIt appears that the DXY was searching for more liquidity before continuing its decline. There are good buying areas for the EURUSD, as the liquidity swept to the bottom, and the immediate rebound indicates the strength of this area and can be considered a buying zone.
This area coincides with the 61 Fibonacci support line, confirming the possibility of an upside move.
The GBPUSD was targeting the bottom to trigger a liquidity sweep on the weekly timeframe. This is also an SMT signal, but it is somewhat weak, but it confirms the complete vision of the analysis.

EURUSDThe Euro-Dollar has fallen to the downtrend line and reached the top of the ascending channel. We are expecting a pivot to form and reach the bottom of the ascending channel.

The Ineffectiveness of Day Trading: A Critical Review of EmpiricThe Allure of Quick Profits
Day trading has gained considerable popularity as an investment strategy among retail investors, particularly following technological advances in electronic trading platforms and commission-free brokerage services. This analysis examines the available empirical evidence from various markets and time periods to evaluate the economic viability of day trading as an investment strategy.
The most comprehensive study on the subject comes from Barber et al. (2011), who analyzed the behavior of over 360,000 day traders in Taiwan. Their results show that over 80 percent of day traders lose money, and less than 1 percent can achieve consistently profitable results. These findings align with similar studies from other markets and confirm the systematic unprofitability of day trading for the vast majority of participants.
Day trading represents a systematically unprofitable investment strategy for retail investors, rooted in cognitive biases (Kahneman & Tversky, 1979), excessive transaction costs, and market microstructure inefficiencies (O'Hara, 1995). Long-term passive investment strategies demonstrate superior risk-adjusted returns with significantly lower resource requirements.
What the Research Shows
The research landscape on day trading is clear and consistent across various markets. A systematic review of the most important studies follows established standards of financial market research.
The inclusion criteria for relevant studies encompass empirical investigations with substantial sample sizes (more than 1,000 traders), minimum observation periods of 12 months, and quantitative performance measures. The available literature is based on millions of trading accounts from various developed markets.
The historical development of day trading shows clear parallels to technological developments in the financial sector. Before deregulation through Electronic Communication Networks by the SEC in 1997, it was impossible for retail investors to trade directly in the market. With the rise of online brokers like E*TRADE and Ameritrade, day trading became accessible to the mass public for the first time. This technical opening coincided with aggressive marketing that promoted free trades, low fees, and success stories of individual traders.
Empirical Findings
Evidence from various markets shows consistent patterns. Barber et al. (2011) document that 84.3 percent of 360,000 analyzed day traders in Taiwan suffered losses, with a median return of minus 8.7 percent. Similar studies from the United States confirm loss rates exceeding 90 percent of participants.
Jordan and Diltz (2003) conclude that even experienced day traders are hardly able to beat the market after costs in the long term. The long-term results are even more sobering: only a fraction of all day traders remain profitable over extended periods, while a significant portion abandons the activity within two years.
The transaction cost analysis is based on realistic market conditions. A calculation example illustrates the structural challenges: with an assumed daily trading volume of $50,000 and eight round trips per day, substantial costs arise from commissions (approximately 0.1% per trade), bid-ask spreads (averaging 0.02-0.05%), and market impact (about 0.01% for smaller volumes).
Annual Cost Calculation Example:
- 252 trading days × 8 trades = 2,016 trades/year
- Commission costs: 2,016 × $2.50 = $5,040
- Spread costs: $50,000 × 0.03% × 2,016 = $30,240
- Total costs: approximately $35,000 or 70% of daily trading volume
This cost structure means that day traders must achieve gross returns of well over 70 percent annually just to break even, while passive investors bear annual costs of only 0.1 to 0.3 percent (Bogle, 2007).
Behavioral Analysis and Cognitive Biases
Behavioral research explains why day trading remains attractive despite poor success prospects. Odean (1999) shows that overconfident investors trade excessively and thereby reduce their expected returns. The disposition effect documented by Shefrin and Statman (1985) leads traders to realize gains too early and hold losses too long.
Kahneman and Tversky's (1979) Prospect Theory explains systematic biases in decision-making under uncertainty. Loss aversion leads to losses weighing psychologically heavier than equivalent gains, resulting in irrational holding of losing positions.
The gambler's fallacy manifests in the erroneous assumption of many day traders that past losses make future gains more likely. Recency bias leads to overweighting recent events. These psychological factors reinforce each other and create a vicious cycle of irrational decisions.
Comparative Analysis: Day Trading versus Passive Strategies
A comparison with established investment strategies illustrates the systematic disadvantages of day trading. Malkiel (2011) documents long-term returns of diversified portfolios at 6-8 percent real, while Barber and Odean (2000) show that frequent trading systematically reduces returns.
Historical data shows that the S&P 500 Index achieved an average annual return of 10.2 percent with 15.8 percent volatility over 30 years (Sharpe ratio: 0.65). Day traders, in contrast, typically exhibit negative Sharpe ratios as losses dominate amid high volatility.
The time investment differs dramatically: day trading requires 40-50 hours of weekly attention, while passive investing demands less than one hour per week. Studies also show health burdens from the constant stress of active trading.
Market Microstructure and Professional Trading
Market structure systematically favors institutional players. High-frequency trading firms possess latency advantages in the microsecond range, while retail traders operate with delays exceeding 100 milliseconds. They utilize co-location services and process data volumes inaccessible to private investors.
Market-making operations profit from bid-ask spreads and exchange rebate programs. They operate under different regulatory frameworks and have access to dark pools and proprietary technology.
Day trading mathematically represents a zero-sum game that becomes negative after costs. Since the sum of all trading gains and losses equals zero, but transaction costs are positive, the expected return for all participants collectively is necessarily negative.
Alternative Investment Strategies
Academic literature comprehensively documents the superiority of passive strategies. Bogle (2007) demonstrates through long-term data that low-cost index funds consistently achieve better net returns than active strategies.
Passive Strategy Calculation Example:
An investment of €10,000 in a low-cost ETF (0.15% TER) with 7% annual returns yields approximately €37,000 after 20 years. To achieve this result, day traders would need to consistently earn over 15% gross returns after costs—a scenario that is empirically nearly impossible.
Factor-based investing offers additional improvements: Fama and French (1992) documented excess returns for value and size factors that are systematically and cost-effectively accessible.
Limitations of the Evidence
The research landscape has certain constraints. Survivorship bias in datasets may underestimate actual losses, as unsuccessful traders disappear from samples more quickly. Additionally, definitions of day trading vary between studies.
External validity is influenced by changing market structures. Algorithmic trading and new financial instruments may alter established patterns. Nevertheless, the fundamental problems of high costs and systematic behavioral biases persist.
Conclusion
The empirical evidence is clear: day trading represents a loss-making activity for the vast majority of participants. The combination of high transaction costs, systematic behavioral biases, and structural market disparities makes consistent profitability nearly impossible.
While isolated success stories exist, they represent statistical outliers rather than replicable strategies. The scientific evidence speaks unequivocally in favor of long-term, low-cost, and diversified investment strategies as superior alternatives to day trading.
Those who nonetheless engage in day trading should be aware that they are not only competing against the market, but against mathematical and psychological realities that practically preclude a high probability of success.
References
Barber, Brad M., Yi-Tsung Lee, Yu-Jane Liu, and Terrance Odean. "Do Individual Day Traders Make Money? Evidence from Taiwan." *Review of Financial Studies* 24, no. 8 (2011): 2892-2922.
Barber, Brad M., and Terrance Odean. "Trading Is Hazardous to Your Wealth: The Common Stock Investment Performance of Individual Investors." *Journal of Finance* 55, no. 2 (2000): 773-806.
Bogle, John C. *The Little Book of Common Sense Investing*. Hoboken: Wiley, 2007.
Fama, Eugene F., and Kenneth R. French. "The Cross-Section of Expected Stock Returns." *Journal of Finance* 47, no. 2 (1992): 427-465.
Jordan, Douglas J., and J. David Diltz. "The Profitability of Day Traders." *Financial Analysts Journal* 59, no. 6 (2003): 85-94.
Kahneman, Daniel, and Amos Tversky. "Prospect Theory: An Analysis of Decision under Risk." *Econometrica* 47, no. 2 (1979): 263-291.
Malkiel, Burton G. *A Random Walk Down Wall Street*. 10th ed. New York: Norton, 2011.
Odean, Terrance. "Do Investors Trade Too Much?" *American Economic Review* 89, no. 5 (1999): 1279-1298.
O'Hara, Maureen. *Market Microstructure Theory*. Oxford: Blackwell Publishers, 1995.
Shefrin, Hersh, and Meir Statman. "The Disposition to Sell Winners Too Early and Ride Losers Too Long: Theory and Evidence." *Journal of Finance* 40, no. 3 (1985): 777-790.