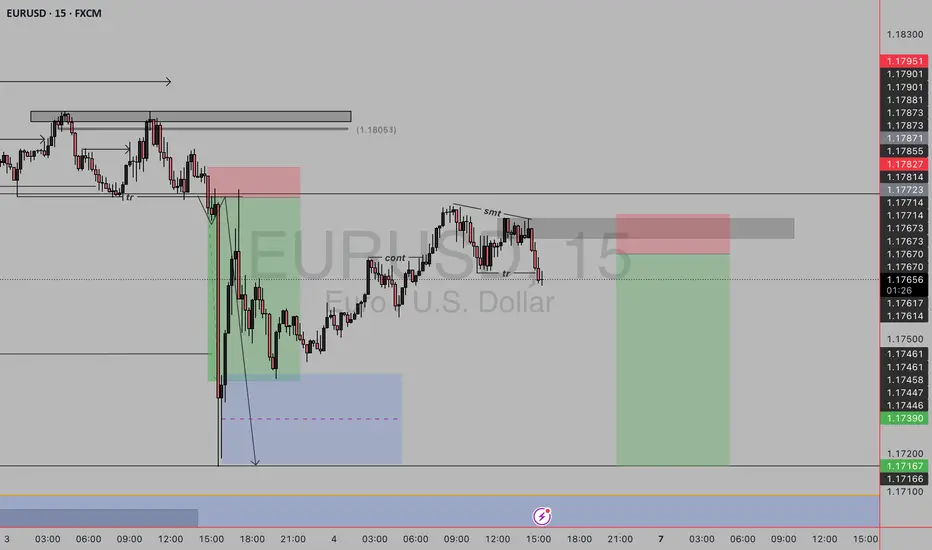
eurusd sell setup The trend on ltf is currently bearish and i have noticed a break of low plus liquidity available to grab for sells .Since its a counter trend due to HTF trend we go low risk short if given a retracement
USDEUR trade ideas
EUR/USD – Smart Money Trap at 1.18? Massive Rejection Ahead 1. Technical Context
The pair has been moving inside a well-defined bullish channel since May, forming higher highs and higher lows. Price is currently hovering around 1.1718, approaching the upper boundary of the channel and a key weekly supply zone (1.1750–1.1850).
➡️ Potential scenario:
A short bullish extension toward 1.1780–1.1820 to trigger stop hunts, followed by a bearish rejection toward 1.1500, and potentially 1.1380.
The daily RSI is overbought (>70), suggesting a likely short-term correction.
2. Retail Sentiment
80% of retail traders are short, with an average entry around 1.1318.
This signals a liquidity cluster above current highs, increasing the likelihood of a fake bullish breakout followed by a sell-off.
➡️ Contrarian insight: Retail heavily short → market may push higher first to wipe them out before reversing lower.
3. COT Report – USD Index (DXY)
Non-commercials (speculators) increased their short exposure on USD (+3,134).
Commercials cut their short positions (-1,994), indicating a potential bottoming on the dollar.
➡️ Conclusion: USD strength could return soon → bearish pressure for EUR/USD.
4. COT Report – EUR FX
Non-commercials increased longs on EUR (+2,980) and sharply reduced shorts (-6,602) → market is now heavily net long.
Commercials remain net short (581,664 vs 417,363 longs).
➡️ Over-leveraged spec longs → vulnerable to downside squeeze if macro sentiment shifts.
5. Seasonality
June tends to be mildly bullish for EUR/USD.
July historically shows even stronger upward performance over the last 5–10 years.
➡️ Shorts are high risk in the very short term, but a bearish setup is likely in the second half of July, especially if price action confirms.
6. Trading Outlook
📍 Short-Term Bias: Neutral to bullish toward 1.1780–1.1820
📍 Mid-Term Bias: Bearish on rejection from supply area and break of channel
🎯 Key Levels:
1.1780–1.1850: critical decision zone (liquidity + weekly supply)
1.1500: first key support
1.1380: next downside target (demand zone + previous POC)
📌 Final Conclusion
The most likely play is a short setup from 1.1780–1.1850 on strong rejection, supported by:
Extreme retail positioning (80% short),
COT pointing to USD recovery,
Extended technical structure,
Overbought RSI on the daily chart.

EURUSD : Next week is going to be excitingNo, it is not me saying.
It is the :
a) trendline
b) the D, d, and f
c) the price pattern
All converging at the same point @ 1.0930
Get your money ready.
Good luck.

EURUSDEURUSD needs more correction downwards before further push up.
Disclosure: We are part of Trade Nation's Influencer program and receive a monthly fee for using their TradingView charts in our analysis.

EUR/USD technical and fundamental analysis for next 2 days.Hello Traders,
This whole analysis is based on 1 hour time frame.
Indicators used for technical analysis:
EMA
RSI
VWAP anchor
Volume Profile
Fibonacci retracement and extension
In 1 hour time frame price is forming an ascending triangle which is likely to break out as EMA, and vwap are signalling bullish momentum.
If price breaks resistance at $1.17832 its likely to go up till $1.18100.
RSI is in the middle so it has ample room to move in both directions, So if trend line support breaks the price might move downwards to the support level at &1.17628 but the probability of this is very low.
Volume profile is highlighting the current price with the most volume so it makes it a critical point for movement in any direction.
Fundamental Analysis:
The Fed (US Central Bank) is getting soft: On July 9th, we'll see notes from their last meeting. They're expected to sound pretty dovish, which just means they're worried about the US economy and might cut interest rates soon.
Trump's Tariffs are back (July 9th deadline): If he puts new taxes on imported goods, it makes global trade messy and creates a lot of worry about the US economy. When people worry about the US, they tend to sell US Dollars.
The Dollar is already weak & It's already been losing strength.
Because the US Dollar is set to get a lot weaker from those big events on July 9th, and the Euro is holding steady, the EUR/USD is very likely to tilt UP.
Remember trading is a game of probability and this analysis could go wrong but technical and fundamental analysis are suggesting strong bullish movement.

#EURUSD: Nothing to expect from DXY| View Changed Swing Trading|Hey there! So, we were previously thinking EURUSD was going to be bearish, but things have turned around and it’s looking bullish for now.
The extreme bearish pressure on USD has caused all the major USD pairs to be in a range. As the week goes on and we get the NFP data, the market will probably focus more on these economic indicators. So, it’s not surprising to see some market ranges during this time.
We’ll keep a close eye on the market, as there might be some manipulation going on this week.
We recommend waiting until Monday’s daily candle closes to see if the bullish trend is strong enough. Then, based on the price momentum, you can make your decisions.
We hope you have a great week and safe trading! If you like our work and analysis, please consider liking, commenting, and sharing our content.
Cheers,
Team Setupsfx
❤️🚀


EURUSD Ahead of NFP Data! Trading ScenariosEURUSD Ahead of NFP Data! Trading Scenarios
Today we have NFP data. The market expects NFP to reach 110K vs. 139K previously
ADP data came in lower than expected - 33K vs. 95K expected and JOLT data came in higher than expected 7.76M vs. 7.3M
It will be a risky decision to trade EURUSD today due to the market's interpretation regarding the FED and whether or not they will cut rates at the July meeting.
EURUSD could make either move. If it moves above the 1.1825 box, then it could rise further for a larger bullish wave near 1.1900
If it moves below the 1.1745 box, then a larger bearish wave could occur with targets at 1.1660 and 1.1590
You may find more details in the chart!
Thank you and Good Luck!
PS: Please support with a like or comment if you find this analysis useful for your trading day
Disclosure: I am part of Trade Nation's Influencer program and receive a monthly fee for using their TradingView charts in my analysis.

EUR/USD Wave 5 Topped? Correction Incoming to 1.076FX_IDC:EURUSD PEPPERSTONE:EURUSD OANDA:EURUSD
📈 Chart Breakdown
🔢 Elliott Impulse Wave Completed:
Waves (1) to (5) appear to form a clean 5-wave impulse structure upward.
Final wave (5) is diverging on the oscillator (RSI), signaling potential bullish exhaustion.
🧾 ABC Correction Expected:
After the 5-wave impulse, you project an ABC corrective move:
Wave A: initial drop
Wave B: partial recovery
Wave C: deeper move likely toward the 1.07680 support (blue horizontal line)
⚠️ Bearish RSI Divergence:
The label "Div" confirms bearish divergence between price and RSI → typical at end of Wave (5).
🧠 Summary:
Structure: 5-wave impulse + projected 3-wave correction
Bias: Short-term bearish targeting 1.07680
Confirmation: Look for break below support or trendline + momentum shift

EUR/USD timw to rebalance priceEUR/USD extended one side for long now , was huge buy pressure ,but it cant go forever one side, country economics would colapse. on this idea we have head and shoulders pattern on 1h time frame,plus extra confirmation of another low structure formed. now we wait to double tops get swept and we could look for short entrys , should be nice runnere to the short side

EURUSD SellEurusd major intraday structure is bullish but internal structure is bearish and should continue for the pullback. Asia session, price took out a high and had 'bos' to the downside in smaller timeframes and price came back to mitigate a 'POI'.

EURUSD and GBPUSD Analysis todayHello traders, this is a complete multiple timeframe analysis of this pair. We see could find significant trading opportunities as per analysis upon price action confirmation we may take this trade. Smash the like button if you find value in this analysis and drop a comment if you have any questions or let me know which pair to cover in my next analysis.

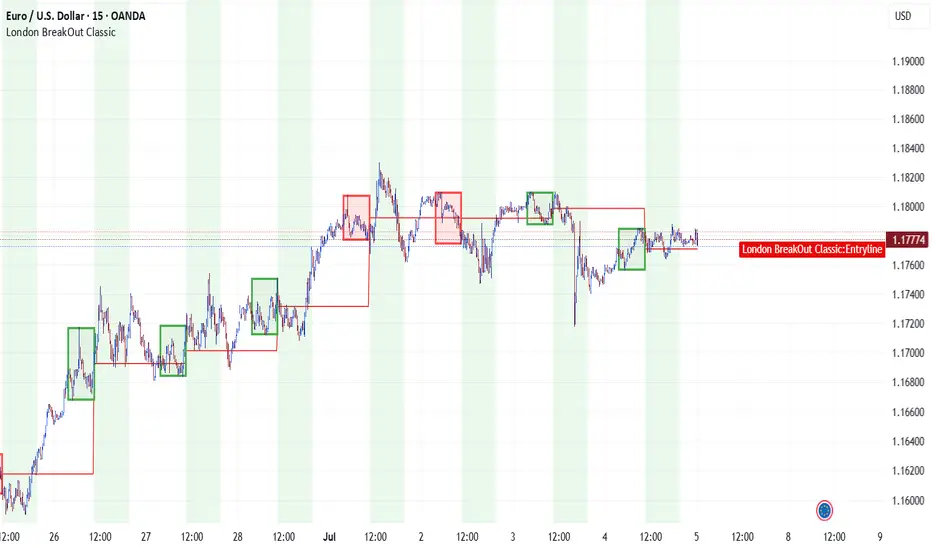
bull eurusdKey elements:
Trade signal: BUY entry at 1.17721 with target 1.17824
Strategy: "London BreakOut Classic"
Price levels: 15 key USD levels from 1.26000 (highest) to 1.00400 (lowest)
Current price: 1.17721 (highlighted in the list)
Need analysis or explanations? Let me know! 💹
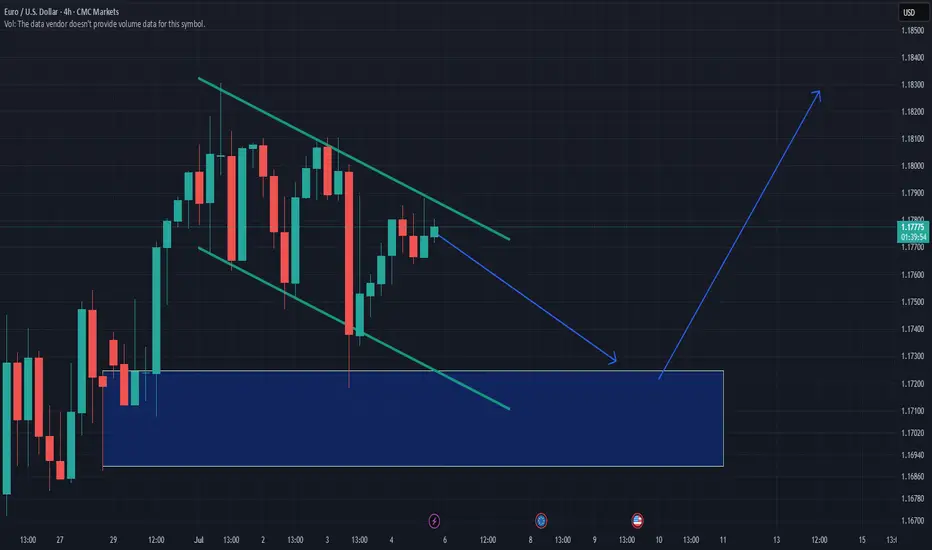
EURUSD OUTLOOK 8 - 11 JULYNFP and unemployment rate came out bullish for the dollar which caused that big push to the down side. The job market is still holding well thus we are less likely to see the FED cut rates.
Other economic data is still showing that the dollar is weaker against the euro so I'm not going to change my direction bias just yet. Technical analysis also clearly shows that we are still bullish on EURUSD.
We don't have much fundamental data coming out this week so I'm anticipating price to continue lower to give a deeper pullback off of last weeks data, Then next week depending how CPI, PPI and Retails sales go we will get a clearer picture on how to trade the pair.
Last week's 4H outlook is still valid and is more useful when looking to execute trades. This daily Analysis just gives the bigger picture for more of a swing setup analysis

EUR/USD: A Perfect Storm for BullsThis is a high-conviction long setup based on a powerful combination of macroeconomic divergence and a confirmed multi-year technical breakout.
The Non-Farm Payrolls report has now been released, and the resulting price dip has created what I believe is an ideal entry opportunity to align with the dominant bullish trend.
The Fundamental Why 📰
NFP Aftermath: Yesterday's NFP report was a mixed bag that ultimately reinforces the case for Fed rate cuts. The headline number beat expectations, causing an initial USD rally and a dip in EUR/USD. However, the underlying details like wage growth were soft. Crucially, the market continues to price in a 96% probability of a Fed rate cut by September, a figure that was unchanged by the data. The core driver of USD weakness—a dovish Fed—remains firmly intact.
Resilient EUR 🇪🇺: In contrast, the ECB has signaled it is at or near the end of its easing cycle. Economic data from core Eurozone countries is stabilizing, providing the Euro with relative strength.
Risk-On Sentiment 💹: The broader market remains in a "risk-on" mood, which is typically negative for the safe-haven USD. Gold is soaring and equities are near all-time highs, confirming the anti-dollar flow.
The Technical Picture 📊
The Secular Breakout 🚀: The most significant event is the breakout of a decade-long downtrend resistance line. This is a major structural shift. The pair has also achieved a monthly and quarterly close above the critical 1.1500 handle, turning a historic resistance level into a new support floor.
The Impulsive Uptrend 🌊: On the 4-hour chart, the price is in a clear ascending channel. The post-NFP dip represents a healthy correction within this uptrend, bringing price back toward key support.
Key Levels 🔑:
Support Zone: The dip has brought price directly into the key support confluence between 1.1700 and 1.1760, making this an ideal area to enter long.
Resistance Zone: Major resistance still sits at 1.1900, making it a prudent take-profit target.
Strategy & Risk Management 🧠
The stronger-than-expected NFP headline has provided the exact pullback this strategy was designed for. The dip presents a prime opportunity to buy into the dominant uptrend at a more favorable price. Instead of chasing the market, we are now positioned to enter on a technically sound correction.
Good luck, and trade safe!
Trade Parameters ✅
Pair: EUR/USD
Direction: Long / Buy 🟢
Entry Type: Limit Order
Entry Price: 1.1745
Stop-Loss: 1.1685 (60 pips) 🔴
Take-Profit: 1.1895 (150 pips) 🎯
Risk/Reward Ratio: 2.5 : 1

Mastering Risk Management: The Trader’s Real EdgeYou’ve all heard it,
“Cut your losses and let your winners run.”
Simple words — but living by them is what separates survivors from blown accounts.
Here’s some tips on how to approach risk management when trading:
☑️ Risk is always predefined: Before I click Buy or Sell, I know exactly how much I’m willing to lose. If you don’t define risk upfront, the market will do it for you.
☑️ Position sizing: Never risk more than 1–2% of your account per trade. Small losses mean you can keep taking high‑probability setups without fear.
☑️ Always use a stop‑loss: No stop? You’re not trading — you’re gambling.
☑️ Stop‑loss discipline: Place stops where the market proves you wrong — not where it “feels comfortable.” Then leave them alone.
☑️ Focus on risk/reward, not win rate: A 40% win rate can still be profitable if your average reward outweighs your risk.
☑️ Risk/reward ratio: Only take trades with at least a 2:1 or 3:1 potential. You don’t need to win every trade — your winners should pay for your losers (and more).
Remember:
“It’s not about being right all the time. It’s about not losing big when you’re wrong.”
Risk management won’t make your trades perfect — but it will keep you trading tomorrow.
And in this game, staying in the game is everything.
💭 How do you handle risk in your trading? Drop your strategy or tip in the comments — let’s share and learn together! 👇
Thanks again for all the likes/boosts, we appreciate the support!
All the best for a good week ahead. Trade safe.
BluetonaFX

Sell EURUSDEURUSD has been in an uptrend, but after breaking the trendline on the 1-hour chart and entering a descending channel, I expect the price to reject at the channel's resistance and resume its downtrend.

EURUSD Return to Order Block, AscendWould not be surprised to see early next week a small return to this order block before next rally.
EURUSDEURUSD
30m Time Frame Bullish setup, Candle Stick Pattern
Move SL To Entry once reach first target.

EURUSD Under Pressure – Bearish Setup Builds Near Key ResistanceThe EURUSD pair is currently moving within a clearly defined downward price channel, with price action consistently respecting both the upper and lower boundaries over several recent sessions. This structure confirms that the bearish trend remains dominant.
At the moment, price is showing a mild technical rebound, but it has yet to break above the EMA 34 and 89, while a key resistance zone around 1.1740 is looming just above. If a reversal candlestick pattern forms at this level (such as a bearish engulfing or a pin bar), it could provide a high-probability entry for sellers, targeting a drop back to 1.1660 or potentially even the lower edge of the channel.
However, if price decisively breaks above the descending channel and holds above 1.1750, this entire bearish scenario would be invalidated — possibly triggering a deeper corrective rally and placing any short positions at risk.
In summary: The downtrend still holds the advantage — but this is a moment that demands clear confirmation.
Share your perspective — and don’t forget to manage your risk with discipline!

Eurusdearlier trade when wrong at wrong entry but the analysis were correct so i placed the trade again at 2 positions and targeting the Liquidity down side getting 20-30 pips

EURUSD(20250707) Today's AnalysisMarket news:
OPEC+ agreed to increase daily production by 548,000 barrels in August, further accelerating production increases.
Technical analysis:
Today's buying and selling boundaries:
1.1772
Support and resistance levels:
1.1807
1.1794
1.1786
1.1759
1.1751
1.1738
Trading strategy:
If the price breaks through 1.1786, consider buying, with the first target price of 1.1794
If the price breaks through 1.1772, consider selling, with the first target price of 1.1759
