EURUSD My Opinion! BUY!
My dear friends,
Please, find my technical outlook for EURUSD below:
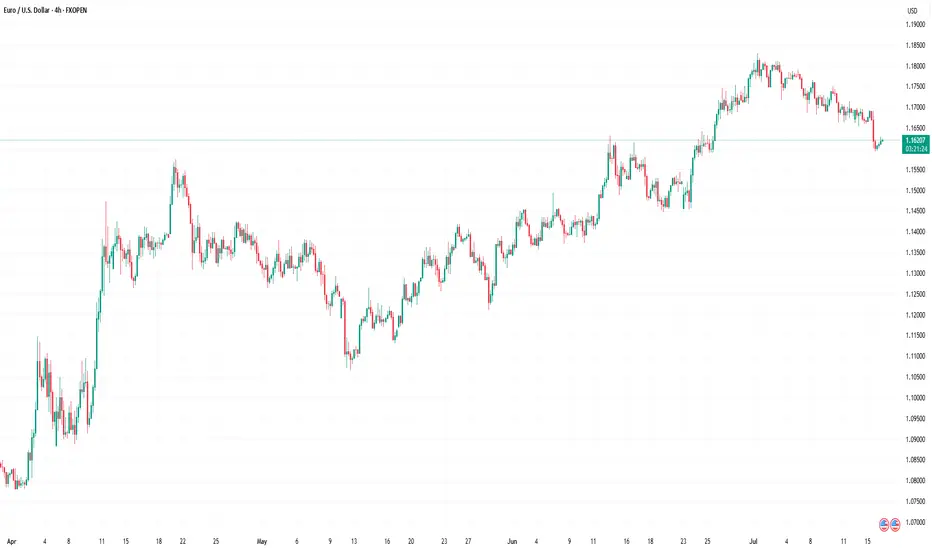
The price is coiling around a solid key level - 1.1584
Bias - Bullish
Technical Indicators: Pivot Points Low anticipates a potential price reversal.
Super trend shows a clear buy, giving a perfect indicators' convergence.
Goal - 1.1670
Safe Stop Loss - 1.1546
About Used Indicators:
The pivot point itself is simply the average of the high, low and closing prices from the previous trading day.
Disclosure: I am part of Trade Nation's Influencer program and receive a monthly fee for using their TradingView charts in my analysis.
———————————
WISH YOU ALL LUCK
USDEUR trade ideas
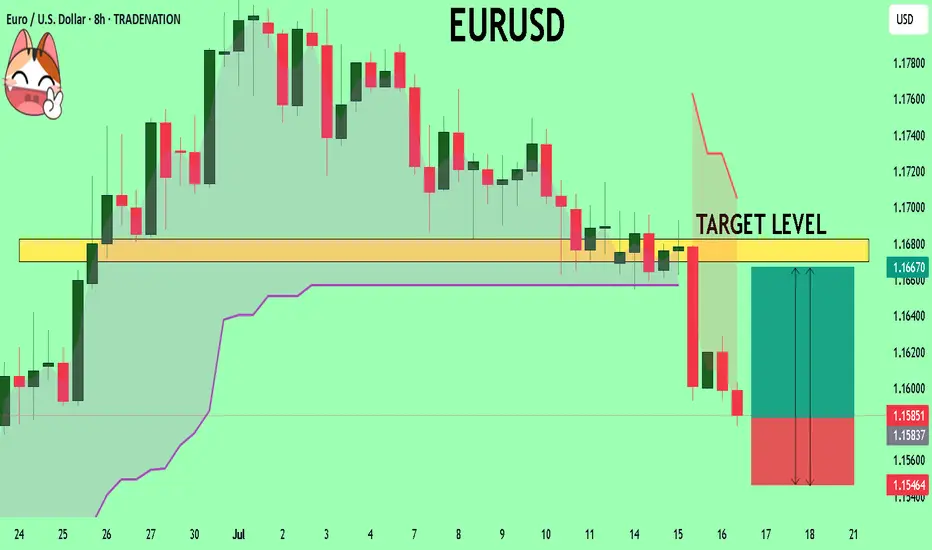
EUR/USD : Another Fall Ahead ? (READ THE CAPTION)By analyzing the EURUSD chart on the 4-hour timeframe, we can see that the price is currently breaking through the 1.16–1.158 zone. If it manages to hold below 1.159, we can expect further downside movement. The next targets for EURUSD are 1.15580, 1.154, and 1.148.
Please support me with your likes and comments to motivate me to share more analysis with you and share your opinion about the possible trend of this chart with me !
Best Regards , Arman Shaban
7.16 EUR/USD LIVE TRADE UPDATE DAY 3This market made a very nice down candle yesterday and then pulled back a little, currently it looks to be heading down again. We are looking for this market to make new lows on the current down momentum.

Sell eurusdStrong selling wave comes
Monthly weekly still overbought pair
Respecting our parallel channel and 1st selling area
Now daily strong buy trend breaks giving hints for sellers

EURusd short position 16/07/2025English : According to our analysis, we anticipate a bearish scenario.
Morocan Darija : kanchofo d'apres l'analyse dyalna antsanaw hboot
ATENTION : I only share my ideas, not signals

EUR/USD - Daily Chart (Wedge Breakout) (16.07.2025) The EUR/USD Pair on the D1 timeframe presents a Potential Selling Opportunity due to a recent Formation of a Wedge Pattern. This suggests a shift in momentum towards the downside in the coming Days.
Possible Short Trade:
Entry: Consider Entering A Short Position around Trendline Of The Pattern.
Target Levels:
1st Support – 1.0956
2nd Support – 1.0625
💡 Fundamental & Sentiment Context
Euro under pressure amid renewed concerns over EU‑US trade friction .
The USD is strengthening, supported by safe‑haven flows amid tariff uncertainties.
🎁 Please hit the like button and
🎁 Leave a comment to support for My Post !
Your likes and comments are incredibly motivating and will encourage me to share more analysis with you.
Best Regards, KABHI_TA_TRADING
Thank you.
Disclosure: I am part of Trade Nation's Influencer program and receive a monthly fee for using their TradingView charts in my analysis.

Euro Steady, EU Prepares $84B RetaliationEUR/USD hovered near 1.1670 in Tuesday’s Asian session as markets awaited US-EU trade updates. Despite Trump’s 30% tariff announcement on EU imports, he confirmed that negotiations with Brussels are ongoing ahead of the August 1 deadline. According to Bloomberg, the EU is ready to respond with proportional tariffs targeting $84B (€72B) worth of US goods, including Boeing jets, bourbon, cars, and machinery.
Resistance for the pair is at 1.1715, while support is at 1.1645.
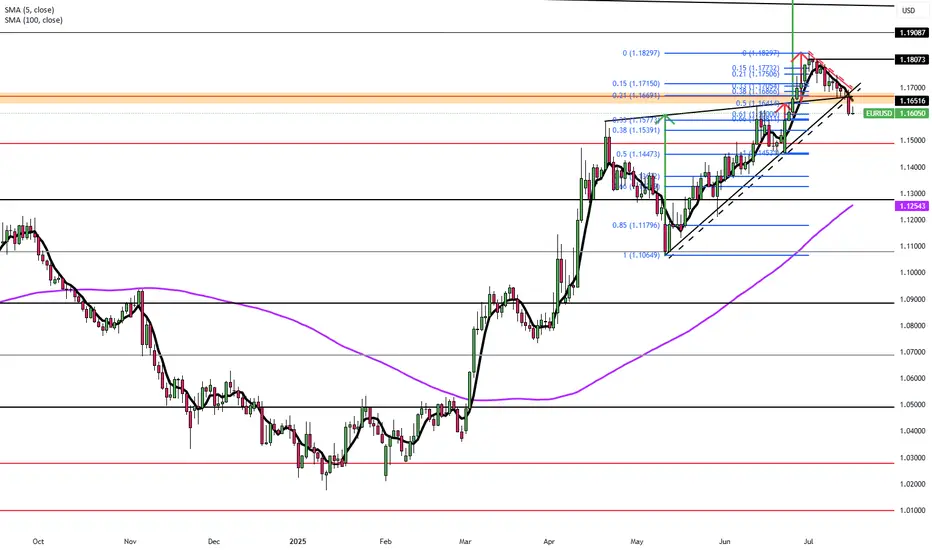
EURUSD Under Pressure as Macro Divergence WidensEURUSD is facing renewed downward pressure after rallying from 1.02 to 1.18 in a strong multi-month move. However, diverging inflation expectations between the EU and the U.S. are now weighing heavily on the pair.
One major signal comes from real yields. The Germany–U.S. 10-year real yield spread currently sits at -1.1182, the same level seen during the 2024 top near 1.11 and the 2023 top near 1.10. By that measure, EURUSD appears expensive. Over the past five years, 69% of EURUSD’s moves can be statistically explained by this real yield spread, making it a key macro indicator.
Inflation expectations are also diverging. The U.S. 5y5y inflation swap is trending upward, while the EU’s equivalent has remained flat. This suggests the Fed may keep rates elevated for longer than initially expected.
Beyond bond market dynamics, the August 1 tariff deadline is approaching with no deal in sight. In fact, tensions are rising, as the EU prepares possible countermeasures targeting $84 billion worth of U.S. goods. Adding to the pressure, political risk in France is building due to ongoing budget negotiations.
Technically, the recent break of both the uptrend (yellow) and the downtrend channel was significant. Euro bulls now need to reclaim and hold above 1.1660 to avoid deeper losses. If they fail, 1.1445 could become the next key support level, with further downside possible depending on how the news develops.
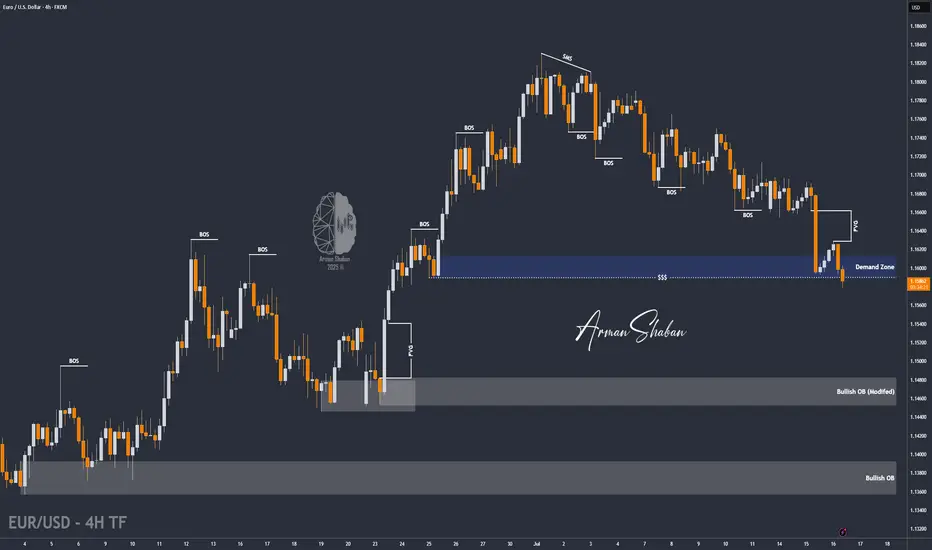
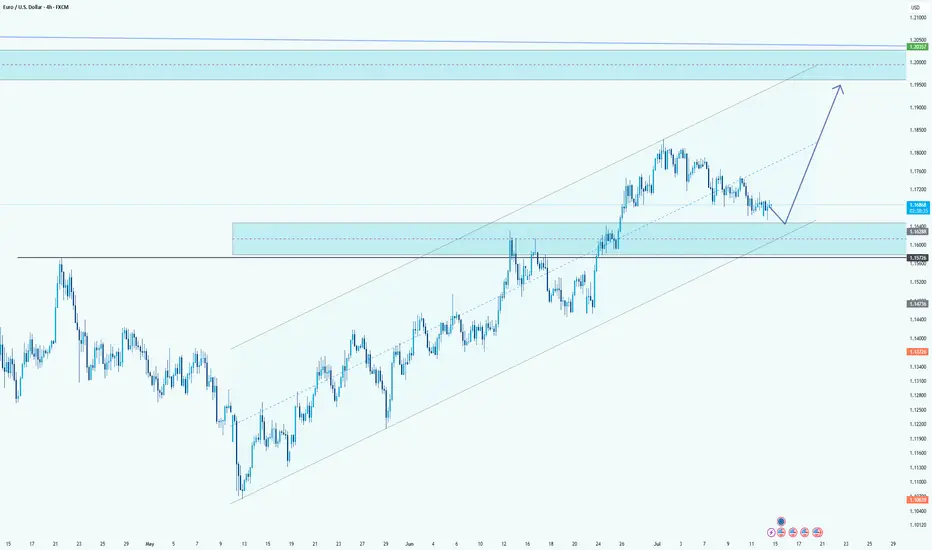
EUR/USD Retracement Into Demand ZoneHello guys!
EUR/USD is currently undergoing a healthy retracement after an extended bullish trend within the ascending channel. The price is now approaching a key demand zone, which aligns perfectly with the mid-line of the channel structure.
This zone previously acted as a strong resistance area and is now expected to serve as support, confirming a classic flip in market structure. The reaction around the 1.16288 - 1.15774 area will be crucial.
If buyers step in here, the bullish momentum is likely to resume with the next major target being the upper resistance zone near 1.20000 , as projected by the upward arrow. The overall structure remains bullish as long as the price holds above the channel support and doesn't close below the last demand zone.
EURUSD DAILY BISI EURUSD DAILY BISI
In LTF after engage then mss with proper OBI then our entry in bisi

EURUSD will continue to growIt is clear that EUR has broken through the support line, but I don't think the fall will continue. I expect growth to 1.19

EURUSD could see further downside potentialFundamental:
The euro slipped as mixed ECB signals and political jitters pressured sentiment. ECB President Lagarde reiterated that borrowing costs will remain restrictive 'as long as needed,' even as inflation eases and economic activity stabilizes.
Renewed political tensions in France and soft German industrial data also weighed on the euro, though stronger services PMIs offered a modest offset. At the same time, the dollar held firm after a hotter US CPI print reduced the likelihood of near-term Fed rate cuts, keeping EURUSD near a three-week low.
Technical:
EURUSD retreated below the resistance at 1.1800 and within the ascending channel. If the price extends its decline, it could approach the support at 1.1450. Conversely, a break above the resistance at 1.1800 could prompt a further rise toward the resistance at 1.1920.
By Li Xing Gan, Financial Markets Strategist Consultant to Exness

EURUSD SHORT SETUP4hour structure is extremely bearish creating series of lower lows and lower highs.
Couple with the fact that GBPUSD is also bearish, while DXY is bullish.
So, I expect price to move lower and break the major swing low below price.

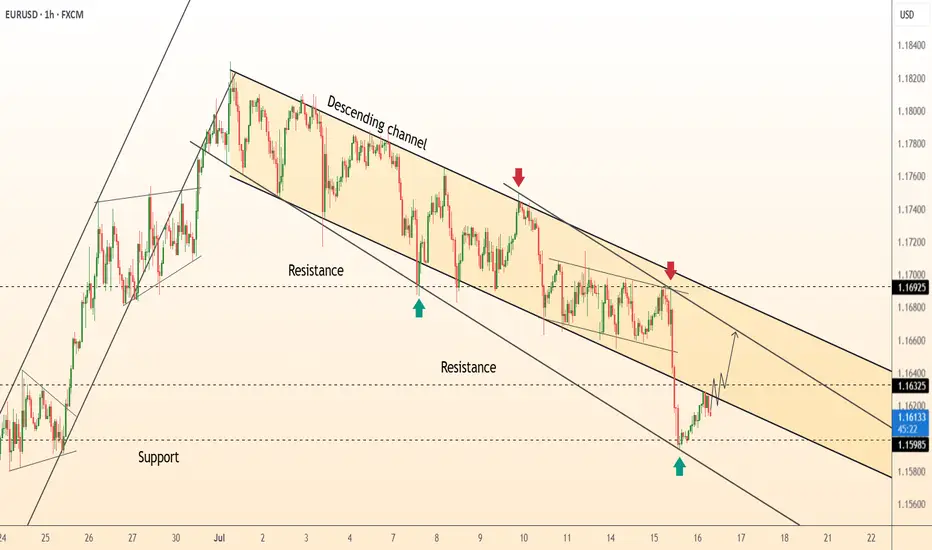
DeGRAM | EURUSD rebound from the trend line📊 Technical Analysis
● Price printed a hammer and bullish RSI divergence on the lower rail of the 3-week descending channel (green arrow 1.1598), breaking the inner wedge that guided last leg down.
● First resistance is the channel mid-line / prior pivot 1.1632; a move through it exposes the upper band near 1.1692, where July supply and the larger bearish trend-line converge.
💡 Fundamental Analysis
● Softer US retail-sales control-group and Daly’s “more evidence needed” remarks cooled 2-yr yields, trimming dollar support, while ECB’s Knot said additional cuts “are not imminent,” limiting euro downside.
✨ Summary
Long 1.1600-1.1620; hold above 1.1632 targets 1.1690. Long view void on an H1 close below 1.1580.
-------------------
Share your opinion in the comments and support the idea with a like. Thanks for your support!
EURUSD Will Go Down! Short!
Take a look at our analysis for EURUSD.
Time Frame: 15m
Current Trend: Bearish
Sentiment: Overbought (based on 7-period RSI)
Forecast: Bearish
The market is testing a major horizontal structure 1.161.
Taking into consideration the structure & trend analysis, I believe that the market will reach 1.159 level soon.
P.S
Please, note that an oversold/overbought condition can last for a long time, and therefore being oversold/overbought doesn't mean a price rally will come soon, or at all.
Disclosure: I am part of Trade Nation's Influencer program and receive a monthly fee for using their TradingView charts in my analysis.
Like and subscribe and comment my ideas if you enjoy them!

DeGRAM | EURUSD fixed under the resistance level📊 Technical Analysis
● Price is stalling against the upper band of a three-month rising channel (≈ 1.1790) after producing a false break and quick rejection—marking a potential bull-trap at trend resistance.
● Bearish divergence on the 4 h RSI and the first lower-high inside a micro rising wedge suggest momentum is fading; a slide through 1.1745 should trigger profit-taking toward the mid-channel support at 1.1595.
💡 Fundamental Analysis
● Solid US payrolls and a hawkish tone in FOMC minutes lift two-year yields, reviving the dollar bid, while post-election coalition wrangling in France keeps a risk premium on the euro.
✨ Summary
Sell 1.1785 ± 15 pips; break below 1.1745 targets 1.1595. Invalidate on a 4 h close above 1.1810.
-------------------
Share your opinion in the comments and support the idea with a like. Thanks for your support!

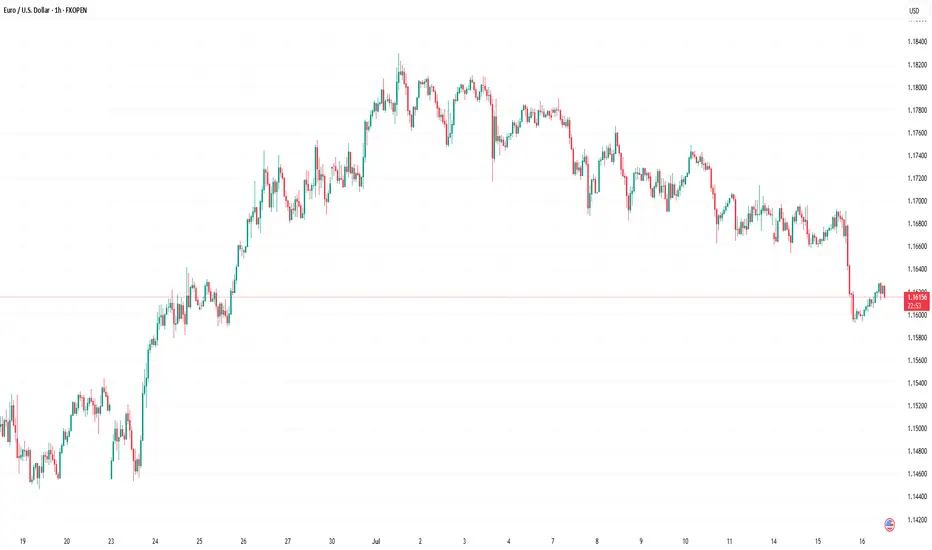
Market Analysis: EUR/USD Pares GainsMarket Analysis: EUR/USD Pares Gains
EUR/USD declined from the 1.1750 resistance and traded below 1.1650.
Important Takeaways for EUR/USD Analysis Today
- The Euro started a fresh decline after a strong surge above the 1.1720 zone.
- There is a connecting bearish trend line forming with resistance at 1.1660 on the hourly chart of EUR/USD at FXOpen.
EUR/USD Technical Analysis
On the hourly chart of EUR/USD at FXOpen, the pair rallied above the 1.1720 resistance zone before the bears appeared, as discussed in the previous analysis. The Euro started a fresh decline and traded below the 1.1660 support zone against the US Dollar.
The pair declined below 1.1620 and tested 1.1590. A low was formed near 1.1592 and the pair started a consolidation phase. There was a minor recovery wave above the 1.1610 level.
EUR/USD is now trading below the 50-hour simple moving average. On the upside, it is now facing resistance near the 1.1630 level. It is close to the 23.6% Fib retracement level of the downward move from the 1.1749 swing high to the 1.1592 low.
The next key resistance is at 1.1660 and the 50% Fib retracement level. There is also a connecting bearish trend line forming with resistance at 1.1660.
The main resistance is near the 1.1690 level. A clear move above it could send the pair toward the 1.1720 resistance. An upside break above 1.1720 could set the pace for another increase. In the stated case, the pair might rise toward 1.1750.
If not, the pair might resume its decline. The first major support on the EUR/USD chart is near 1.1590. The next key support is at 1.1550. If there is a downside break below 1.1550, the pair could drop toward 1.1520. The next support is near 1.1485, below which the pair could start a major decline.
This article represents the opinion of the Companies operating under the FXOpen brand only. It is not to be construed as an offer, solicitation, or recommendation with respect to products and services provided by the Companies operating under the FXOpen brand, nor is it to be considered financial advice.
Strong sell eurusdWeekly and monthly overbought pair
Daily buy trend almost break
Straight selling expected till our weekly sell target , now no chances for buyers

EUR/USD : US Dollar Strengthens Following Inflation ReportEUR/USD Analysis: US Dollar Strengthens Following Inflation Report
Yesterday, the US Consumer Price Index (CPI) report was released, showing an increase in consumer prices. According to Forex Factory, annual CPI rose from 2.4% to 2.7%, exceeding analysts' expectations of a 2.6% rise.
As reported by Reuters, the data supports the stance of Federal Reserve Chair Jerome Powell, who has repeatedly stated that the anticipated inflationary pressure—driven in part by tariffs—is a reason to refrain from further interest rate cuts.
However, President Donald Trump interpreted the data differently. On his Truth Social platform, he posted that consumer prices remain low and called for an immediate rate cut.
The market responded with a stronger US dollar—indicating that participants believe interest rates are likely to remain at current levels in the near term. Notably, the EUR/USD exchange rate fell to the 1.1600 level for the first time since late June (as indicated by the arrow).
Technical Analysis of the EUR/USD Chart
Analysing the EUR/USD chart as of 7 July, we identified:
→ A long-term ascending channel
→ A potential downward trajectory (marked by red lines)
Since then, the pair has followed the outlined path and declined by more than 1%.
It is worth noting that today, the EUR/USD price is near the lower boundary of a key trend channel, which may offer significant support — traders may look for a technical rebound from this level.
Additionally, attention should be paid to the upcoming release of the US Producer Price Index (PPI) at 15:30 GMT+3. These figures carry particular weight in light of potential renewed inflationary pressures. This and other upcoming data may prove decisive for the near-term direction of EUR/USD.
This article represents the opinion of the Companies operating under the FXOpen brand only. It is not to be construed as an offer, solicitation, or recommendation with respect to products and services provided by the Companies operating under the FXOpen brand, nor is it to be considered financial advice.

EURUSD: Deeper Pullback Before Bullish MoveHello Traders,
On EURUSD, we opened the new week with a significant downside gap, which has already been filled during the Asian session. Price has reacted from that gap area, and heading into the London session, I’m expecting a deeper pullback into the daily demand zone before the bullish continuation.

check the trendConsidering the price behavior in the current support area, possible scenarios have been identified. It is expected that a trend change will form in the current support area and we will see the start of an upward trend.
If the price passes the support area, the continuation of the downward trend will be likely.

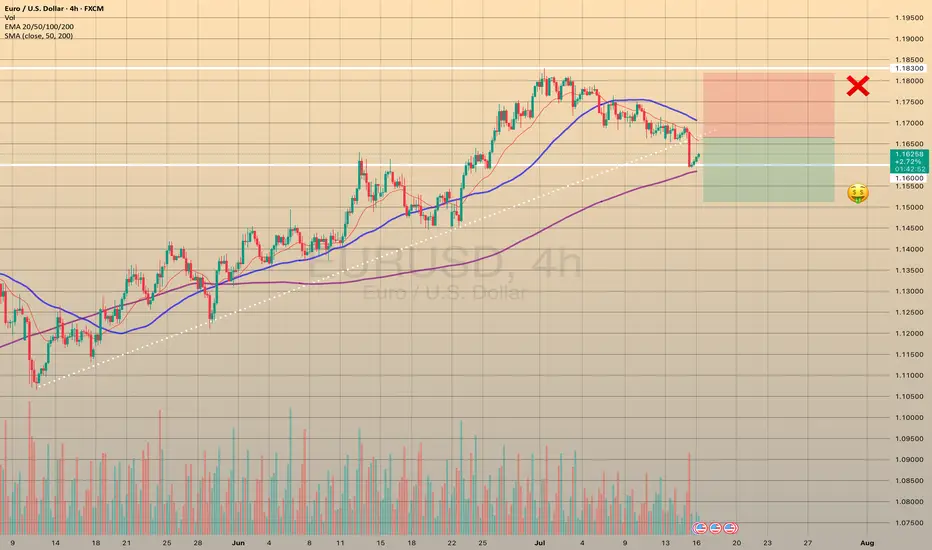
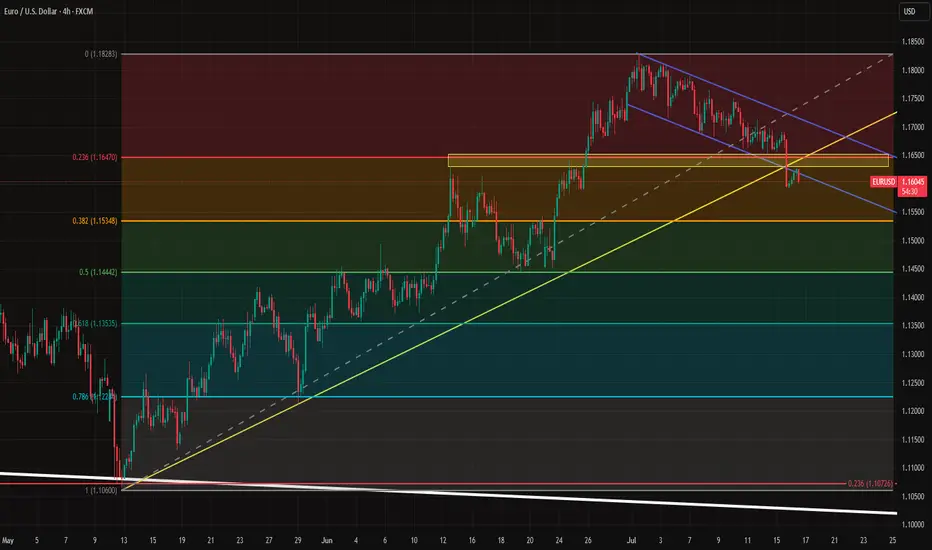
EURUSD TRIGGERED STOP LOSSTRADING IDEA UPDATE - EURUSD TRIGGERED STOP LOSS
The U.S. CPI report data came out right what the market expected (2.7% vs. 2.7% annually). After this report the pair went downwards on increased volume, triggering my stop loss and found the support only on 4-h sma200 and 1.16000 level.
What will be the possible scenario next?
I assume that the asset will go testing the trendline at 1.16650. If the test is successful, I will consider opening a
🔽 a pending sell stop order at 1.16651 with
❌a stop loss at 1.18180 and
🤑a take profit at 1.15122
Only if the retest is successful, not earlier! Let's observe first. Additionally, today is the U.S. PPI report coming out at 12:30 p.m. UTC, so got to be careful around this time