USDEUR trade ideas

EURUSD: Deeper Pullback Before Bullish MoveHello Traders,
On EURUSD, we opened the new week with a significant downside gap, which has already been filled during the Asian session. Price has reacted from that gap area, and heading into the London session, I’m expecting a deeper pullback into the daily demand zone before the bullish continuation.

check the trendConsidering the price behavior in the current support area, possible scenarios have been identified. It is expected that a trend change will form in the current support area and we will see the start of an upward trend.
If the price passes the support area, the continuation of the downward trend will be likely.

EURUSD TRIGGERED STOP LOSSTRADING IDEA UPDATE - EURUSD TRIGGERED STOP LOSS
The U.S. CPI report data came out right what the market expected (2.7% vs. 2.7% annually). After this report the pair went downwards on increased volume, triggering my stop loss and found the support only on 4-h sma200 and 1.16000 level.
What will be the possible scenario next?
I assume that the asset will go testing the trendline at 1.16650. If the test is successful, I will consider opening a
🔽 a pending sell stop order at 1.16651 with
❌a stop loss at 1.18180 and
🤑a take profit at 1.15122
Only if the retest is successful, not earlier! Let's observe first. Additionally, today is the U.S. PPI report coming out at 12:30 p.m. UTC, so got to be careful around this time
July 15 2025 -Sell Limit ActivatedGood day, folks!
Just sharing another learning from my ideas here:
EURUSD has been in a bearish structure since July 14, 2025 (1H Intraday). As you know, I always look for clear supply or demand validation before placing a sell or buy limit order. On the chart, you can see a valid supply zone that was generated on Monday. After that, I waited for a clear move during the Tuesday London and New York sessions, with the CPI news release acting as a catalyst for more volatility. The trade came to fruition during the New York session on Tuesday. (See chart for the complete breakdown of the movement and entry.)
RR: 1:3
Another Wyckoff schematics and structure analysis.

Expecting an upward move for EURUSD After the EURUSD decline, we expect EURUSD to move higher from this range and see an upward leg. Now there are two scenarios! The first scenario is that the price goes up without a direct correction, and the second scenario is that the price first makes a small correction and gives us more confirmation to enter BUY.

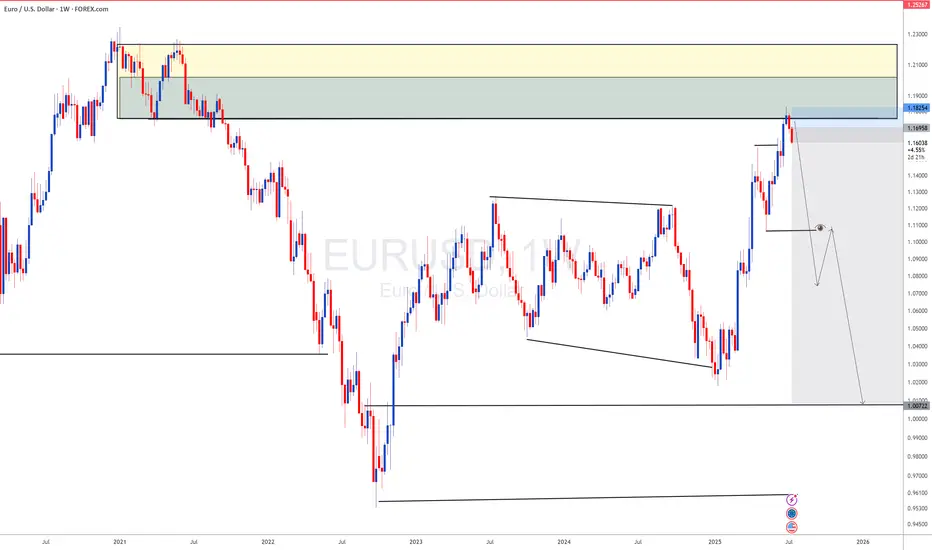
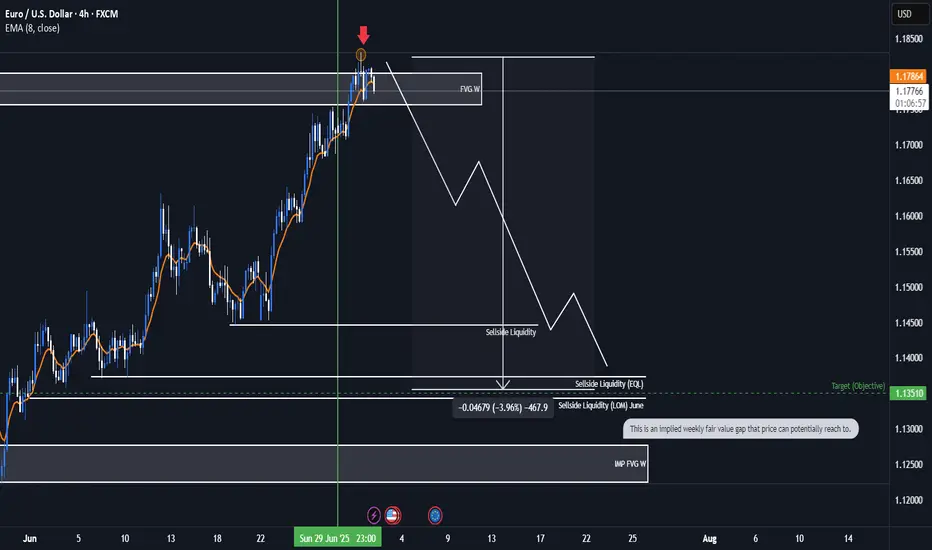
EURUSD Bearish ideaWe are in a weekly fair value gap that we have balance and potentially collected orders to prepare for a potential drop in price. We are anticipating a quarterly shift for the month of July were we could be targeting downside liquidity that is in open float.
* Fundamentals:
-Interest rate differentials shows us that USD interest rate of 4.5 is higher than the interest rate EUR 2.15 which lead to the longer fundamental frame work of price correcting to the higher dollar rate to the euro.
-The COT report also indicates to us that there is huge buying of Dollar by the commercials and a huge amount of selling of the EUR by commercials which can lead us to assume potential weaker dollar.
*Targeting:
-We are looking for the low of last month (June) to be taken out as well as even potentially reaching to the implied weekly fair value gap.
EURUSDU - market structure EURUSDU - market structure , use your own risk and trade managmnet and your own decision
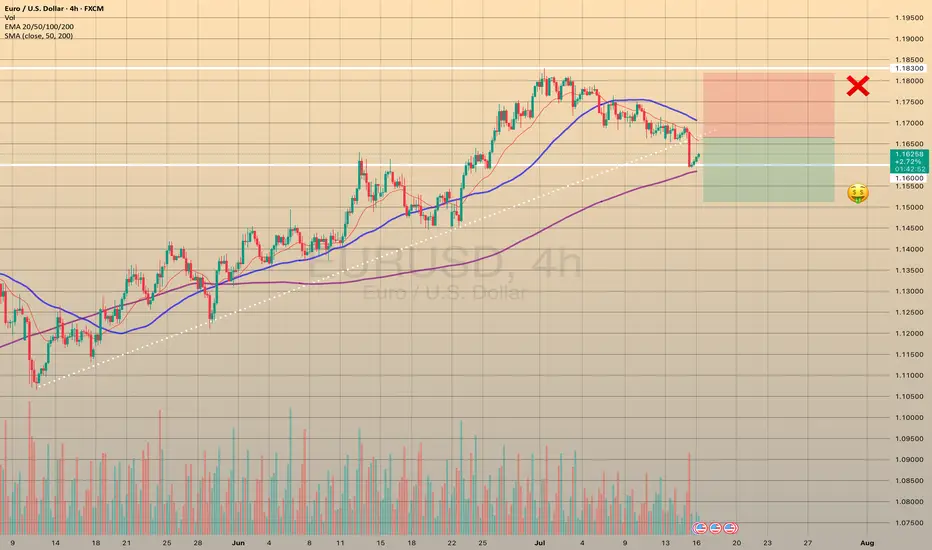
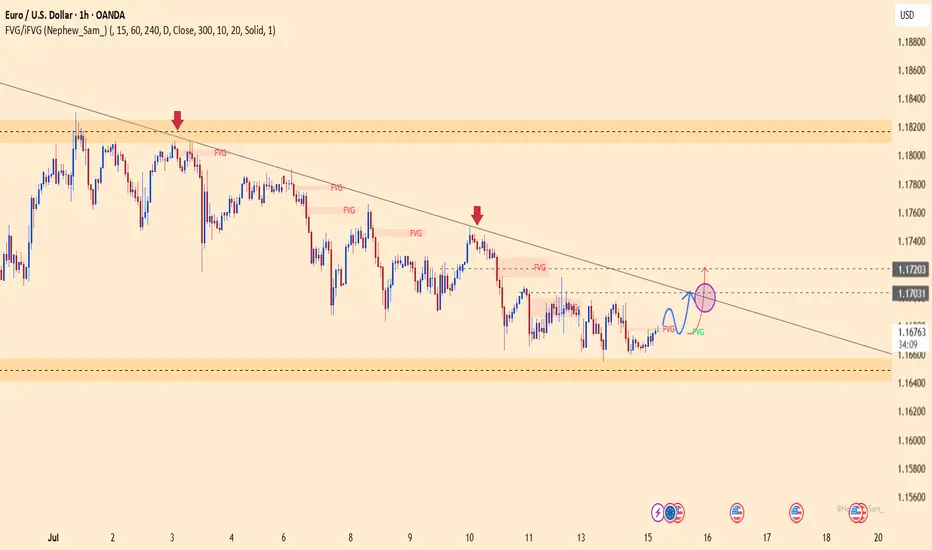
Eyes on 1.16300: EUR/USD Prepares for the Next Move.📉 EUR/USD Technical 📈
The pair has broken a strong support level and is now finding footing around 1.15970, forming a fresh bullish Fair Value Gap (FVG) at this zone.
At the moment, EUR/USD is moving within a bearish FVG. Here's what to watch next:
🔻 If the market dips from here, we could see a reversal from the lower edge of this FVG.
🔼 But if it holds and pushes higher, breaking above 1.16300 — the CE (Continuity Equation) level of the bearish FVG — that could unlock further bullish momentum.
🚨 Key Levels to Watch:
Support: 1.15970
Resistance/Breakout Zone: 1.16300
📊 Stay alert — price action at these levels could define the next move.
👉 DYOR – Do Your Own Research
📌 Not financial advice.

EURUSD at Daily Demand After CPI – Bullish Setup in PlayHello Traders,
I hope everyone is having a fantastic week!
Today on EURUSD, price is trading within the daily flip demand zone following yesterday’s USD CPI news release. While I usually avoid trading during CPI events due to the high volatility and unpredictable price spikes—often driven by algorithms and emotional retail reactions—yesterday did present a valid short opportunity.
Now that price is back in the daily demand zone, a bullish setup using lower time frame (LTF) confirmation offers a high-probability trade. We could see a decent push up toward the nearby daily supply zone.

CONTINUATION OF BEARISH TREND EUR/USD continuaring bearish, just going up to the the imbalance created yesterday during CPI, we expect it to hit the horizontal line as shown in the image, we expect a redistribution then another short entry, a the US dollar index gains strength

Eurousd techinical analysis.This chart of EUR/USD (Euro / U.S. Dollar) on the 3-hour timeframe includes several technical elements:
Key Elements Identified:
1. Descending Channel (Blue & Red Area):
Price was moving within a descending trend channel, indicating a bearish trend.
2. Breakout Above Trend Line:
The price has broken out of the descending trend line ("Trande line" — which is likely a typo for "Trend line"), suggesting potential bullish reversal.
3. FVG (Fair Value Gap):
This marks an imbalance in price action where the price moved too rapidly, often leading to a retracement or revisit. It could be used as a liquidity target for price to fill.
4. O.B (Order Block):
An order block represents a strong area of institutional buying/selling. Price appears to have reacted from this bullish order block, initiating the recent upward move.
5. Measurement Box (0.55% / 63.3 pips):
Indicates the expected or measured move from the O.B. to the FVG level.
6. Horizontal Support and Resistance Levels:
Marked in purple, showing recent consolidation or price reaction

EUR/USD 4-Hour Chart (OANDA)4-hour performance of the Euro/US Dollar (EUR/USD) currency pair on the OANDA platform as of July 10, 2025. The current exchange rate is 1.16920, reflecting a 0.25% decrease (-0.00298). The chart includes a candlestick representation with a highlighted resistance zone between 1.1692 and 1.17477, and a support zone around 1.16523. Buy and sell signals are marked at 1.16927 and 1.16912, respectively, with a spread of 1.5 pips.


EURUSD correction continuesYesterday, EURUSD reached 1,1590 following key news releases.
This doesn’t change the overall market direction or the type of setups we’re looking for.
The next key support level is at 1,1536.
Keep an eye out for a bounce and potential entry signals around that area.

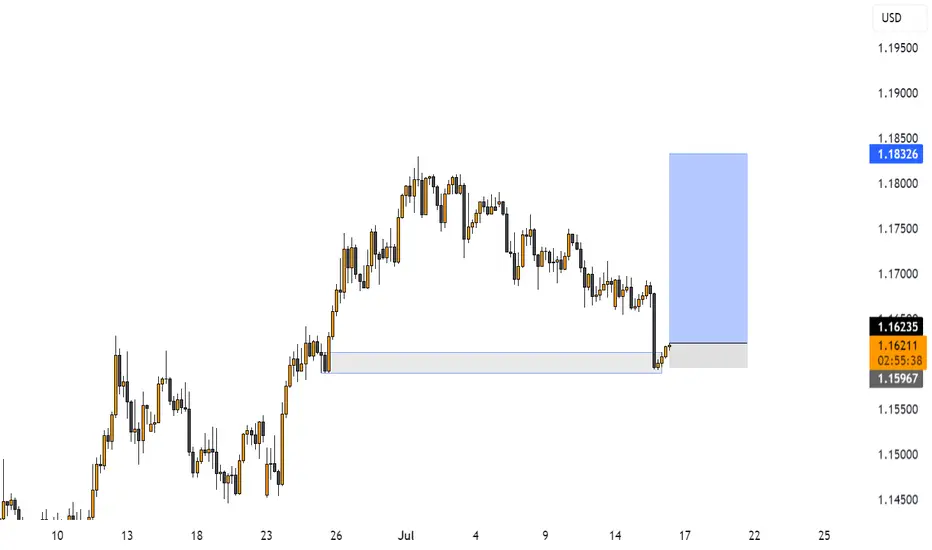
Potential Bearish Setup on EURUSDBearish Breakdown Setup
Summary
Analysing Price action from yesterday we have got a very nice distribution leg push that broke down below our accumulation zone a good indication of downside momentum, therefore the anticipation is that price will retest our BOS an ideal zone to look for bearish setups.
📉 EURUSD Daily Breakdown Potential setup
🔴 Distribution leg: 1.16921 - 1.15924
📉 Sell Below: 1.16540 (Confirmed Break)
🎯 Target 1: R:R 1:2
🎯 Target 2: R:R 1:3
🎯 Target 3: R:R 1:4
🛑 Stop Loss: Above Resistance Zone
🔍 Watch: Failure to break back in = Confirmation
LIKE or COMMENT if this idea sparks your interest, or share your thoughts below!
FOLLOW to keep up with fresh ideas.
Tidypips: "Keep It Clean, Trade Mean!"

EURUSD H1 I Bullish Rise Based on the H1 chart analysis, the price is approaching our buy entry level at 1.1603, a pullback support.
Our take profit is set at 1.1641, a pullback resistance that aligns with the 50% Fib retracement.
The stop loss is placed at 1.1579, an overlap support.
High Risk Investment Warning
Trading Forex/CFDs on margin carries a high level of risk and may not be suitable for all investors. Leverage can work against you.
Stratos Markets Limited (tradu.com ):
CFDs are complex instruments and come with a high risk of losing money rapidly due to leverage. 63% of retail investor accounts lose money when trading CFDs with this provider. You should consider whether you understand how CFDs work and whether you can afford to take the high risk of losing your money.
Stratos Europe Ltd (tradu.com ):
CFDs are complex instruments and come with a high risk of losing money rapidly due to leverage. 63% of retail investor accounts lose money when trading CFDs with this provider. You should consider whether you understand how CFDs work and whether you can afford to take the high risk of losing your money.
Stratos Global LLC (tradu.com ):
Losses can exceed deposits.
Please be advised that the information presented on TradingView is provided to Tradu (‘Company’, ‘we’) by a third-party provider (‘TFA Global Pte Ltd’). Please be reminded that you are solely responsible for the trading decisions on your account. There is a very high degree of risk involved in trading. Any information and/or content is intended entirely for research, educational and informational purposes only and does not constitute investment or consultation advice or investment strategy. The information is not tailored to the investment needs of any specific person and therefore does not involve a consideration of any of the investment objectives, financial situation or needs of any viewer that may receive it. Kindly also note that past performance is not a reliable indicator of future results. Actual results may differ materially from those anticipated in forward-looking or past performance statements. We assume no liability as to the accuracy or completeness of any of the information and/or content provided herein and the Company cannot be held responsible for any omission, mistake nor for any loss or damage including without limitation to any loss of profit which may arise from reliance on any information supplied by TFA Global Pte Ltd.
The speaker(s) is neither an employee, agent nor representative of Tradu and is therefore acting independently. The opinions given are their own, constitute general market commentary, and do not constitute the opinion or advice of Tradu or any form of personal or investment advice. Tradu neither endorses nor guarantees offerings of third-party speakers, nor is Tradu responsible for the content, veracity or opinions of third-party speakers, presenters or participants.

EURUSD : Status @ 15/7Direction: Sell
Signal triggered: 15/7/2025
Stop when:
a) Stop Loss @ 1.1700 ; or if
b) Buy signal triggered
Action:
Sell the rally
Good luck.

EURUSD – Bullish Momentum ReturnsEURUSD is gradually breaking free from downward pressure as it breaches the short-term accumulation structure, aiming for the resistance zone around 1.1720. On the chart, a clear bullish trend is emerging, supported by FVG signals reinforcing the recovery.
On the news front, expectations are rising that the European Central Bank will maintain a tighter policy stance for longer, as core inflation in the Eurozone remains elevated. Meanwhile, the USD is under corrective pressure following last week’s lower-than-expected U.S. CPI data. Upcoming statements from ECB and Fed officials today will be key in determining the next move for this currency pair.
Unless a surprise arises from the U.S. side, EURUSD is likely to sustain its short-term upward momentum and test the next technical resistance area.
EUR/USD long: Save the dateHello traders
I have entered into a long position at 1.1665.
The charts show a base being built right around that level.
DXY is ticking down but US 10Y yield is steady.
Bitcoin at an all time high is in my opinion not a sign of risk on but rather USD liquidation in favor of BTC.
Gold has just broken above the last daily high.
There are rumors making the rounds that FOMC Powell is considering resigning which will be negative for the USD. Keep in mind, Jerome Powell is the spokesperson for the FOMC, not the only voting member.
7/30/2025
FOMC rate decision
7/31/2025
The Federal Appeals Court starts hearing arguments for the use of IEEPA to impose sweeping tariffs that was declared unlawful by the Court of International Trade located in Manhattan, NY.
August 2025
More threatened tariffs may start.
Things are heating up.
Best of luck.

EUR USD SHORT RESULT Eur Price reached and fake out of the Major resistance range and I predicted a Bearish reversal and price moved according to our precision and TP Done ✅
_THE_KLASSIC_TRADER_.🔥

EURUSD as DXY s gaining momentum DXY has completed its long term downside now lets look for sell on EURUSD