EURUSD Wave Analysis – 15 July 2025- EURUSD broke daily up channel
- Likely to fall to support level 1.1470
EURUSD currency pair recently broke the support area located at the intersection of the support trendline of the daily up channel from May and the 38.2% Fibonacci correction of the upward impulse from June.
The breakout of this support area accelerated the active short-term ABC correction 4.
Given the strongly bullish US dollar sentiment coupled with significant euro pessimism seen today, EURUSD currency pair can be expected to fall further to the next support level 1.1470 (low of former wave iv).
USDEUR trade ideas

EURUSD TRADE IDEA Eurusd is pulling back, but we're yet to be tapped into the trade. We wait for a pullback into our fib level for a continuation to the upside

EURUSD is Bearish After Breaking Regression ChannelHello Traders
In This Chart EURUSD HOURLY Forex Forecast By FOREX PLANET
today EURUSD analysis 👆
🟢This Chart includes_ (EURUSD market update)
🟢What is The Next Opportunity on EURUSD Market
🟢how to Enter to the Valid Entry With Assurance Profit
This CHART is For Trader's that Want to Improve Their Technical Analysis Skills and Their Trading By Understanding How To Analyze The Market Using Multiple Timeframes and Understanding The Bigger Picture on the Charts

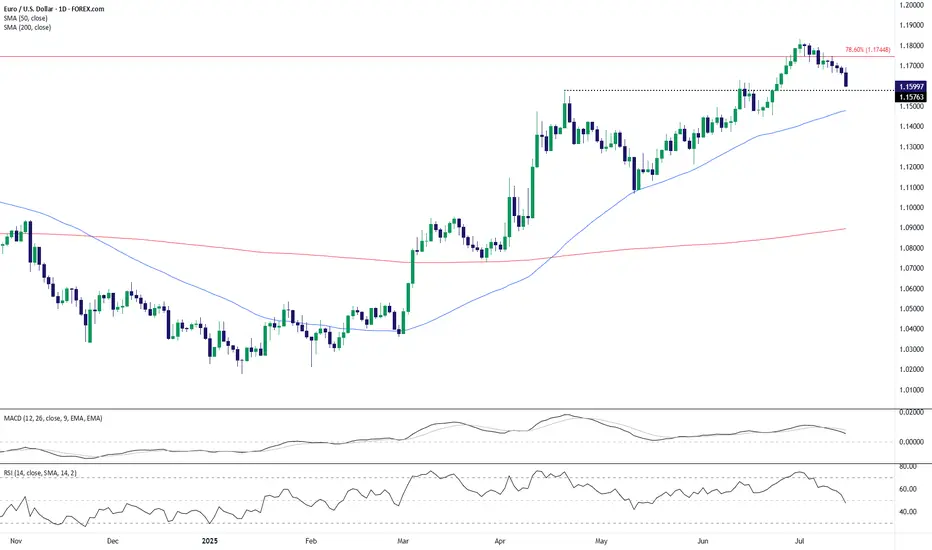
EUR/USD Technical Outlook: Bearish Momentum Builds Below Key ResEUR/USD has broken down from its recent highs near the 1.1750 resistance area, which coincides with the 78.6% Fibonacci retracement level. The pair is now trading around the 1.1600 handle, slipping below a short-term support zone near 1.1576. This breakdown signals potential continuation of bearish pressure in the coming sessions.
The 50-day SMA (1.1477) remains upward sloping, but the price action has now decisively turned lower, with a series of lower highs forming after the July peak. The MACD histogram is fading, indicating waning bullish momentum, and the RSI has dropped to 47.7—losing the bullish bias and heading toward bearish territory.
If EUR/USD cannot reclaim the 1.1576–1.1600 zone quickly, a deeper pullback toward the 50-day SMA or even the 1.1450–1.1500 range may unfold. On the upside, bulls would need to push back above the 1.1750 resistance to regain control, but given the loss of momentum and structure, the near-term bias favors the bears.
-MW
EUR/USD Fibonacci Resistance - Rising Wedge BreakEUR/USD came into Q3 with a full head of steam, setting a fresh three-year high on the first day of the new quarter. But bulls couldn't make much progress after that and a key Fibonacci retracement continued to hold buyers at bay, until eventually sellers were able to take-over and make a more noticeable dent after this morning's CPI data.
The breakout in USD helped to prod a breakdown in EUR/USD, and bears now have an open door to run a short-term trend. There's now resistance potential at prior support of 1.1631 and 1.1663, and there's deeper support potential at 1.1543 and 1.1457. - js

EURUSD📉 EURUSD – 30min Short Plan
📊 Structure: LLs & LHs forming – bearish trend confirmed
🕯️ Pattern: Bearish Engulfing at Lower High
🎯 Entry: instant
📌 Trade 1
– 🎯 TP1: 1:1
– ⚠️ Risk: 1%
📌 Trade 2
– 🎯 TP2: larger reward
🛠️ Execution:
– Place both trades at same entry
– Trail SL after TP1 hit
📎 Bias: Bearish

EURUSD: Bigger Bearish Move is PossibleEURUSD: Bigger Bearish Move is Possible
EURUSD is positioned to fall further from the bearish pattern it is showing. The market is hesitant to fall further after we get the CPI data today. The US is expected to report a growth of 2.7% vs. 2.4% last month.
The impact of the data is unclear in my opinion because the market is not paying much attention to the data, but it should definitely increase the market volume which is decreasing in these summer days.
You may find more details in the chart!
Thank you and Good Luck!
PS: Please support with a like or comment if you find this analysis useful for your trading day
Disclosure: I am part of Trade Nation's Influencer program and receive a monthly fee for using their TradingView charts in my analysis.
EURUSD Potentially BearishHi there,
EURUSD appears bearish at H1 and needs to break the dashed green trend line for a price target of 1.16511 for a bias of 1.16373.
Happy Trading
Not trading advice.

EURUSD Bearish this weekabout my analysis I think this week EURUSD is Bearish
But our Structure in HTF is Strongly Bullish

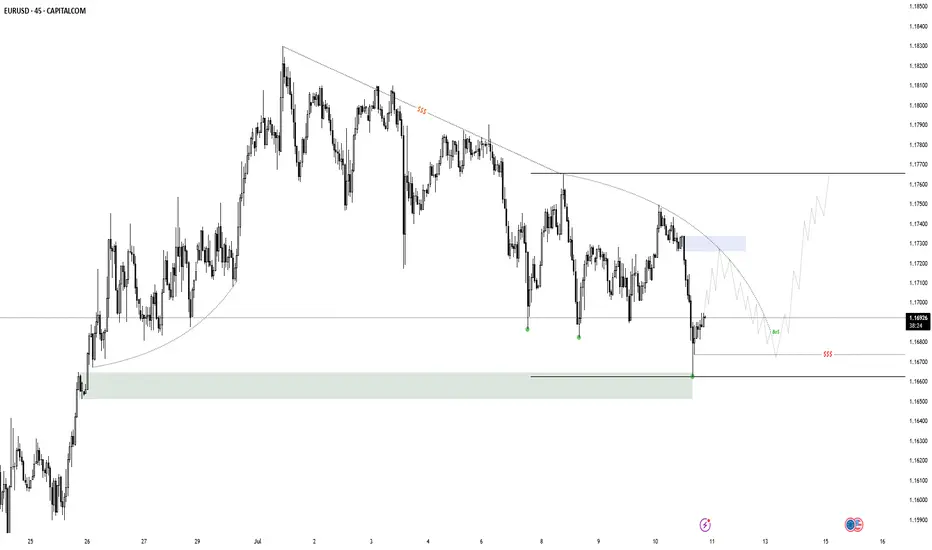
EURUSD: Consolidation Phase Nearing the Main Trend!!Hey Traders, in today's trading session we are monitoring EURUSD for a buying opportunity around 1.16100 zone, EURUSD is trading in an uptrend and currently is in a correction phase in which it is approaching the trend at 1.16100 support and resistance area.
Trade safe, Joe.
EURUSD OUTLOOK 15 - 18 JULYCore CPI m/m came in light which gave a mixed signal at first but CPI y/y was higher than expected which eventually moved EU lower.
The last two analysis that I posted were more longer term focused so this time I will be giving a more short term outlook.
Currently the dollar is stronger based on the recent news that has been coming out and because of that I am still looking to short this pair keeping in mind that it is only the internal structure that is bearish and the swing structure is still bullish

EURUSD AccumulationI am looking for some accumulation here. The model can already be complete, but i would only take it if it extends into a model 2 from extreme liquidity to create more liquidity for a reversal. The supply above, followed by the strong sell off lowers the quality of this model. A supply mitigation with a slow pullback into the POI would change that.
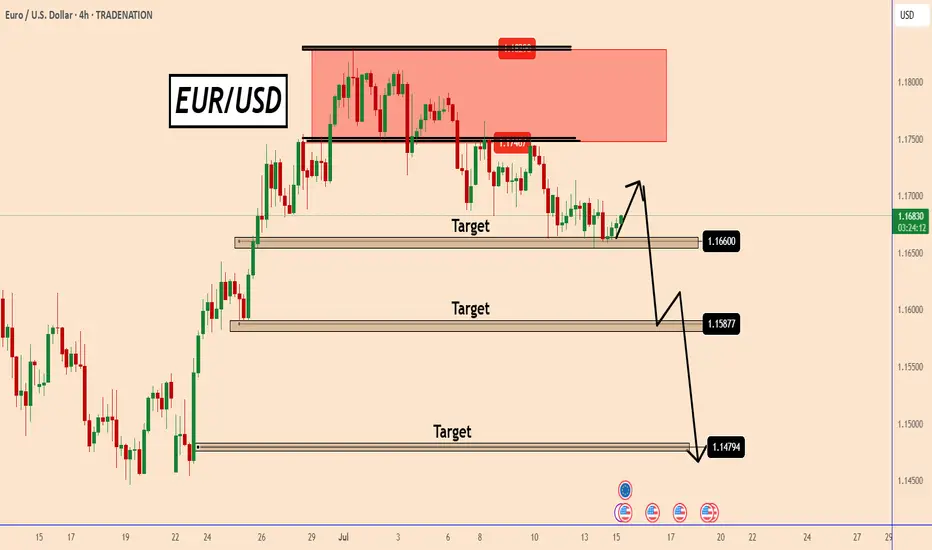
EURUSD BEARISH SETUP: 15 JULY 2025This is a 4-hour chart of the EUR/USD currency pair, and it includes several key technical elements:
---
🔍 Overall Market Context
The price is in a downtrend, clearly shown by the descending channel (highlighted with yellow lines).
The price just broke below the lower boundary of that channel, indicating potential bearish continuation.
The chart includes support/resistance levels, pivot points, and a projected path suggesting possible price behavior.
---
🔧 Key Technical Elements
1. Price Action & Structure
Recent price action shows a strong bearish move (large red candle), suggesting strong selling pressure.
The move bounced off S2, a weekly pivot support level, and entered a demand zone (green area).
2. Projected Scenario (Black Line Path)
A potential pullback to 1.16586 (key resistance).
If price fails to break above that resistance, it's expected to drop again.
Possible next supports:
1.15842
1.15228
Final target: 1.14550
3. Pivot Levels
Weekly Pivot: Near 1.17100 area (currently above the price — bearish implication).
S2 level: Around 1.15900 — presently acting as short-term support.
R1, R2, etc., are above and could act as resistance in a retracement.
---
📊 Summary of Trade Outlook
🔻 Bearish Bias (Short-Term to Medium-Term)
Main idea: This chart reflects a bearish breakout of a descending channel.
Entry Zones: After a potential pullback to resistance (1.16586)
Targets: 1.15842 → 1.15228 → 1.14550
Invalidation: A Bullish break above 1.16586 could invalidate the bearish setup.
---
✅ Trading Considerations
Wait for confirmation of rejection at 1.16129 or 1.16586 before shorting.
Watch for volume confirmation on the pullback.
Monitor fundamentals (e.g. ECB or Fed news) as they can drive sudden volatility.

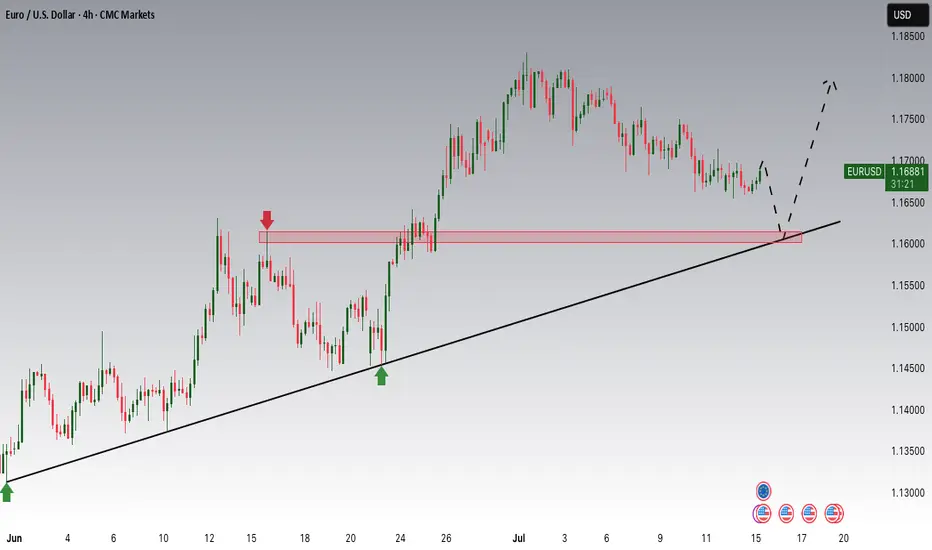
EUR_USD BEARISH BREAKOUT|SHORT|
✅EUR_USD was trading along
The rising support line but
Now we are seeing a strong bearish
Breakout and the breakout is
Confirmed so we are bearish
Biased and we will be expecting
A further bearish move down
After the potential pullback
SHORT🔥
✅Like and subscribe to never miss a new idea!✅
Disclosure: I am part of Trade Nation's Influencer program and receive a monthly fee for using their TradingView charts in my analysis.

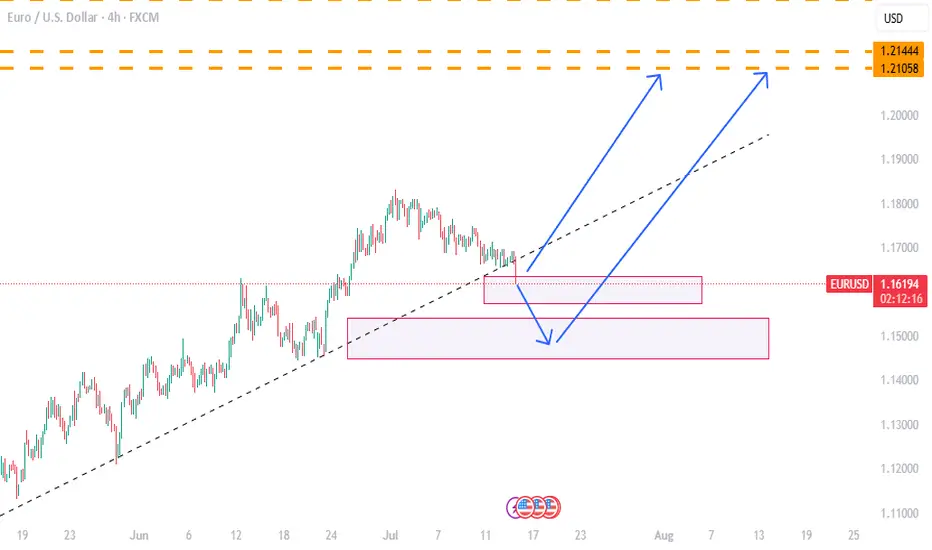
EURUSD Bullish Momentum EUR/USD is expected to resume its bullish trend after a brief consolidation. The market is likely to gain bullish momentum from the 1.17007 – 1.17507 support zone, potentially targeting the 1.20285 level in the next upward move

A case for a EURUSD ShortPrice got rejected at the U-MLH.
DXY shows some strenght too:
A close below yesterdays low is a short for me.

eur/usd 07.07The information and publications are not meant to be, and do not constitute, financial, investment, trading, or other types of advice or recommendations.
Have a nice evening ahead.

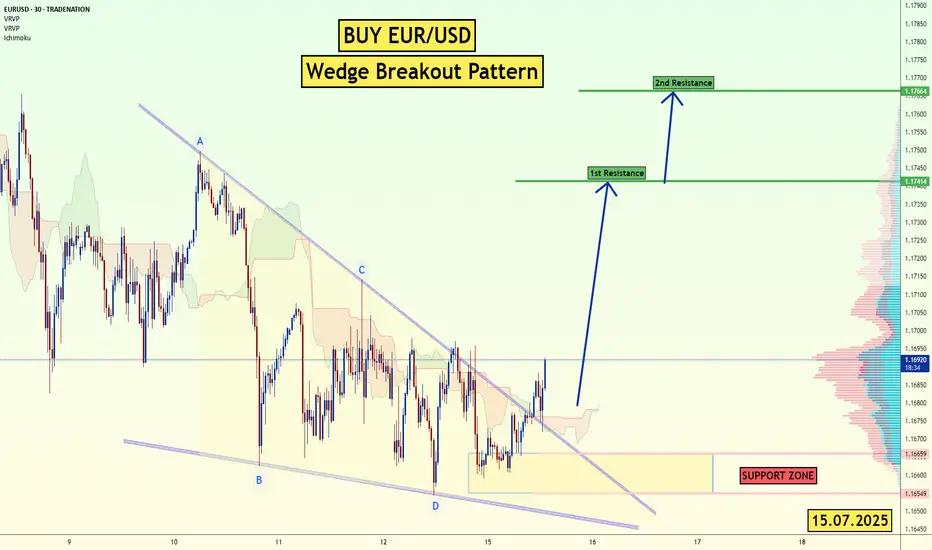
EUR/USD - Wedge Breakout (CPI- Today) 15.07.2025 The EUR/USD pair on the M30 timeframe presents a Potential Buying Opportunity due to a recent Formation of a Wedge Breakout Pattern. This suggests a shift in momentum towards the upside and a higher likelihood of further advances in the coming hours.
Possible Long Trade:
Entry: Consider Entering A Long Position around Trendline Of The Pattern.
Target Levels:
1st Resistance – 1.1741
2nd Resistance – 1.1766
🎁 Please hit the like button and
🎁 Leave a comment to support for My Post !
Your likes and comments are incredibly motivating and will encourage me to share more analysis with you.
Best Regards, KABHI_TA_TRADING
Thank you.
Disclosure: I am part of Trade Nation's Influencer program and receive a monthly fee for using their TradingView charts in my analysis.
EUR/USD Daily OB Analysis – ICT-Based SetupEUR/USD Daily OB Analysis – ICT-Based Setup
This is a clean ICT-style analysis of EUR/USD on the Daily timeframe.
A Daily Bullish Order Block (OB) has been identified in the Discount zone.
The OB ranges between two psychological levels:
1.15500 – Mid Figure
1.15000 – Big Figure (key liquidity level)
The market is currently approaching this OB, and the region is well aligned with the principles of PD Arrays (Premium/Discount Arrays) from ICT methodology.
The OB is considered valid as price action broke market structure (BOS) after the OB was formed, confirming institutional interest at that level.
We are now watching for potential bullish confirmation signals (MSS, SMT divergence, or bullish FVGs) on lower timeframes like H1 or M5 as price taps into the OB zone.
This setup offers a high-probability long opportunity, especially if price reacts from the 1.15000 big figure level with bullish price action.

EURUSD CONTINUATION UPSIDEI see 4H liquidity above, before it goes another high let the thing sweep first.
See entries below, always look for lower timeframe for entries at 15min-1min.
I only share more swing trades, so better capitalize it, I do swing too. GOODLUCK.
Don't be a 90% trader who gamble daily, try with swing. specially on my GOLD charts updates.
ciao.. keep winning fellas, you can also reach me on my X account. I do share too

EUR/USD drops post US CPI reportAfter gaining ground last week, the US dollar initially came under slight pressure earlier today. However, it regained momentum in the aftermath of a mixed US inflation report. Despite the nuanced inflation print, market expectations around interest rate policy remained largely unchanged. Investors continue to anticipate a slower pace of rate reductions, a sentiment that could further weigh on the EUR/USD pair—provided confidence in the Federal Reserve’s monetary approach remains intact.
Mixed Signals from US Inflation Data
The consumer price index for June presented a mixed picture. Headline CPI increased by 0.3% month-over-month and 2.7% year-over-year, surpassing both the previous 2.4% figure and the 2.6% forecast. However, core CPI (which excludes food and energy) showed a slightly softer reading, rising by only 0.2% month-on-month—below the expected 0.3%. The annual core rate stood at 2.9%, in line with expectations.
This mixed data has not allayed fears that inflation could remain sticky for longer. As a result, the Fed may hold off on aggressive rate cuts, although a possible move in September remains on the table.
Adding to the dollar’s bullish case, President Trump has proposed aggressive tariffs—35% on select Canadian goods and up to 30% on imports from Mexico and the EU—if no agreements are reached by August 1. These protectionist threats, combined with his expansive fiscal agenda, could drive inflation higher and bolster the dollar if market faith in US policy stays strong.
Euro Zone Data Shows Resilience, But the Euro Falters
Despite some encouraging macroeconomic indicators from the Eurozone, the euro slipped. Germany’s ZEW economic sentiment index rose to 52.7, outperforming both expectations (50.8) and the previous reading (47.5). Additionally, industrial production climbed 1.7% month-on-month, beating forecasts.
While these positive data points reflect a degree of resilience in the euro area, trade tensions are looming. The European Union has said it will retaliate on US products—ranging from aircraft to alcohol—should trade talks collapse or fail to yield agreements by the August 1 deadline.
Technical Outlook
Technically, EUR/USD breached the bullish trendline established since Q1, a development that bears are watching as the session wears on. Currently, the pair is testing a key support zone between 1.1570 and 1.1630—an area that served as resistance in both April and mid-June before the rally that followed.
Should prices fall decisively below this support today or in the coming days, the technical bias could shift bearish. On the upside, resistance lies at 1.1700 and 1.1750. A break above these levels would clear the way for bulls to target a fresh 2025 high above 1.1830.
By Fawad Razaqzada, market analyst with FOREX.com

analyse eurusd *The content on this analysis is subject to change at any time without notice, and is provided for the sole purpose of assisting traders to make independent investment decisions.
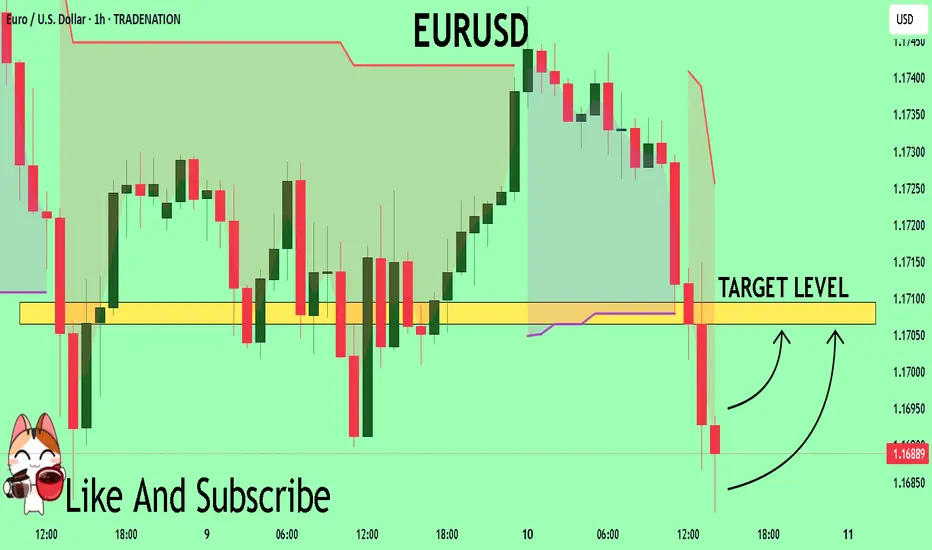
EURUSD Will Explode! BUY!
My dear followers,
I analysed this chart on EURUSD and concluded the following:
The market is trading on 1.1686 pivot level.
Bias - Bullish
Technical Indicators: Both Super Trend & Pivot HL indicate a highly probable Bullish continuation.
Target - 1.1706
About Used Indicators:
A super-trend indicator is plotted on either above or below the closing price to signal a buy or sell. The indicator changes color, based on whether or not you should be buying. If the super-trend indicator moves below the closing price, the indicator turns green, and it signals an entry point or points to buy.
Disclosure: I am part of Trade Nation's Influencer program and receive a monthly fee for using their TradingView charts in my analysis.
———————————
WISH YOU ALL LUCK