Lingrid | EURUSD Pullback - Awaiting Trend Continuation SignalFX:EURUSD is consolidating above the upward trendline after forming a triangle within the broader ascending channel. The recent pullback tested the 1.1444 support zone, with a rebound hinting at renewed bullish pressure. A push beyond 1.1620 could unlock upside toward the 1.1700 resistance mark.
📈 Key Levels
Buy zone: 1.1444–1.1470
Sell trigger: breakdown below 1.1444
Target: 1.16200
Buy trigger: breakout above 1.1523 resistance
💡 Risks
Triangle breakdown could shift the short-term bias bearish
Failure to reclaim 1.1620 may stall bullish momentum
A sharp drop below the black trendline would invalidate the structure
If this idea resonates with you or you have your own opinion, traders, hit the comments. I’m excited to read your thoughts!
USDEUR trade ideas

EUR/USD Hits Weekly High as Ceasefire Weakens DollarEUR/USD climbed to a fresh weekly high near 1.1610 during late Asian trading on Tuesday, boosted by a sharp sell-off in the US Dollar following the announcement of a ceasefire between Israel and Iran by President Donald Trump. The truce improved market risk appetite and dampened demand for traditional safe havens like the US Dollar. As a result, the US Dollar Index (DXY) dropped steeply from Monday’s two-week high of 99.42 to around 98.10.
The dollar also came under pressure from shifting expectations around Fed policy. On Monday, Fed Governor Michelle Bowman signaled support for a potential rate cut as early as the July meeting, citing rising concerns over the labor market. “We should put more weight on downside risks to the job market,” she stated, adding that it's time to consider adjusting the policy rate.
Her dovish tone nudged up expectations for a July rate cut, with CME FedWatch data showing the probability rising from 14.5% on Friday to 22.7%.
In the Eurozone, ECB officials expressed concerns over the region’s economic outlook, particularly considering new US tariff policies. President Christine Lagarde, in remarks to the European Parliament, warned that inflation staying near the 2% target is uncertain and noted that survey data points to “some weaker prospects for economic activity in the near term.” She added that risks to growth remain “tilted to the downside.”
Resistance is located at 1.1630, while support is seen at 1.1530.
EURUSD - Shifting from Bearish to Bullish Soon!Hello TradingView Family / Fellow Traders. This is Richard, also known as theSignalyst.
📈EURUSD has been overall bullish trading within the rising wedge marked in blue.
Moreover, the orange zone is a strong support!
🏹 Thus, the highlighted blue circle is a strong area to look for buy setups as it is the intersection of support and lower blue trendline acting as a non-horizontal support.
📚 As per my trading style:
As #EURUSD approaches the blue circle zone, I will be looking for bullish reversal setups (like a double bottom pattern, trendline break , and so on...)
📚 Always follow your trading plan regarding entry, risk management, and trade management.
Good luck!
All Strategies Are Good; If Managed Properly!
~Rich
Disclosure: I am part of Trade Nation's Influencer program and receive a monthly fee for using their TradingView charts in my analysis.

EURUSD SELL expectancy EURUSD approaching a resistance zone and order block which I expect it to sell from that zone to the downside

EURUSD Potential SellHello Traders,
I am focusing on SELLING CMCMARKETS:EURUSD .
EURUSD is (Bigger Picture) is a Buyer's Market. However looking at the way it bought from 1.10649, it does seem to be aggressive or the demand is weak.
Looking to sell back to 1.10649
Good Luck

How do you eat an elephant? Small pieces at a time (EURUSD)I know we all are anticipating huge bearish moves from this pair. Some of us sold early and got kicked out. Other sellers have turned bullish. I believe we have found a top here. Sell and take all profit at 1,15765

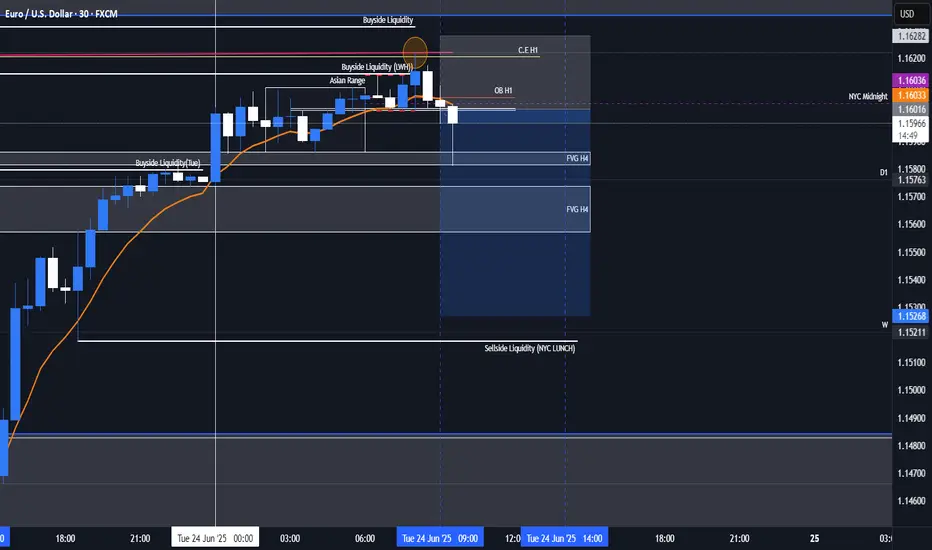
EUR/USD 30-MIN ANALYSISThis EURUSD setup showcases a clean bullish continuation scenario following a confirmed Break of Structure (BOS) and a sharp rally driven by momentum and liquidity imbalance.
After sweeping a key low (XXX), price impulsively broke structure to the upside, confirming a potential shift in market intent. A retracement is now expected to mitigate the Buy-Side Imbalance (BISI) zone.
BOS & SSS (Short-Term Structural Shift): Confirmed bullish intent.
Imbalance (BISI): Price left behind an unfilled imbalance zone a likely magnet for a pullback.
Re-Entry Zone: (BISI) provides a high probability area for long re-entry.
Upside Targets:
Target 1: 1.15483 – intermediate structural level.
Target 2: 1.16158 – premium supply / liquidity target.
#EURUSD 30M Technical Analysis Expected Move.

EURUSD Bullish flag breakout at 1.1525Trend Overview:
The EUR/USD currency pair maintains a bullish sentiment, supported by a sustained rising trend. Recent intraday price action shows a bullish flag breakout, a continuation pattern that typically signals further upside potential.
Key Levels to Watch:
Support:
1.1525 – critical former consolidation zone and breakout base
Below that: 1.1440 and 1.1360 as deeper retracement targets
Resistance:
Initial target: 1.1700
Further resistance at: 1.1740 and 1.1780
Scenarios:
Bullish Continuation:
A retest and hold of the 1.1525 support would confirm strength post-breakout
Could trigger renewed buying toward 1.1700, then 1.1740 and 1.1780
Bearish Reversal:
A daily close below 1.1525 would invalidate the bullish flag
Opens the path for a deeper correction toward 1.1440 and 1.1360
Conclusion:
EUR/USD remains technically bullish following the flag breakout, with upside momentum favoured above 1.1525. Traders should watch for price action near this key level — holding it supports a bullish continuation, while a breakdown may trigger a short-term bearish correction.
This communication is for informational purposes only and should not be viewed as any form of recommendation as to a particular course of action or as investment advice. It is not intended as an offer or solicitation for the purchase or sale of any financial instrument or as an official confirmation of any transaction. Opinions, estimates and assumptions expressed herein are made as of the date of this communication and are subject to change without notice. This communication has been prepared based upon information, including market prices, data and other information, believed to be reliable; however, Trade Nation does not warrant its completeness or accuracy. All market prices and market data contained in or attached to this communication are indicative and subject to change without notice.

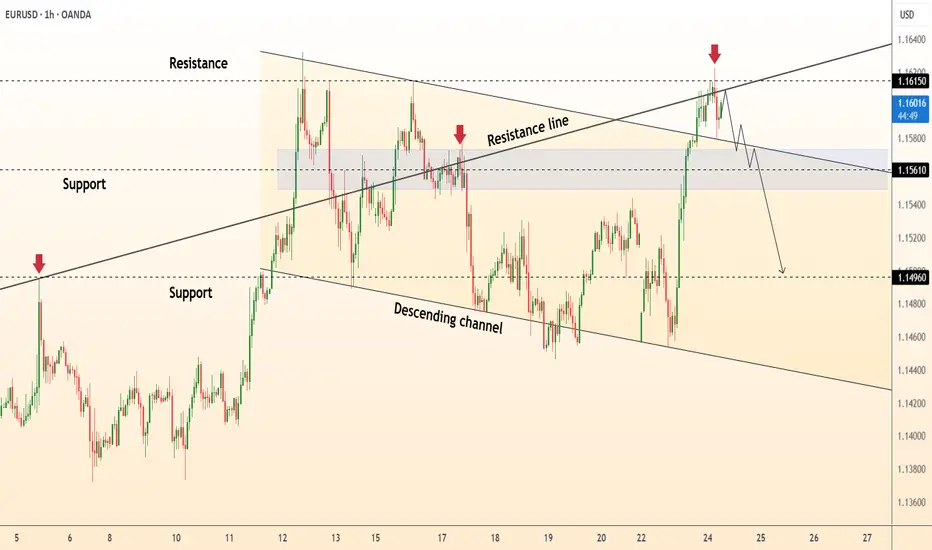
DeGRAM | EURUSD reached the resistance level📊 Technical Analysis
● Price has spiked into the confluence of the long-term channel roof (≈1.1615) and a steeper resistance line, printing a rejection candle and bearish divergence on the 1 h RSI.
● The move leaves a lower high versus 13 Jun and snaps the micro up-sloper; a slide back inside the grey 1.1560-1.1520 supply should accelerate toward the mid-June swing floor at 1.1490.
💡 Fundamental Analysis
● Hotter US S&P-global PMIs rekindled Fed “higher-for-longer” chatter, lifting two-year yields and the DXY, while French election uncertainty widens Bund-Treasury spreads—both pressuring EUR.
✨ Summary
Fade rallies 1.1580-1.1610; sustained trade beneath 1.1560 targets 1.1520 ➜ 1.1490. Bearish view void on an hourly close above 1.1630.
-------------------
Share your opinion in the comments and support the idea with a like. Thanks for your support
The Day Ahead Key Economic Data:
US:
Consumer confidence (June)
Regional business activity from Philadelphia Fed and Richmond Fed
House prices (April, FHFA)
Q1 current account balance
Germany:
Ifo business sentiment survey (June)
Canada:
Consumer price inflation (May)
Central Bank Activity:
US Federal Reserve:
Chair Powell testifies before Congress
Other Fed officials (Hammack, Williams, Collins, Barr) also speak
European Central Bank (ECB):
President Lagarde, Guindos, and Lane give remarks
Bank of England (BoE):
Governor Bailey and other key members (Greene, Ramsden, Breeden) speak
Corporate Earnings:
Key results from FedEx and Carnival
Government Bond Auctions:
US Treasury sells 2-year notes
Other Events:
NATO Summit continues (ends June 25)
China’s National People’s Congress Standing Committee meets (through June 27)
Summary:
It’s a heavy day for central bank speeches, led by Fed Chair Powell. Markets will also be watching Canadian inflation and US confidence data for clues on growth and rate paths. The NATO summit and China’s NPC meeting add geopolitical weight, while FedEx earnings may provide insight into global demand trends.
This communication is for informational purposes only and should not be viewed as any form of recommendation as to a particular course of action or as investment advice. It is not intended as an offer or solicitation for the purchase or sale of any financial instrument or as an official confirmation of any transaction. Opinions, estimates and assumptions expressed herein are made as of the date of this communication and are subject to change without notice. This communication has been prepared based upon information, including market prices, data and other information, believed to be reliable; however, Trade Nation does not warrant its completeness or accuracy. All market prices and market data contained in or attached to this communication are indicative and subject to change without notice.

DeGRAM | EURUSD growth in the channel📊 Technical Analysis
● The chart for EURUSD, as indicated in the upper right corner, displays a classic descending wedge pattern, which is typically a bullish reversal signal. Price action has respected the wedge’s lower boundary multiple times, forming a series of higher lows while sellers failed to push the pair below the 1.0670 support zone. The most recent candles show a decisive breakout above the wedge’s upper trendline, accompanied by increased volume, suggesting that buyers are regaining control. This breakout is further validated by the RSI indicator, which has moved out of oversold territory and is now trending upward, confirming the shift in momentum.
● The technical setup is reinforced by the presence of a horizontal resistance level at 1.0750, which has acted as a magnet for price in previous attempts. The chart also highlights a bullish engulfing pattern on the daily timeframe, signaling strong demand and a potential continuation toward the next resistance at 1.0820. The moving averages are beginning to converge, with the shorter-term MA crossing above the longer-term MA, a classic bullish crossover that often precedes sustained upward movement. These factors collectively point to a high-probability scenario for further gains in the EURUSD pair.
💡 Fundamental Analysis
● Recent fundamental developments support the bullish technical outlook. Over the past two days, the Federal Reserve has maintained its policy rate, but forward guidance has hinted at a possible rate cut later this year, which has weighed on the US dollar. Meanwhile, the European Central Bank has adopted a more cautious stance, with the probability of a near-term rate cut decreasing as inflation data remains sticky in the eurozone. Additionally, easing geopolitical tensions in the Middle East and stable US retail sales have reduced safe-haven demand for the dollar, further supporting the euro’s advance.
✨ Summary
● A confirmed breakout above the descending wedge and bullish momentum indicators suggest a long entry on EURUSD above 1.0750, targeting 1.0820. The bullish scenario remains valid as long as price holds above the 1.0670 support. A close below this level would invalidate the setup and call for a reassessment of the trend.
-------------------
Share your opinion in the comments and support the idea with a like. Thanks for your support
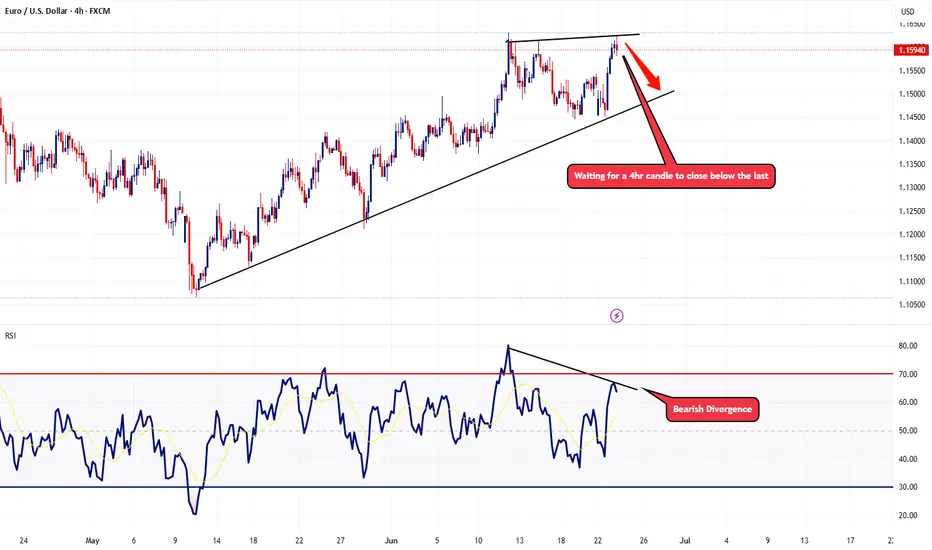
EURUSD Potential Topping ActionTaking a look at the 4hr chart, RSI is showing signs that the bullish momentum is starting to fade with the bearish divergence. In the event we get a 4hr candle that closes below the last, I'll be looking to start scaling some short positions with this pair.
Trade Safe - Trade Well.

EURUSD Intra-day ShortEURUSD is in a long-term pivot to go short but the market is still in a accumulation phase of collecting orders and so we are still not in the position yet to commit to longer targets. We are looking at short term draw on liquidity like yesterday's NYC session and are accounting for a possible accumulation there after to the upside potentially.
#AN010: De-Escalation, ECB, Oil Prices and more
Hi, I’m Forex Trader Andrea Russo and today we’re going to take a look at this week’s news. Thank you all for the great number of readers I’m receiving these days.
Don’t forget that by visiting my website, you can also connect with me on other platforms and you can also find exclusive Benefits for my readers.
🔶 Key Highlights of the Week
ECB’s Villeroy Confirms Rate-Cut Bias Amid Energy Volatility
Governor François Villeroy de Galhau signaled that the European Central Bank remains open to further rate cuts—even with recent oil-price volatility—due to a strong euro and controlled inflation
Oil Prices Surge—and Recede—on Iran Tensions and Ceasefire News
U.S. strikes on Iran triggered at 5–7% spike in crude, pushing Brent above $77/barrel, before plummeting as ceasefire sentiment returned
Dovish Shift at the Fed
Multiple Fed officials (Bowman, Waller, Goolsbee) openly support a July rate cut, shifting dollar sentiment
Emerging-Market Pressure: Indian Rupee in Focus
Rising oil costs and geopolitical instability weigh on the INR, prompting potential RBI intervention
Geopolitical De-escalation Eases Market Risk
A U.S.-Iran ceasefire triggered a sharp retreat in oil, boosted equities globally, and weakened safe-haven USD and gold
-Forex Market Reactions: What Traders Need to Know
EUR/USD:
Rate-cut window in Europe: The ECB's dovish tone softens EUR's upside, while oil volatility now has less impact.
USD weakness: Dovish Fed commentary has dented dollar strength
Key chart signals: A sustained break below 1.0670 could open further downside toward 1.0600–1.0535.
USD/JPY:
Choppy action off failed breakouts near 148.00—watch for JPY resilience risk amid risk-off repricing
AUD/USD & Other Emerging Currencies:
Oil-driven FX pressure affecting the AUD—tracked via crude sensitivity.
The Indian rupee weakness hints at broader emerging-market stress in risk-sensitive currencies
🛠️ Strategy & Outlook for Traders
Theme Implication for FX
Fed dovishness Dollar softness → supports EUR, JPY, EM currencies
ECB policy flexibility Cap on EUR gains → neutral bias until data confirms
Oil volatility Medium-term risk for AUD, CAD, NOK, RUB
Geopolitical calm Risk-on sentiment → pressure on safe-haven USD & JPY
🎯 Trade Setups:
EUR/USD: Short on fall below 1.0670—target 1.0600–1.0535; stop above 1.0760.
AUD/USD: Short biased if oil sustains above $75; aligned with broader commodity-driven themes.
USD/JPY: Watch for continuation short if risk appetite returns; else, trade reversals at 148.00 key.

EURUSD shortIn my previous analysis in Friday, June 20, I had short pending order on this pair.
Due to US attack on Iran base's over the weekend, I closed it and put another pending short position visible here.
SL: 1.1582
Entry: 1.1550
TP: 1.1357
I expect higher volatility today, but don't expect bigger jump to the upside, so my risk:reward is bigger now.
I expect the price to clean Friday high's and go down again.

EURUSD entering the Bear Zone ...Have an eye on the Orange Circle for a possible short position...
Stay tuned for the comprehensive analysis in next IDEA...
Thank you for your attention and support...
#EURUSD #MJTRADING #FOREX

EURUSD SHORT FORECAST Q2 W26 D24 Y25EURUSD SHORT FORECAST Q2 W26 D24 Y25
Professional Risk Managers👋
Welcome back to another FRGNT chart update📈
Diving into some Forex setups using predominantly higher time frame order blocks alongside confirmation breaks of structure.
Let’s see what price action is telling us today!
💡Here are some trade confluences📝
✅Daily order block
✅15' order block
✅Intraday breaks of structure
✅4H Order block
🔑 Remember, to participate in trading comes always with a degree of risk, therefore as professional risk managers it remains vital that we stick to our risk management plan as well as our trading strategies.
📈The rest, we leave to the balance of probabilities.
💡Fail to plan. Plan to fail.
🏆It has always been that simple.
❤️Good luck with your trading journey, I shall see you at the very top.
🎯Trade consistent, FRGNT X

EURUSD facing resistance at Triple TopEURUSD facing resistance at Triple Top. With new geo-political situtaion yesterday night, Eith it will retace from this level or from upper channel line.

Euro H4 | Potential reversal off a multi-swing-high resistanceThe Euro (EUR/USD) is rising towards a multi-swing-high resistance and could potentially reverse off this level to drop lower.
Sell entry is at 1.1609 which is a multi-swing-high resistance.
Stop loss is at 1.1675 which is a level that sits above the 127.2% Fibonacci extension.
Take profit is at 1.1535 which is a pullback support that aligns with a 50% Fiboancci retracement.
High Risk Investment Warning
Trading Forex/CFDs on margin carries a high level of risk and may not be suitable for all investors. Leverage can work against you.
Stratos Markets Limited (tradu.com ):
CFDs are complex instruments and come with a high risk of losing money rapidly due to leverage. 63% of retail investor accounts lose money when trading CFDs with this provider. You should consider whether you understand how CFDs work and whether you can afford to take the high risk of losing your money.
Stratos Europe Ltd (tradu.com ):
CFDs are complex instruments and come with a high risk of losing money rapidly due to leverage. 63% of retail investor accounts lose money when trading CFDs with this provider. You should consider whether you understand how CFDs work and whether you can afford to take the high risk of losing your money.
Stratos Global LLC (tradu.com ):
Losses can exceed deposits.
Please be advised that the information presented on TradingView is provided to Tradu (‘Company’, ‘we’) by a third-party provider (‘TFA Global Pte Ltd’). Please be reminded that you are solely responsible for the trading decisions on your account. There is a very high degree of risk involved in trading. Any information and/or content is intended entirely for research, educational and informational purposes only and does not constitute investment or consultation advice or investment strategy. The information is not tailored to the investment needs of any specific person and therefore does not involve a consideration of any of the investment objectives, financial situation or needs of any viewer that may receive it. Kindly also note that past performance is not a reliable indicator of future results. Actual results may differ materially from those anticipated in forward-looking or past performance statements. We assume no liability as to the accuracy or completeness of any of the information and/or content provided herein and the Company cannot be held responsible for any omission, mistake nor for any loss or damage including without limitation to any loss of profit which may arise from reliance on any information supplied by TFA Global Pte Ltd.
The speaker(s) is neither an employee, agent nor representative of Tradu and is therefore acting independently. The opinions given are their own, constitute general market commentary, and do not constitute the opinion or advice of Tradu or any form of personal or investment advice. Tradu neither endorses nor guarantees offerings of third-party speakers, nor is Tradu responsible for the content, veracity or opinions of third-party speakers, presenters or participants.

Uptrend on EURUSDEURUSD has moved higher and is now testing the previous high.
This confirms the analysis and opens up additional buying opportunities.
Reduce the risk on all active buy positions as the analysis plays out.
Additional entries can be considered after a pullback or a breakout followed by a retest.
The next target is 1,1706!

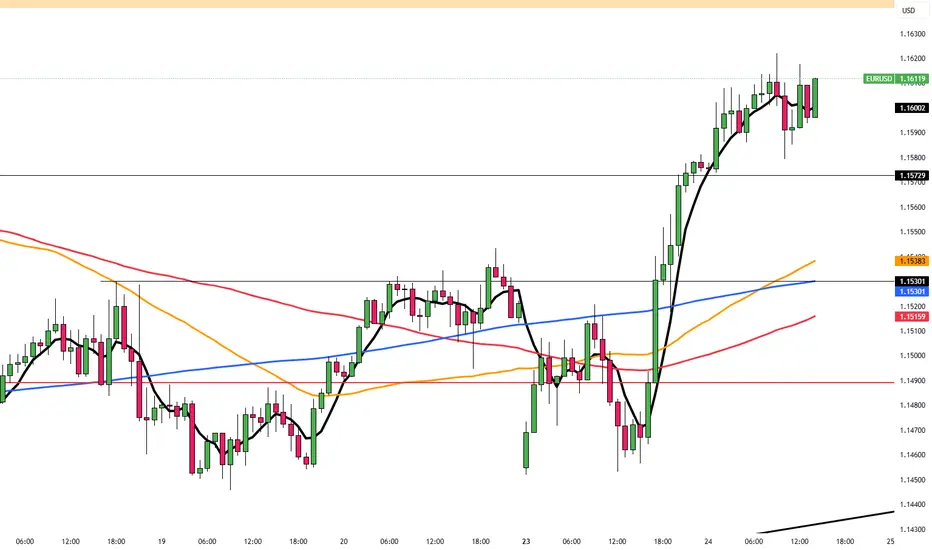
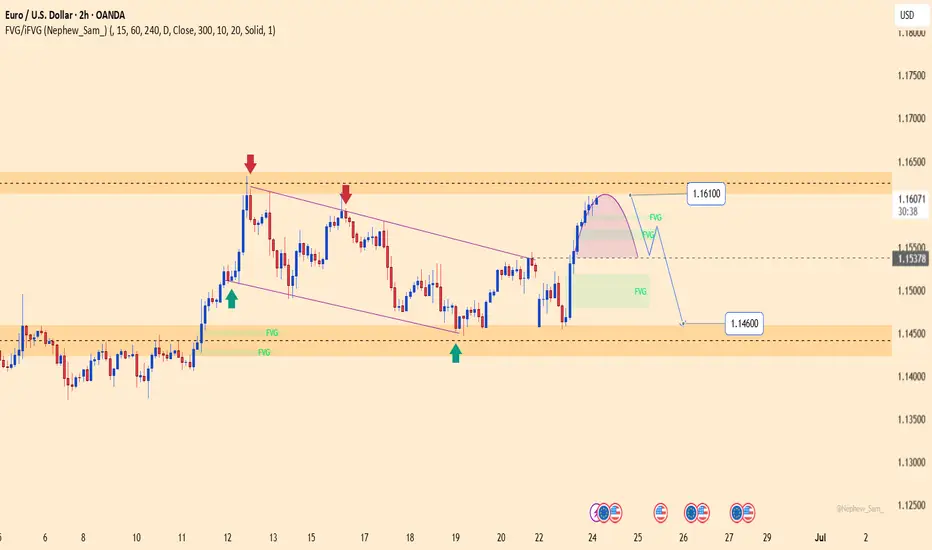
EURUSD – Rejected at 1.16100, bearish pressure re-emergingEURUSD has just completed a technical rebound toward the 1.16100 resistance zone, which has previously rejected price multiple times. The current structure suggests a mild reversal, with a potential pullback toward 1.15378. A break below this support could extend the decline toward 1.14600.
Recent upside momentum came mainly from temporary USD weakness, but the greenback remains supported by expectations that the Fed will keep interest rates elevated, while Eurozone PMI data continues to disappoint.
In summary, 1.16100 remains a key resistance level. If price shows clear rejection here, EURUSD may be poised for a deeper correction in the short term.
EURUSDThis levels is for reactions to support and resistace.
Price can now in Bull-trend if keep 1.145$ in sypport and breaked trendline.
⚠️Control risk management for positions.
