EUR_USD POTENTIAL SHORT|
✅EUR_USD has been growing recently
And the pair seems locally overbought
So as the pair is approaching
A horizontal resistance of 1.1632
Price decline is to be expected
SHORT🔥
✅Like and subscribe to never miss a new idea!✅
Disclosure: I am part of Trade Nation's Influencer program and receive a monthly fee for using their TradingView charts in my analysis.
USDEUR trade ideas

A POTENTIAL TREND REVERSAL Hello Traders 👋
What are your views about EURUSD
Looking at the daily timeframe we can see that price action didn't take out liquidity at the top which is indicated with a blue rectangle.
Am seeing price action retracing to that liquidity zone which is indicated with a blue rectangle and from there reversing to the downside.
Let's look at the fundamental analysis of EURUSD.
Trump announced the conclusion of a trade agreement with the EU:
The EU will invest $600 billion more in the US than before
15% tariff on EU goods, including cars
All EU countries will open their markets to the US
EU to purchase hundreds of billions of dollars worth of military equipment
EU to purchase $750 billion worth of energy from the US. Energy is a key part of the agreement.
PS:
It is worth monitoring the market reaction from the opening. Pay attention to the market reaction during different sessions.
Markets may react ambiguously, but against the general backdrop, the following reaction should be expected:
USD → sharp rise (dollar strengthening due to capital inflows and growth in energy exports).
EUR → down, as the EU will bear the costs of tariffs and rising imports from the US.
Gold → down (correction or decline due to the strengthening of the dollar and reduced demand for hedging).
BTC → neutral or slight decline (due to USD strength):
If the agreement stimulates the economy and liquidity, this could be a bullish factor for BTC.
………………………………………….

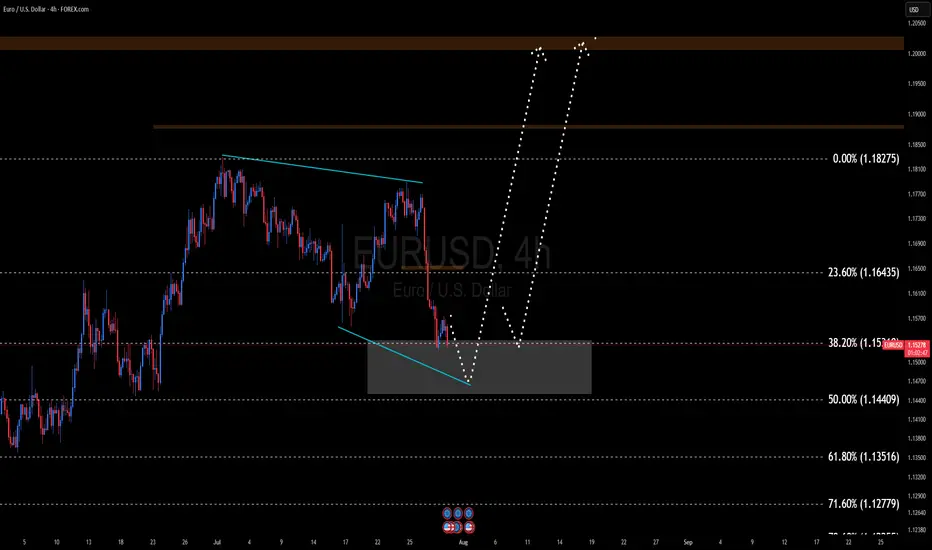
EURUSD will push higher toward month endBased on price action last Friday and early Monday movement,
I foresee market will retest highest mark at 1.182++.
calculate your own risk & reward.
Good Luck

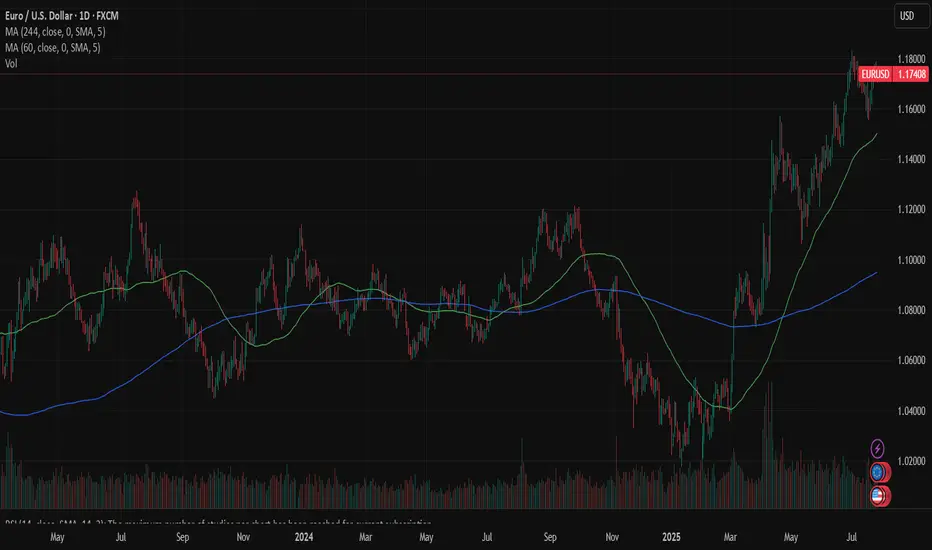
EURUSD Will the 1D MA50 hold?The EURUSD pair has been trading within a Channel Up pattern since the April 21 2025 High. The price is right now on a strong pull-back and is about to test the 1D MA50 (blue trend-line) for the first time since May 12.
As long as the 1D candle closes above the 1D MA50, it will be a buy signal, targeting 1.19250 (a standard +3.20% rise).
If the candle closes below the 1D MA50, the buy will be invalidated and we will switch to a sell, targeting the 1D MA100 (green trend-line) at 1.14100.
-------------------------------------------------------------------------------
** Please LIKE 👍, FOLLOW ✅, SHARE 🙌 and COMMENT ✍ if you enjoy this idea! Also share your ideas and charts in the comments section below! This is best way to keep it relevant, support us, keep the content here free and allow the idea to reach as many people as possible. **
-------------------------------------------------------------------------------
Disclosure: I am part of Trade Nation's Influencer program and receive a monthly fee for using their TradingView charts in my analysis.
💸💸💸💸💸💸
👇 👇 👇 👇 👇 👇

EURUSD BULLISH TREND EUR/USD is currently in a transitional phase and appears to have completed its retracement . It is expected to enter a bullish trend, with a possible breakout from the 1.14500 – 1.15200 range. These levels may serve as key turning points for the upcoming movement.
EURUSD: FOMC, PCE, NFP, JOLTs - busy week guaranteedThe ECB meeting was one of the major events during the previous week, when it comes to macro data. As it was widely expected, the ECB left rates unchanged, amid uncertainties related to trade tariffs with the U.S.. The ECB maintains its previous macro outlook, viewing the Euro Zone economy as resilient but facing downside risks. President Lagarde highlighted global trade tensions, geopolitical instability and negative shifts in market sentiment as key risks to further growth. At the same time, Lagarde dismissed concerns about the stronger euro, reiterating that the ECB does not target the exchange rate directly. With the inflation level of 2% and deposit rate of 2%, the ECB is in the position to take a wait-and-see stance on further rate cuts, although some analysts are mentioning the possibility of another 25bps cut in September.
Other macro data for the Euro Zone and Germany include the HCOB Manufacturing PMI Flash for July, which stood at 49,8 for the Euro Zone and 49,2 for Germany. Both indicators were standing in line with market expectations. The Ifo business Climate in Germany in July reached 88,6, in line with market forecast.
The previous week was relatively weak when it comes to currently important macro data for the U.S. economy. Posted data include Existing Home Sales in June, which reached 3,93M and were a bit lower from forecasted 4,0M. The indicator dropped by 2,7% compared to the previous month. The S&P Global Manufacturing PMI flash for July reached 49,5 a bit lower from market forecast of 52,6. At the same time the S&P Global Services PMI flash for July beat market expectation with the level of 55,2. The durable Goods Orders in June dropped by -9,3% compared to the previous month, which was a bit lower from -10,8% expected by the market.
The ECB meeting left its mark on the parity of eurusd currency pair during the previous week. The euro strengthened till the level of 1,1786, but eased as of the end of the week, closing it at 1,1742. The currency pair was testing the 1,17 support line on Friday's trading session. The RSI continues to move at levels above the 50 line, ending the week modestly below the level of 60. The MA50 continues to diverge from MA200, without an indication of a potential cross in the near term period.
The week ahead is an important one from the perspective of macro data. A bunch of currently closely watched data for the U.S. will be posted, including PCE, NFP, JOLTs, Unemployment rate in July. In addition to data, the FOMC meeting will be held on Wednesday, July 30th, where the Fed will decide on interest rates. Current market expectation is that the Fed will leave rates unchanged at this meeting. However, the final decision is with the Fed, in which case, any surprises might significantly move the currency pair toward one side. Also, in case of surprises with any of the above mentioned macro data the market reaction could bring higher volatility. Precaution in trading with eurusd in the week ahead is highly advisable. As per current charts, there is a high probability that the currency pair will move to the downside to test the 1,17 support level for one more time. Levels around the 1,1650 might also be shortly tested. In case that the market decides for a higher ground, there is some probability for the level of 1,18, as the next resistance level to be tested shortly.
Important news to watch during the week ahead are:
EUR: GDP Growth Rate for Q2 for both Germany and the Euro Zone, Unemployment rate in Germany in July, Inflation rate in Germany and the Euro Zone preliminary for July,
USD: JOLTs Job Openings in June, GDP Growth Rate for Q2, Pending Home Sales in June, the FOMC meeting and Fed interest rate decision will be held on Wednesday, July 30th, PCE Price Index for June will be posted on Thursday, July 31st, Non-farm Payrolls for July, Unemployment rate in July, ISM Manufacturing PMI in July, University of Michigan Consumer Sentiment final for July.
Euro Drops Hard — Is a 100-Pips Slide Toward 1.1500 Next?Euro’s current situation doesn’t look great — we’re clearly seeing strong selling pressure across the board.
Price has now reached the block zones near 1.1600, and I want to break down what this area means to me.
The lower pivot of the 1.1600 zone was created after the 50% level of the previous bullish leg was consumed — which is typical in many bullish trends. Based on that, we expected a move toward 1.1800 to break the structure and continue the uptrend.
However, the recent bullish move lacked strength, which became quite clear during the last upward leg. And now, after that weak rally, we’re witnessing a sharp and aggressive selloff.
This reaction weakens the 1.1600 block in my eyes — and I’m now watching 1.1500 as the more probable target. It’s a major price level and also aligns with a bank-level midline zone.
In my view, it’s still too early to buy. I’d want to see price range and confirm before looking for longs.
That said, this area could be a good place to partially exit short positions and lock in some profits.
🔁 This analysis will be updated whenever necessary.
Disclaimer: This is not financial advice. Just my personal opinion!!!

Sell eurusdOur last selling idea already running 300+ pips now
Still monthly overbought
Euro remains weak among all cross pairs
Daily buy trend already breaks and also lower high

Bullish "Daily Chore" Setup on the EURUSDWe had one on Silver last week that played out nicely, now we have another Daily Chore signal setting up on the $EURUSD.
This is a short & sweet type of setup where we are looking for a test and rejection of a moving average an an opportunity to catch the next potential move upwards.
As mentioned in the video, we have A LOT of high impact news events happening this week so please be aware of that when looking to involve yourself in this and any other trading opportunities this week.
Please support by hitting that like button.
Follow so that you don't miss my future trading ideas.
And if you have any questions, comments or want to share you views on the market, please do so below.
Akil

Ursulization = Bureaucracy > Democracy (a.k.a. The Glasgow Kiss)🤝💥 Ursulization – Bureaucracy Replaces Democracy (a.k.a. The Glasgow Kiss) 🇺🇸🇪🇺
📍Background:
The media spun it as a "15% tariff agreement"…
But in reality, this wasn’t diplomacy — it was a disguised capitulation.
And the stage? None other than Scotland, ancestral ground of Donald J. Trump.
So when Ursula von der Leyen came seeking a gentle diplomatic handshake…
What she received instead was the infamous Glasgow Kiss — sudden, sharp, and unmissable.
💥 What’s a Glasgow Kiss?
A British slang term for a violent headbutt to the face —
No grace. No warning. Just raw force.
💬 The Real Story:
Ursula von der Leyen — unelected, unaccountable —
signed off on $1.4 trillion in U.S.-bound capital flows:
💸 $750B to buy American energy
🛠 $600B in U.S. infrastructure, defense & industry
All to sidestep 50% tariffs the Trump team had ready to roll.
But here's the kicker:
She wasn’t acting on behalf of European citizens.
She was speaking for the bureaucracy, not the people.
🔥 Welcome to Ursulization:
Where democracy is sidelined by unelected power.
Where negotiations happen in silence.
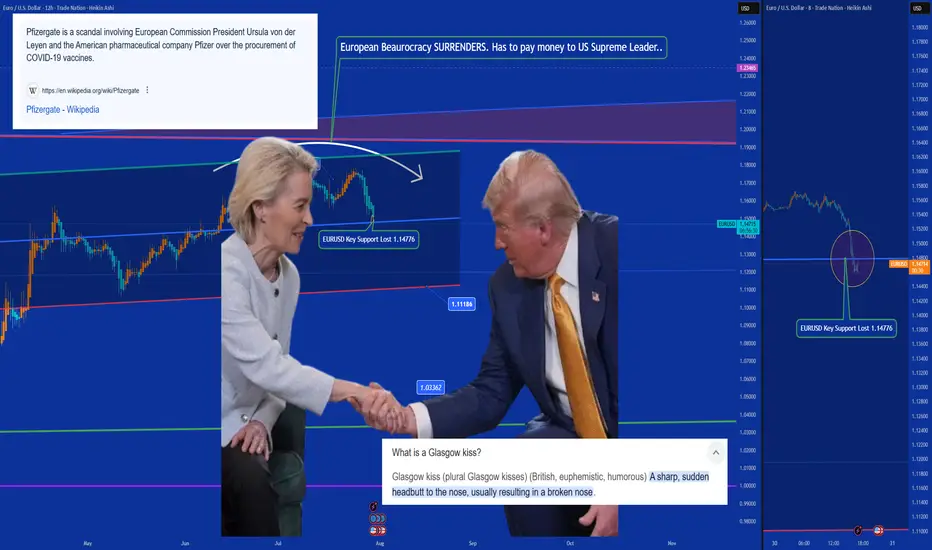
Where scandals like PfizerGate get buried while the euro breaks down.
📉 EUR/USD just lost key support at 1.14776 —
The chart shows t he cost of surrender.
💉 PfizerGate Reminder:
Ursula already faced heat for secretive vaccine contracts with Pfizer.
Now, she’s handing over Europe’s industrial backbone —
To Trump. In Scotland. With no public mandate.
📌 Conclusion:
Trump didn’t compromise — he collided.
Europe didn’t resist — it surrendered.
This wasn’t diplomacy.
It was a Glasgow Kiss — a collision between legitimacy and bureaucratic power.
👑 One elected by the people (Trump). One not elected at all (Woke agenda style Ursula).
💰 One walks away with trillions (Trump). The other, with silence (Ursula 'Von der Pfizinen never electenen'').
One Love,
The FXPROFESSOR 💙
ps. Till we can bring Democracy and Europe back.
Disclosure: I am happy to be part of the Trade Nation's Influencer program and receive a monthly fee for using their TradingView charts in my analysis. Awesome broker, where the trader really comes first! 🌟🤝📈
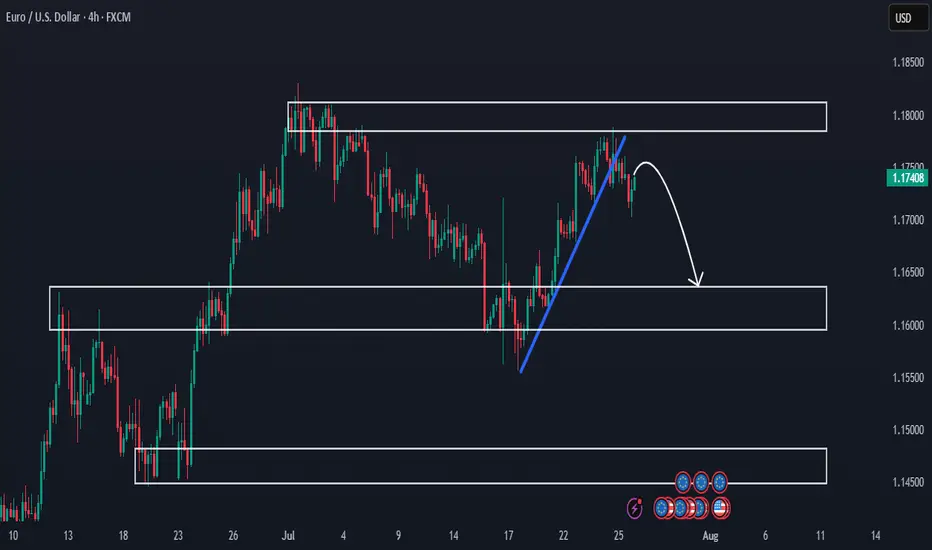
Premarket Analysis - Will Price Head Lower?Hello everybody!
We’re looking at three key areas on the chart.
Price has been rejected from a supply zone.
The clean upward trendline has been broken, and we expect the price to move lower this week.
If the drop continues, we’ll look to sell and aim for the more likely target around 1.16400.
Then we’ll see whether this first demand/support area holds or not.
Have a good trading week ahead!
EUR/USD | Correction Near Key Demand – Watching for Rebound!By analyzing the EURUSD chart on the 4-hour timeframe, we can see that after the last analysis, the price started a correction and is currently trading around 1.17150. I expect that once it enters the 1.16780–1.17100 zone, we could see a rebound from this key demand area. If the price holds above this zone, the next bullish targets will be 1.17370 as the first target and 1.17730 as the second.
Please support me with your likes and comments to motivate me to share more analysis with you and share your opinion about the possible trend of this chart with me !
Best Regards , Arman Shaban

EURUSD Set To Grow! BUY!
My dear followers,
This is my opinion on the EURUSD next move:
The asset is approaching an important pivot point 1.1557
Bias - Bullish
Technical Indicators: Supper Trend generates a clear long signal while Pivot Point HL is currently determining the overall Bullish trend of the market.
Goal - 1.1632
About Used Indicators:
For more efficient signals, super-trend is used in combination with other indicators like Pivot Points.
Disclosure: I am part of Trade Nation's Influencer program and receive a monthly fee for using their TradingView charts in my analysis.
———————————
WISH YOU ALL LUCK

EURusd short position 31/07/2025English : According to our analysis, we anticipate a bearish scenario.
Morocan Darija : kanchofo d'apres l'analyse dyalna antsanaw hboot
ATENTION : I only share my ideas, not signals

EURUSD breakdown alert – Will the drop accelerate?Hello traders, let’s take a look at how EURUSD is performing today!
Yesterday, EURUSD extended its downward slide after failing to sustain bullish momentum from the 1.1600 zone. The pair is now hovering around 1.1426.
The recent decline is largely attributed to the strength of the US dollar, which continues to benefit from a series of upbeat economic data – including robust job reports, strong consumer spending, and improving sentiment. All of these came in above expectations, pushing the dollar higher. In contrast, the European Central Bank (ECB) maintains a cautious stance, with no clear signals of policy changes – leaving the euro under persistent pressure.
From a technical standpoint, the short-term outlook suggests the beginning of a new bearish wave. Notably, price action is reacting to resistance from the nearby EMA 34 and EMA 89 levels. The break below the recent support zone has added fuel to the ongoing bearish momentum.
If the current support fails to hold, EURUSD could slip further toward the 1.272 Fibonacci extension at 1.1305, and potentially as low as 1.1178 – the 1.618 extension level.
Looking ahead, traders should focus on potential pullback opportunities, targeting SELL entries around 1.1540–1.1580 – a confluence zone of technical interest. However, if price breaks above the 1.1600 threshold and holds, this bearish scenario may be invalidated.
What’s your outlook for EURUSD in the coming days? Share your thoughts in the comments below!

EUR/USD Short from the nearby 1hrI’m currently more confident in EU’s bearish setup compared to GU, as price is nearing a clear point of interest (POI) that aligns well with the developing downtrend. The 2hr supply zone has already caused a CHoCH (Change of Character), and price has been approaching it slowly and with reduced momentum — often a strong indication of an upcoming reaction.
While price isn’t near a demand zone yet, I’ll be keeping an eye on the 7hr demand zone below. If price reaches that area, I’ll be looking for a high-probability buy setup in line with the broader market context.
Confluences for EU Sells:
Price has tapped into a 2hr supply zone that caused a CHoCH to the downside
Bearish pressure remains strong, supported by DXY strength
Clean liquidity to the downside that needs to be swept
Slowing momentum and signs of distribution as price approaches supply
P.S. If price continues lower from this point, I anticipate another break of structure, which could form a new supply zone to work with later this week.
Let’s stay patient, follow the flow, and execute smart. 🔥📉💼

EUR/USD Latest Update TodayHello everyone, what do you think about FX:EURUSD ?
EUR/USD previously broke the downward price channel, but failed to maintain the momentum, leading to a strong correction phase. Currently, the price is trading around 1.156 and testing key Fibonacci levels, with the 0.5 - 0.618 levels marked as potential reversal zones, as highlighted in the analysis.
With the current market sentiment, the strong recovery of the USD has been the main factor driving the EUR/USD movement in recent days. Positive economic data from the US has strengthened the US dollar, decreasing the appeal of gold and safe-haven assets like the EUR. Furthermore, expectations surrounding Fed policy decisions continue to add pressure on EUR/USD, with investors bracing for the possibility of the Fed maintaining high interest rates for a longer period.
For traders, it's clear that the bearish trend is in favor, as indicated by the EMA reversal. The Fibonacci levels 0.5 (1.164) and 0.618 (1.161) will be crucial zones, where reaction signals could open opportunities for SELL positions. The next target will be at Fib 1 and Fib 1.618.
That's my perspective and share, but what do you think about the current trend of EUR/USD? Leave your comments below this post!

EUR/USD Holds Lower-High ResistancePerhaps it's a buy the rumor sell the news event, or maybe it's just squaring up ahead of a really big week of U.S. drivers, but so far this week EUR/USD is putting in a sizable sell-off.
Notably, the rally last week ran through the ECB rate decision and price held at a lower-high as bulls suddenly got shy around tests of resistance. This retains bearish potential given the breach of the rising wedge and the lower-lows that printed a couple of weeks ago, which led into the bounce of lower-highs last week.
Also notable is where that resistance held - right around the 78.6% Fibonacci retracement of the 2021-2022 major move, as that held the highs on Friday ahead of today's sell-off. If looking for USD-weakness, I think there could be more amenable pastures elsewhere, such as GBP/USD. But for USD-strength, EUR/USD makes a compelling argument given the current technical structure. - js

EURUSD | Faces Continued Downside, Reversal Above 1.1745EURUSD | Faces Continued Downside Risk; Reversal Only Confirmed Above 1.1747
The price initiated a bearish trend from the resistance level at 1.1747 and continues to decline. As long as it remains below the pivot level at 1.1685, further downside pressure is expected, with potential targets at 1.1632 and 1.1559. A confirmed break below this zone would reinforce the more bearish momentum.
However, if the price reverses and moves back above the pivot line, it may first reach 1.1747 before resuming the downward trend again.
The bullish trend confirmation will start above 1.1747.
Key Levels:
• Pivot line: 1.1685
• Resistance: 1.1747, 1.1894.
• Support: 1.1632, 1.15993, 1.1559.

EURUSD Massive Long! BUY!
My dear friends,
EURUSD looks like it will make a good move, and here are the details:
The market is trading on 1.1665 pivot level.
Bias - Bullish
Technical Indicators: Supper Trend generates a clear long signal while Pivot Point HL is currently determining the overall Bullish trend of the market.
Goal - 1.1728
About Used Indicators:
Pivot points are a great way to identify areas of support and resistance, but they work best when combined with other kinds of technical analysis
Disclosure: I am part of Trade Nation's Influencer program and receive a monthly fee for using their TradingView charts in my analysis.
———————————
WISH YOU ALL LUCK

EURUSD: Will Go Up! Long!
My dear friends,
Today we will analyse EURUSD together☺️
The price is near a wide key level
and the pair is approaching a significant decision level of 1.15675 Therefore, a strong bullish reaction here could determine the next move up.We will watch for a confirmation candle, and then target the next key level of 1.16318.Recommend Stop-loss is beyond the current level.
❤️Sending you lots of Love and Hugs❤️

DeGRAM | EURUSD breakout📊 Technical Analysis
● Two successive rejections at the upper-channel/long-term trend-cap (red arrows) printed bearish engulfings; price has slipped back under 1.1687 minor support, breaking the July micro up-trend.
● Momentum now points to the channel mid-line ≈1.1650; clearing it exposes the lower rail / May pivot 1.1594, in line with the projected swing depth.
💡 Fundamental Analysis
● Hot US Q2-GDP and an upside surprise in core-PCE lifted 2-yr Treasury yields, reviving dollar demand, while ECB sources signalled no urgency to hike further after soft July PMIs.
✨ Summary
Short 1.1680-1.1700; hold below 1.1687 targets 1.1650 ▶ 1.1595. Invalidate on a 4 h close above 1.1750.
-------------------
Share your opinion in the comments and support the idea with a like. Thanks for your support!

EUR/USD Slips Again – Just a Pullback or More to Come?Hey everyone! Great to have you back for another market chat today.
As of writing, EUR/USD remains under significant bearish pressure, currently trading near 1.154 — marking a rather gloomy start to the new trading week. The euro is clearly struggling to attract buying interest as traders reassess the ECB’s stance and digest the newly announced EU–US trade agreement. Meanwhile, the U.S. dollar is gaining momentum, flipping the trend unexpectedly.
From a technical perspective, EUR/USD is showing clear weakness. The pair has broken below both its rising wedge and previous uptrend line, with candles closing firmly lower — a strong sign that the bears are in control.
In my personal view, I expect EUR/USD to continue sliding toward the next two support zones, although a minor pullback could occur first as part of a typical correction.
But what do you think? Is this just a dip… or the start of something bigger for EUR/USD? Let me know your take in the comments!
