EURUSD Long, 29 JulyReversal Setup from Daily OB + LTF Confluence
Price tapped into a Daily Bullish OB with 50EMA support, signaling potential for a bullish reaction. While structure isn’t perfect, the overextension and DXY correlation offer strong intraday confluence.
📈 HTF Confluence:
✅ Sitting inside a Daily Bullish Orderblock
📍 50EMA in the same area → added support
🟢 Expecting a bounce from this zone, even if HTF trend isn’t clearly bullish yet
📉 LTF Context:
💤 Asia range formed, still unfilled → clean liquidity target
📉 Overextended bearish move into 15m POI
🪞 DXY at its own 15m POI + Asia range to complete → supports EU upside
🎯 Entry Plan:
✅ Clear 1m BOS after reacting from 15m Decisional OB
🎯 Entry taken at 5m OB inside that 15m POI zone
⚠️ Decisional OB isn’t ideal, but stacked confluences justify the risk
🛡 SL: Below 5m OB
📌 TP: Asia high + potential continuation if DXY breaks lower
USDEUR trade ideas

Trendline Liquidity Taken Watching for MSS at Support in EUR/USDEUR/USD has taken liquidity above the previous trendline resistance during the New York session and is now declining. The pair is approaching a key support zone. If it reaches this level and shows a market structure shift (MSS) or any other bullish confirmation, there is potential for a reversal from this zone. In that case, price could move upward toward the marked bearish Fair Value Gap (FVG). Always conduct your own research (DYOR) before making any trading decisions.

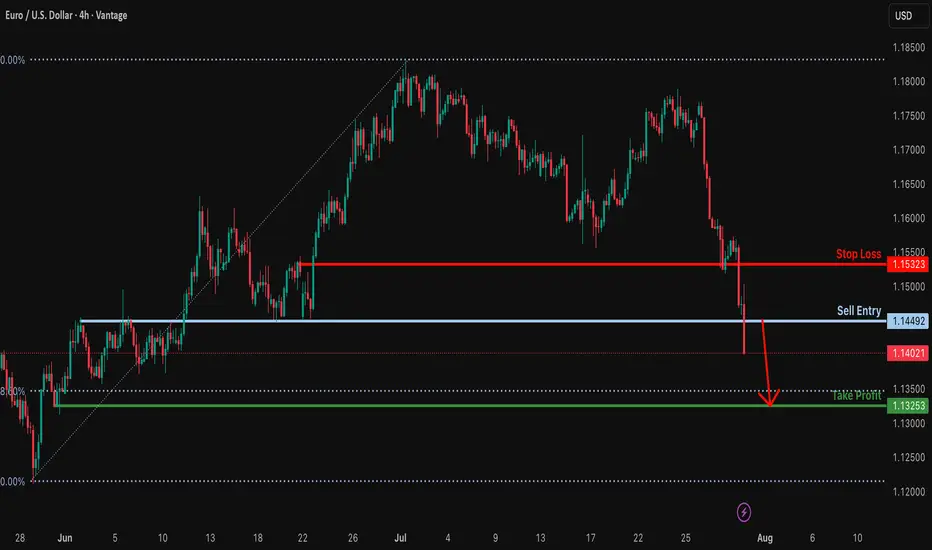
Bearish drop?EUR/USD has broken out of the support level, which is an overlap support. A potential pullback to the sell entry followed by a reversal could lead the price to drop from this level to our take-profit.
Entry: 1.1449
Why we like it:
There is an overlap resitance level.
Stop loss: 1.1532
Why we like it:
There is a pullback resitance level.
Take profit: 1.1325
Why we like it:
There is a swing low support that is slghtly below the 78.6% Fibonacci retracement.
Enjoying your TradingView experience? Review us!
Please be advised that the information presented on TradingView is provided to Vantage (‘Vantage Global Limited’, ‘we’) by a third-party provider (‘Everest Fortune Group’). Please be reminded that you are solely responsible for the trading decisions on your account. There is a very high degree of risk involved in trading. Any information and/or content is intended entirely for research, educational and informational purposes only and does not constitute investment or consultation advice or investment strategy. The information is not tailored to the investment needs of any specific person and therefore does not involve a consideration of any of the investment objectives, financial situation or needs of any viewer that may receive it. Kindly also note that past performance is not a reliable indicator of future results. Actual results may differ materially from those anticipated in forward-looking or past performance statements. We assume no liability as to the accuracy or completeness of any of the information and/or content provided herein and the Company cannot be held responsible for any omission, mistake nor for any loss or damage including without limitation to any loss of profit which may arise from reliance on any information supplied by Everest Fortune Group.
Market Analysis: EUR/USD Dips FurtherMarket Analysis: EUR/USD Dips Further
EUR/USD extended losses and traded below the 1.1600 support.
Important Takeaways for EUR/USD Analysis Today
- The Euro struggled to clear the 1.1800 resistance and declined against the US Dollar.
- There is a key downward channel forming with resistance at 1.1575 on the hourly chart of EUR/USD.
EUR/USD Technical Analysis
On the hourly chart of EUR/USD at FXOpen, the pair failed to clear the 1.1800 resistance. The Euro started a fresh decline below the 1.1720 support against the US Dollar.
The pair declined below the 1.1660 support and the 50-hour simple moving average. Finally, it tested the 1.1520 level. A low was formed at 1.1519 and the pair is now consolidating losses. The market is showing bearish signs, and the upsides might remain capped.
There was a minor increase toward the 23.6% Fib retracement level of the downward move from the 1.1770 swing high to the 1.1519 low. Immediate resistance on the upside is near the 1.1575 level.
There is also a key downward channel forming with resistance at 1.1575. The next major resistance is near the 1.1665 zone and the 50-hour simple moving average or the 50% Fib retracement level.
The main resistance sits near the 1.1770 level. An upside break above the 1.1770 level might send the pair towards 1.1800. Any more gains might open the doors for a move towards 1.1850.
On the downside, immediate support on the EUR/USD chart is seen near 1.1520. The next major support is near the 1.1465 level. A downside break below 1.1465 could send the pair towards 1.1350.
This article represents the opinion of the Companies operating under the FXOpen brand only. It is not to be construed as an offer, solicitation, or recommendation with respect to products and services provided by the Companies operating under the FXOpen brand, nor is it to be considered financial advice.

Eurusd techinical analysis.Eurusd techinical analysis next move posibale at h2 time frame not finchinal advice.

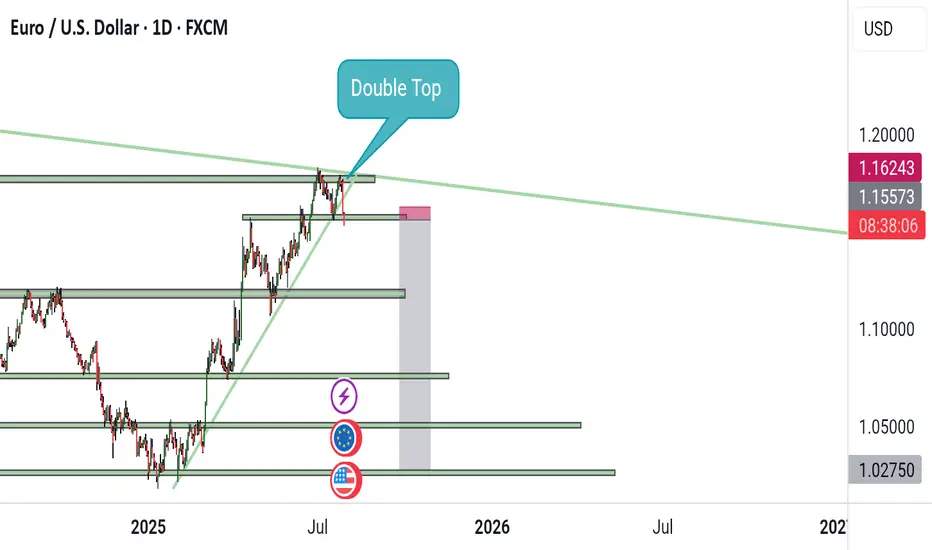
Eurusd is bearish Price was previously bullish, formed a double top on the Higher time frame. Wait for retest of the broken support zone and opt for a buy.
SHORT EURUSD Possible scenarioWeekly chart of EURUSD show potential short coming next coming weeks . MOMENTUM IS UP but the price is declining ,
Two possiblities AT the moment that can play IF ( BIG IF) the price decide to down in the coming days ,
Green arrow show a bounce from 1.1360 area and red arrow show a possiblity for further down to 1.1090.

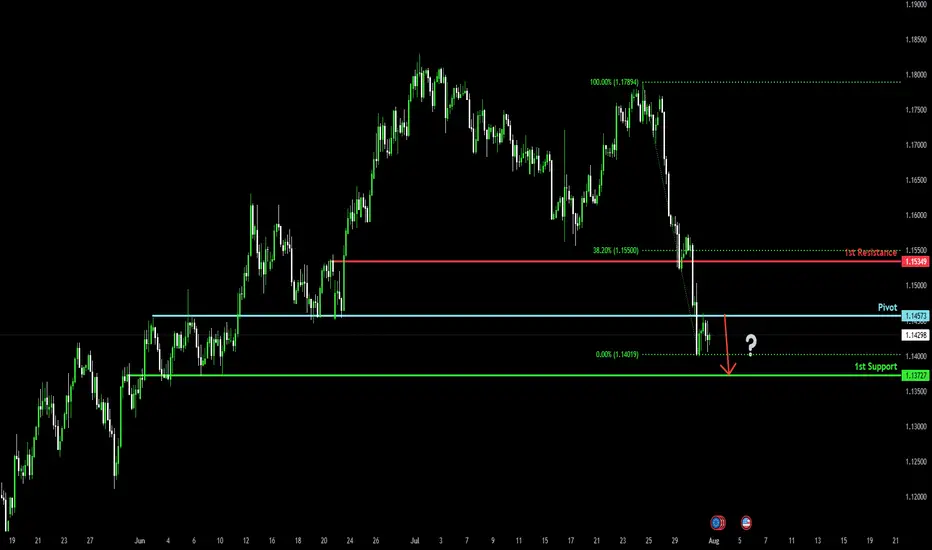
Bearish drop?The Fiber (EUR/USD) has rejected off the pivot and could potentially drop to the 1st support, which acts as an overlap support.
Pivot: 1.1457
1st Support: 1.1372
1st Resistance: 1.1534
Risk Warning:
Trading Forex and CFDs carries a high level of risk to your capital and you should only trade with money you can afford to lose. Trading Forex and CFDs may not be suitable for all investors, so please ensure that you fully understand the risks involved and seek independent advice if necessary.
Disclaimer:
The above opinions given constitute general market commentary, and do not constitute the opinion or advice of IC Markets or any form of personal or investment advice.
Any opinions, news, research, analyses, prices, other information, or links to third-party sites contained on this website are provided on an "as-is" basis, are intended only to be informative, is not an advice nor a recommendation, nor research, or a record of our trading prices, or an offer of, or solicitation for a transaction in any financial instrument and thus should not be treated as such. The information provided does not involve any specific investment objectives, financial situation and needs of any specific person who may receive it. Please be aware, that past performance is not a reliable indicator of future performance and/or results. Past Performance or Forward-looking scenarios based upon the reasonable beliefs of the third-party provider are not a guarantee of future performance. Actual results may differ materially from those anticipated in forward-looking or past performance statements. IC Markets makes no representation or warranty and assumes no liability as to the accuracy or completeness of the information provided, nor any loss arising from any investment based on a recommendation, forecast or any information supplied by any third-party.
Bullish bounce off pullback support?The Fiber (EUR/USD) is falling towards the pivot, which is a pullback support and could bounce to the 1st resistance.
Pivot: 1.1537
1st Support: 1.1456
1st Resistance: 1.1655
Risk Warning:
Trading Forex and CFDs carries a high level of risk to your capital and you should only trade with money you can afford to lose. Trading Forex and CFDs may not be suitable for all investors, so please ensure that you fully understand the risks involved and seek independent advice if necessary.
Disclaimer:
The above opinions given constitute general market commentary, and do not constitute the opinion or advice of IC Markets or any form of personal or investment advice.
Any opinions, news, research, analyses, prices, other information, or links to third-party sites contained on this website are provided on an "as-is" basis, are intended only to be informative, is not an advice nor a recommendation, nor research, or a record of our trading prices, or an offer of, or solicitation for a transaction in any financial instrument and thus should not be treated as such. The information provided does not involve any specific investment objectives, financial situation and needs of any specific person who may receive it. Please be aware, that past performance is not a reliable indicator of future performance and/or results. Past Performance or Forward-looking scenarios based upon the reasonable beliefs of the third-party provider are not a guarantee of future performance. Actual results may differ materially from those anticipated in forward-looking or past performance statements. IC Markets makes no representation or warranty and assumes no liability as to the accuracy or completeness of the information provided, nor any loss arising from any investment based on a recommendation, forecast or any information supplied by any third-party.

SELL EURUSD for bullish trend reversal SELL EURUSD for bullish trend reversal
STOP LOSS : 1.1808
Trade trade is based on false breakout and divergence.....
First what is false breakout, A false breakout in Forex occurs when the price breaks through a key level (like support or resistance) but quickly reverses and returns to its original range, often trapping traders who were expecting a continuation of the breakout. It's essentially a false signal, indicating a potential trend reversal or continuation, but the price doesn't follow through....
Secondly what is divergence ,In forex trading, divergence occurs when the price of a currency pair moves in one direction, while a technical indicator (like an oscillator) moves in the opposite direction. This mismatch can signal a potential trend reversal or weakening trend. There are two main types: bullish and bearish divergence.
On this trade we are taking it because we saw regular bearish divergence
Regular Bearish Divergence
In case of Regular Bearish Divergence:
* The Indicator shows Lower Highs
* Actual Market Price shows Higher Highs
We can see a strong divergence on the RSI already and There is a strong trend reversal on the daily time frame chart.....
The daily time frame is showing strength of trend reversal from this level resistance so we are looking for the trend reversal and correction push from here .....

EURUSD BUYING CORRECTION AND SHORTThe price is now at a strong support level and if it can be a double bottom it will retest the descending channel line and reach the orange resistance, but in the general direction the price prefers to fall due to breaking the black uptrend line. We also have a more beautiful scenario, which is if it can break the strong support we will go with the downward trend.

Elliott Wave Update: EURUSD Favors Weakness In To Support ZoneThe EURUSD favors upside in 3 swings from September-2022 low & should extend towards 1.1929 or higher against 1.13.2025 low. In 4-hour, it favors double correction lower from 7.01.2025 high to correct 5.12.2025 low. It favors short term pullback into 1.1512 – 1.1340 area in 7 swing pullbacks before continue rally in cycle from 1.13.2025 low. Above January-2025 low, it ended (1) at 1.0533 high, (2) at 1.0210 low, (3) at 1.1573 high, (4) at 1.1065 low & favors higher in (5). Within 4-hour, it placed 1 at 1.1830 high & correcting in 2 as double three correction before two more highs. It placed ((w)) at 1.1559 low in 3 swings zigzag correction. In ((w)), it ended (a) at 1.1659 low, (b) at 1.1714 high & (c) at 1.1559 low of 7.16.2025. Later, it unfolded expanded flat correction in ((x)) that ended at 1.1788 high of 7.24.2025. Within ((x)), it placed (a) at 1.1721 high, (b) at 1.1554 low & (c) in 5 swings at 1.1788 high.
Currently, it favors downside in ((y)) of 2 & expect sideways to lower in to support zone. It favors zigzag correction lower in ((y)) to finish 2 into extreme area before resume rally. Short term, it favors downside in (a) of ((y)) since 7.24.2025 high. In (a), it placed i at 1.1700 low, ii at 1.1771 high & favors downside in iii of (a) towards 1.1576 – 1.1569 area before bounce in iv. It expects a bounce soon in iv followed by one more push lower in v to finish (a) in 5 swings. Wave (a) of ((w)) should end near 1.1578 before bounce in (b) in 3 or 7 swings connector. The bounce in (b) should fail below 1.1788 high to extend lower in (c) into 1.1512 – 1.1340 area to finish correction. It should find next support into that area to rally higher as the part of daily sequence targeting 1.1929 or higher. We like to buy in to that area for next leg higher or at least 3 swings bounce. If it breaks above 7.01.2025 high, it expects two more highs to finish cycle from January-2025 before next pullback start.

EURUSD ahead of NFPEURUSD is still trading within the range established after Wednesday’s news.
We’re watching for a close above 1,1503, which would confirm a potential buying opportunity.
Today at 1:30 PM (London), the NFP data will be released, which could further impact price action - especially if a reversal is underway.
In case of a decline, the next key support level to watch is around 1,1346.

EUR-USD Free Signal! Buy!
Hello,Traders!
EUR-USD keeps falling and
The pair is locally oversold so
As the pair is retesting the
Horizontal support level
Of 1.1468 we can enter a
Long trade with Take Profit
Of 1.1510 and Stop Loss
Of 1.1443
Buy!
Comment and subscribe to help us grow!
Check out other forecasts below too!
Disclosure: I am part of Trade Nation's Influencer program and receive a monthly fee for using their TradingView charts in my analysis.

14-Day Mindset Challenge: Become a Top Trader — Day 114 Days. Challenge: How to Become a Mindset-Strong Trader
Day 1: The Power of Physical Exercise in Enhancing Trading Performance
Embarking on a trading journey demands more than just technical knowledge and market analysis; it requires a resilient and focused mindset. One often overlooked but incredibly powerful tool to develop this mental strength is physical exercise. Regular movement not only benefits your body but also profoundly influences your mental clarity, emotional stability, and overall performance as a trader.
When you engage in physical activity, your brain releases a cascade of chemicals that improve mood, focus, and resilience—crucial qualities for navigating the volatile world of trading. Think of your body and mind as interconnected systems: by strengthening your physical health, you lay a solid foundation for a sharper, more disciplined trading mindset. Over the next 14 days, committing to a simple, consistent exercise routine can transform how you approach your trading sessions, helping you stay calm under pressure, make better decisions, and recover quickly from setbacks.
Let's start!
How Physical Exercise Improves Your Trading Results
1. Boosts Endorphin Production for Positive Feelings
One of the most immediate benefits of exercise is the release of endorphins—natural chemicals that promote feelings of happiness and reduce stress and pain. This positive mood boost helps traders maintain a calm and focused mindset, even amidst market volatility. Scientific studies have shown that regular physical activity increases endorphin levels, which can combat anxiety and improve overall emotional resilience.
2. Enhances Insulin Activity and Energy Levels
Exercise improves insulin sensitivity, enabling your body to more efficiently process glucose for energy. This increased metabolic efficiency helps combat fatigue and sustains mental alertness during prolonged trading sessions. Research indicates that physically active individuals experience higher energy levels and better stamina, which are vital for maintaining attention and decision-making capacity.
3. Reduces Disease Risk and Promotes Long-Term Health
Regular physical activity reduces the risk of cardiovascular disease, diabetes, and other chronic health issues. By maintaining good health, traders are less likely to experience unexpected absences due to illness and can trade consistently over time. Scientific evidence supports that healthier individuals have better cognitive function and emotional stability, both crucial for trading success.
4. Boosts Brain Health and Cognitive Function
Exercise increases heart rate and blood flow, delivering more oxygen and nutrients to the brain. Numerous studies have demonstrated that physical activity stimulates the growth of new neural connections and enhances neuroplasticity—the brain’s ability to adapt and learn. This leads to improved memory, concentration, and problem-solving skills, all essential for analyzing markets and executing trades efficiently.
5. Enhances Stress Regulation and Emotional Control
Research shows that regular exercise helps regulate the hypothalamic-pituitary-adrenal (HPA) axis, which controls stress responses. By improving your body’s ability to handle stress, exercise reduces the likelihood of emotional reactions such as impulsivity or panic during trading. This emotional regulation is key to maintaining discipline and sticking to your trading plan under pressure.
6. Improves Sleep Quality
Quality sleep is fundamental for cognitive performance and emotional regulation. Scientific studies have consistently shown that physical activity, especially aerobic exercise, improves sleep quality and duration. Better sleep enhances focus, decision-making, and emotional resilience—traits that directly impact trading performance.
7. Promotes Neurotransmitter Balance
Exercise influences the production and regulation of neurotransmitters such as dopamine, serotonin, and norepinephrine. These chemicals play a vital role in mood, motivation, and alertness. Balanced neurotransmitter levels support a positive mindset, resilience to setbacks, and sustained motivation—key ingredients for consistent trading.
8. Increases Resilience to Market Stressors
Finally, regular physical activity builds overall resilience—both physically and mentally. This resilience helps traders recover quickly from losses, handle unexpected market shocks, and stay committed to their strategies without succumbing to frustration or panic.
Incorporating these scientifically-backed points emphasizes how exercise not only benefits physical health but also fundamentally enhances the mental and emotional capacities critical for successful trading.
Taking Action: Your 14-Day Exercise Implementation Plan
1. Decide Your Exercise Routine
Choose activities that you enjoy and can commit to every day for the next two weeks. Whether it’s walking, jogging, weightlifting, yoga, Pilates, push-ups, mountain climbers, or any other physical activity—what matters is consistency. Pick something that makes you feel energized and motivated.
2. Set a Daily Time Commitment
Determine how much time you can dedicate each day—start with 30 minutes to 1 hour. Make it a non-negotiable part of your daily schedule. For example, you might decide to go for a brisk walk in the morning, do bodyweight exercises at home, or hit the gym. The goal is to establish a routine that becomes a natural part of your day.
3. Use Reminders and Push Through Initial Discomfort
Especially during the first two weeks, it’s normal to feel some resistance or emotional stress about starting new habits. Set reminders on your phone or calendar to prompt you. Be patient and persistent—initial discomfort will fade as your body adapts. Once exercise becomes a habit, it will feel less like a chore and more like a source of strength.
Final Tips for Success
Start Small, Progress Gradually: Don’t overcommit at the beginning; build gradually to avoid burnout.
Stay Consistent: Consistency beats intensity—daily effort compounds over time.
Track Your Progress: Keep a journal or use an app to monitor your activity and observe how you feel over the days.
Enjoy the Process: Find joy in the movement itself. As it becomes part of your routine, you'll notice improvements not only physically but also in your trading mindset.
Conclusion
A 14-day commitment to physical exercise can be a game-changer for your trading mindset. By boosting endorphins, increasing energy, enhancing brain function, and reducing health risks, you set the stage for more disciplined, confident, and resilient trading. Embrace this challenge—your mind and your portfolio will thank you.
✅ Follow me and save this educational post: "14-Day Mindset Challenge: Become a Top Trader — Day 1". Tomorrow, I'll be releasing Day 2 of the transformation... Stay tuned!
✅ Please share your thoughts about this article in the comments section below and HIT LIKE if you appreciate my post. Don't forget to FOLLOW ME; you will help us a lot with this small contribution.

Bullish reversal?EUR/USD has bounced off the support level, which serves as a pullback support and could rise from this level to our take-profit target.
Entry: 1.1534
Why we like it:
There is a pullback support.
Stop loss: 1.1455
Why we like it:
There is a multi-swing low support.
Take profit: 1.1655
Why we like it:
There is a pullback resistance that aligns with the 50% Fibonacci retracement.
Enjoying your TradingView experience? Review us!
TradingView (www.tradingview.com)
Please be advised that the information presented on TradingView is provided to Vantage (‘Vantage Global Limited’, ‘we’) by a third-party provider (‘Everest Fortune Group’). Please be reminded that you are solely responsible for the trading decisions on your account. There is a very high degree of risk involved in trading. Any information and/or content is intended entirely for research, educational and informational purposes only and does not constitute investment or consultation advice or investment strategy. The information is not tailored to the investment needs of any specific person and therefore does not involve a consideration of any of the investment objectives, financial situation or needs of any viewer that may receive it. Kindly also note that past performance is not a reliable indicator of future results. Actual results may differ materially from those anticipated in forward-looking or past performance statements. We assume no liability as to the accuracy or completeness of any of the information and/or content provided herein and the Company cannot be held responsible for any omission, mistake nor for any loss or damage including without limitation to any loss of profit which may arise from reliance on any information supplied by Everest Fortune Group.


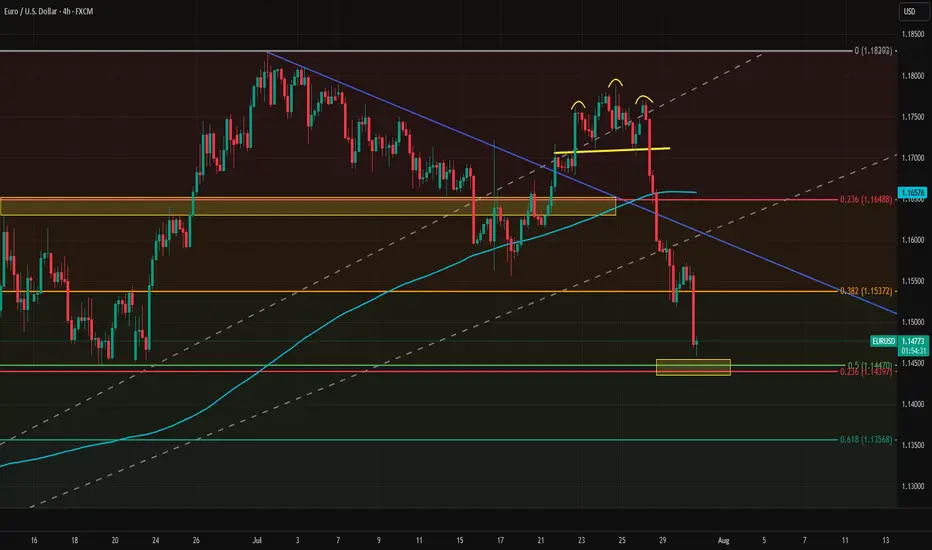
EURUSD - 4-Hour Chart with Order Block Reversal StrategyThe EUR/USD 4-hour chart shows a significant bearish retracement approaching a well-defined order block zone, which represents a potential strong support area where major buyers may step in.
Price has experienced a clear downtrend following a break of structure (BOS) from the recent high near 1.18000 into the order block area around 1.13900 - 1.14150. This order block acts as a demand zone where smart money is anticipated to accumulate buy orders, making it a critical level to watch for potential market reversal.
The trading plan anticipates price will test this order block support and generate bullish reversal signals such as price rejection candlesticks or increased buying volume. Confirmation at this zone sets up a potential long trade aiming for a significant retracement to the previous weak high near 1.19200, targeting a strong risk-to-reward opportunity.
Risk management is vital, placing stop losses just below the lower boundary of the order block to protect against false breakouts or further downside continuation.
This plan combines market structure analysis, smart money concepts of order blocks, and technical confirmation to capture a high-probability reversal trade. Traders should patiently wait for clear reversal signals before entry and monitor price action closely within the order block for optimal trade timing.

Key Resistance ZoneMarked near 1.15800, just below the upper boundary of the channel.
A red arrow and label indicate this as a potential sell zone.
Price is expected to retest this area before dropping again.
Projected Move (Bearish):
Price may:
1. Push up into the resistance zone.
2. Reject strongly and fall back.
3. Continue downward with minor pullbacks, following the blue arrows.

Is the EURUSD in a downtrend?
Hi my dears
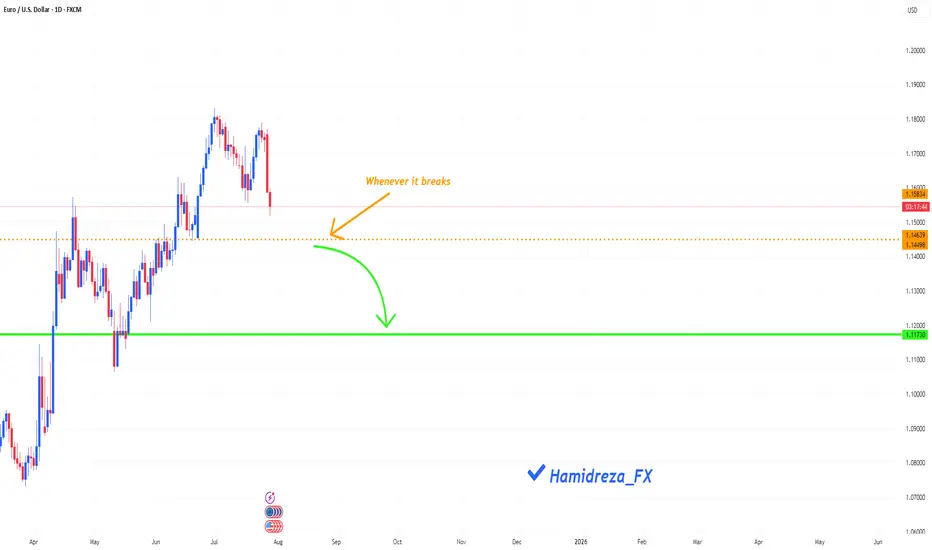
It seems that the Eurusd has started a downward and corrective trend, however, the orange line condition must be met in order to enter a good trade with certainty.
I would be happy to hear your opinion.
4h chart out lookEUR/USD has broken down from a Rising Wedge pattern on the 4H chart, signaling a potential bearish move. As long as price stays below 1.1600, downside targets near 1.0900–1.0850 remain in play

EURUSD Tests Key Support Ahead of FOMCFollowing the strong U.S. GDP data, EURUSD dropped to the 1.1450 support level. This area is significant, as it marks the convergence of the 23.6% retracement from the January–July move and the 50% retracement from the May–July move.
While the FOMC decision will ultimately shape the direction, from a technical perspective, a long position may offer a favorable risk/reward setup at current levels. A stop just below the key support would help manage downside risk.
Will the Euro collapse on US Tariffs? Traders eye 1.15The EURUSD is under pressure today, dropping nearly half a percent. This follows the new US–EU trade deal that introduces a 15 percent baseline import tariff on most goods. That means Americans buying European products must now pay 15 percent more.
Naturally, markets are adjusting. When one side of a trade deal takes the hit, its currency often weakens. In this case, the euro is sliding as the cost of EU exports rises. If the euro were to fall by the full 15 percent in response, we could see EURUSD drop to parity again. That would balance the new cost for American buyers, making European goods just as affordable as before.
Still, the technical outlook remains neutral. The trend on EURUSD remains bullish until a break below 1.15 occurs. If that happens, it could open the door to 1.12 or even 1.10. Until then, traders watching the chart may stay cautious.
One reason why the EURUSD might gain is that President Trump continues to pressure the Federal Reserve to cut interest rates. If the Fed caves while inflation is still rising, the US could face the same issues that have plagued countries like Turkey, where political pressure has undermined monetary stability and triggered runaway inflation.
In that case, the euro might strengthen, pushing EURUSD back toward 1.20 or higher.
Is this the peak for EURUSD or just a pause before the next leg higher? The next few weeks will reveal the answer.
This content is not directed to residents of the EU or UK. Any opinions, news, research, analyses, prices or other information contained on this website is provided as general market commentary and does not constitute investment advice. ThinkMarkets will not accept liability for any loss or damage including, without limitation, to any loss of profit which may arise directly or indirectly from use of or reliance on such information.
