EUR/USD Will Continue Melting Be Sure To Be Part Of That!Here is my thought of EURUSD chart today. I think that this pair can go down further more specially after breaking this strong area of support and old resistance. as shown on the chart we can wait for the price to come back again and retest this area once and then this will be the best place to enter a sell trade. I am targeting around 250n pips in this trade. as I said I will wait for a retest and a good bearish price action and from there I will enter a sell trade.
USDEUR trade ideas

Sell eurusdBearish wave expected now
Daily support trend already breaks
Still monthly overbought pair
Strong bearish correction expected

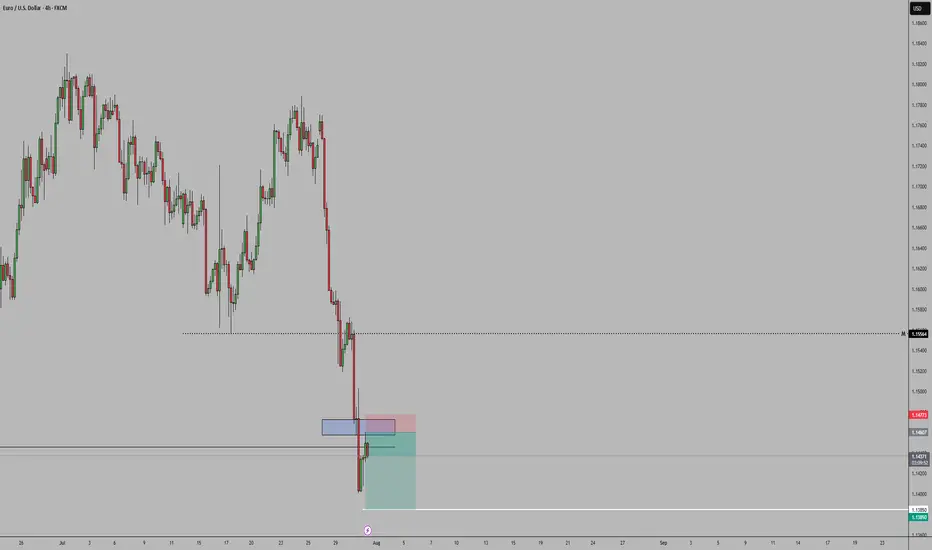
LONG ON EUR/USDEUR/USD is currently at a major demand level after sweeping sell side liquidity.
The Dxy (Dollar) is overall bearish. I expect the dollar to fall and EUR/USD to rise to the previous high / supply level for over 200-300 pips.
News most likely will affect this pair in terms of volatility.

EURUSD_1D_SellEurodollar Analysis Medium-term Time Elliott Wave Analysis Style The market can enter a downtrend due to the completion of five ascending waves, which will be in the form of three ABC waves Important and main resistance number 1.1666 Target 1.0800

EUR/USD Robbery Blueprint Bear Strike Activated!💣🎯Operation Fiber Down: EUR/USD Robbery Blueprint (Day Trade Edition) 💰🔫
🚨 Thieves, Hustlers & Chart Bandits Assemble! 🚨
🌍 Hi! Hola! Ola! Bonjour! Hallo! Marhaba! 🌍
Welcome back to another Thief Trading Operation, where the money never sleeps—and neither do we. Let’s break into the vault of EUR/USD “The Fiber” with surgical precision. 🧠💼🕶️
🧨 THE MASTER ROBBERY PLAN: EUR/USD SHORT STRIKE 🔍💸
💀 Market Bias: Bearish – Trend Reversal + Supply Trap Setup
🎯 Target: 1.15800
🛑 Stop-Loss: Near Swing High (around 1.17400 – 3H chart view)
🕓 Timeframe Focus: 15m / 30m / 3H
🧭 ENTRY ZONE:
👣 Plan your entry from recent high retests—that’s where the big money bulls get trapped.
🎯 Use Sell Limit Orders (DCA style / Layered Limit Orders) like a true thief setting up tripwires.
💼 RISK STRATEGY:
💡 SL should match your lot size and order count—not one-size-fits-all!
📌 Place above key structure or swing level (e.g. 1.17400) based on timeframe.
🔍 BEHIND THE SCENES – THE WHY:
The EUR/USD "Fiber" pair is showing all the classic signs of a trend shift and bear raid setup, including:
📰 Fundamentals weakening the Euro
💣 COT Report reveals institutional exits
🍂 Seasonal Bias points to downward trend
📉 Intermarket Pressure from bond yields & USD strength
📊 Sentiment turning overly bullish = trap zone
⛽ Storage & Inventory imbalances adding fuel
📌 Reminder: Before any robbery, study the layout—Macro, Fundamentals, Sentiment, and Intermarket are your blueprint.
🚨 HEIST ALERT – PROTECT THE LOOT:
🕰️ High-Impact News Events? Tighten up!
💼 Don’t take fresh entries during releases.
🔐 Use Trailing SLs to lock in profits.
🎯 Exit with grace before the sirens start.
⚡🔥JOIN THE CREW, BOOST THE LOOT🔥⚡
💥 Smash the Boost Button 💥 if you're vibing with the Thief Trading Movement.
We ain’t just trading—we’re executing strategic robberies on the market’s weaknesses.
🧠💪 Every like = more power to the crew. Every comment = a new map to a vault.
We rob, retreat, and repeat. Let’s make money with skill, not luck. 🕶️💰🚁
⚠️ LEGAL COVER (For the Lawyers 😏):
This plan is not investment advice, just an organized heist blueprint by chart robbers.
Always manage your own risk and update your plan as the market evolves.
🕶️ Stay ready for the next master plan... Until then, keep your charts clean and your stops tight. 🕶️💣📉
– Thief Trader Out 🐱👤🚀

EUR/USD Rising Wedge Break Now Oversold on H4Markets have moved quickly this week and it's been a very bearish outlay for EUR/USD since last Thursday's ECB rate decision. The pair set a lower-high around that announcement and then the day after saw bears make another push, with a key hold at a Fibonacci level plotted at 1.1748. I've been highlighting that level since before the Q3 open and so far, that's the spot that bulls have failed to leave behind.
The quandary now is just how quickly this move has come on. The USD is working on its strongest month since April of 2022 and that prior instance was driven by the Fed starting a rate hike cycle, which clearly isn't happening here. Also complicating the matter is the fact that RSI on the four-hour chart has already pushed into oversold territory, making the prospect of chasing-lower a daunting item.
We've already seen an instance of prior support coming in as resistance with the hold of the daily high at 1.1457. With NFP tomorrow, perhaps the more attractive scenario would be a larger pullback which could then highlight resistance potential at either 1.1500 or 1.1560. - js

EURUSDWe have a strong bearish sentiment for EURUSD this week, so meaning big instituttions are selling the pair so we follow their lead. And we can see that we just broke below a support which is now acting as a resistance, more bearish momentum continuation can we expected
EURUSD ~ Real Time Elliott Wave UpdatesThis is an update of a chart I had previously posted. Here, we can see that Wave 1(Red) has already completed and a pullback occurred soon after, marked as Wave 2(Red) or Wave A(Blue). This has two markings because on one hand it could be a Zigzag formation or it could be the first wave of a Flat correction. All other analysis remains the same as I had previously posted. Sentiment still remains a sell.
@fabrx900

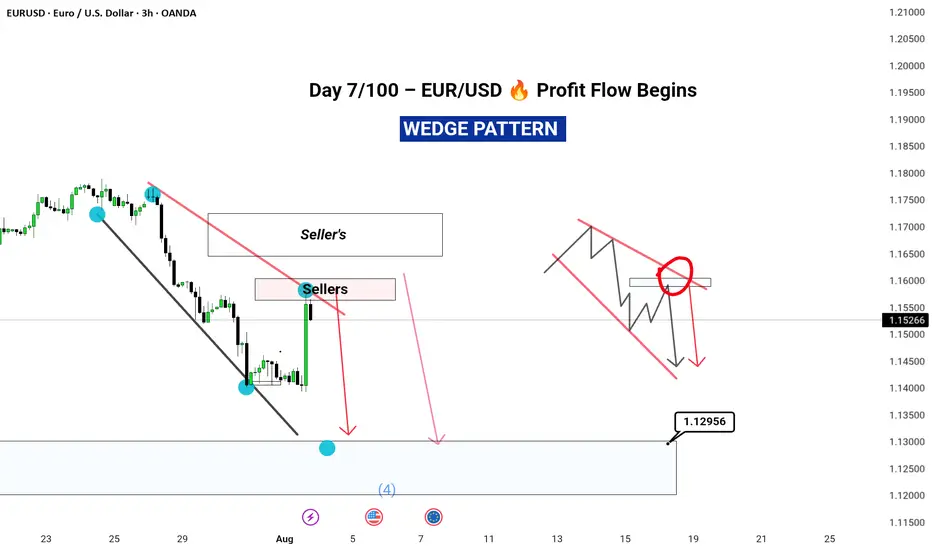
“Exactly What I Saw” promises value and transparency.
In today's analysis, I’ve identified a clear completion of Wave D, securing a 3% ROI across just two trades – all before the move unfolded.
🔍 What’s inside this breakdown?
• Multi-timeframe analysis: Weekly ➝ Daily ➝ 4H ➝ 1H
• Elliott Wave structure with confluence zones
• Trade psychology at key turning points
• Exact entry & exit insights explained
• Risk management for consistent returns
---
⚡ Highlights:
Precise reversal spotted before it was obvious
No indicator clutter – just clean, confident price action
Part of my 100-day breakdown series: real, raw, and repeatable setups
---
👣 Day 7 of 100 is just the beginning.
Tap Follow to stay ahead of the market – one wave at a time.
#EURUSD #ForexAnalysis #ElliottWave #Forex #TradingViewUK #SwingTrading #PriceAction #RiskReward #FXMindset #ForexTradersIndia #ForexEducation
EURUSD: Will Start Growing! Here is Why:
It is essential that we apply multitimeframe technical analysis and there is no better example of why that is the case than the current EURUSD chart which, if analyzed properly, clearly points in the upward direction.
Disclosure: I am part of Trade Nation's Influencer program and receive a monthly fee for using their TradingView charts in my analysis.
❤️ Please, support our work with like & comment! ❤️

Trailing Stops:Let trades developTrailing stops are one of the most underused tools in a trader’s playbook. Most traders spend hours obsessing over entries, but then wing the exit or bail too early the moment a red candle appears. That’s where trailing stops come in. They give your trades room to breathe, while gradually reducing risk as price moves in your favour.
If you’ve ever caught a good move and felt unsure about how long to hold it, this one’s for you.
Here are three practical ways to trail your stop, stay in the trade, and help manage profitable trades objectively.
1. Trail Behind Structure
This is the simplest and most intuitive method. As the trade moves in your favour, you move your stop just behind the most recent swing high or low. In a long trade, that means raising your stop to sit just below the latest higher low. In a short, you drop it just above the most recent lower high.
This approach works best in clean, trending conditions. It gives the trade room to develop naturally without forcing you to guess the top. You won’t capture the absolute high, but you’ll often stay in the move longer than most.
It also keeps you in rhythm with the market. If the structure is broken, it’s a pretty good sign that the trend is changing or stalling and that’s a logical place to step aside.
Example:
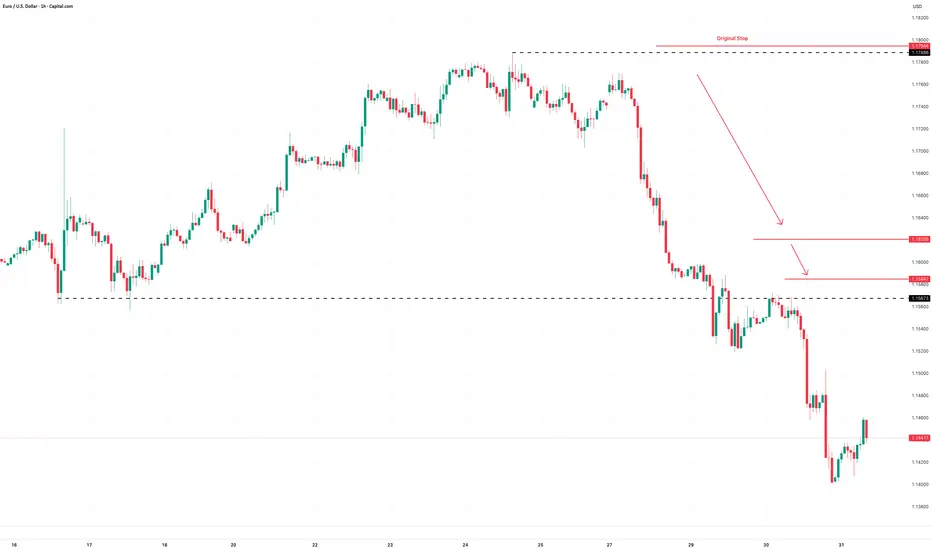
Here’s a clean example of using structure to trail stops on a momentum trade. The entry came on a break and retest of resistance, with the initial stop placed just below the retest level. As the trade moved higher, a series of higher swing lows developed, providing clear reference points to adjust the stop.
It’s not designed to catch the exact top and that’s fine. The goal is to follow price action with minimal lag, using objective structure rather than guesswork.
EUR/USD Hourly Candle Chart
Past performance is not a reliable indicator of future results
2. Use Moving Averages
Trailing stops don’t have to follow every single swing. Sometimes, a smoother option is better, especially if you want to stay in a move that’s trending hard. That’s where moving averages come in.
A short-term exponential moving average like the 9 or 21 EMA can act as a dynamic trailing stop. As long as price remains above the average, the trend is intact and you stay in. If price closes below the EMA in a long trade, or you get a crossover in the opposite direction, that can signal an exit or at least a scale-down.
This method works best in fast, directional markets. It won’t suit every condition, but when the move is strong, letting a trade run along the moving average keeps things simple and stress-free.
Example:
In this short-term 5-minute chart example, the 21 EMA acts as a dynamic trailing stop. There are two common approaches. You can wait for a candle to close below the 21 EMA, or use a crossover trigger where the 9 EMA crosses under the 21 EMA. The choice depends on how tightly you want to manage the trade and how much room you are willing to give it.
S&P 500 5min Candle Chart
Past performance is not a reliable indicator of future results
3. Volatility-Based Stops (ATR)
When the market gets fast and messy, a fixed stop can either get hit too easily or feel too far away. That’s where volatility-based stops come in. The most common tool for this is the Average True Range (ATR).
Instead of using swing points, you trail your stop a set number of ATRs behind the current price. If ATR is rising, your stop gives the trade more room. If volatility shrinks, the stop tightens naturally. It’s an adaptive approach that works well in conditions where price is expanding or moving fast.
A popular setting is to use two times the current ATR value, but you can adjust it to suit your timeframe or risk tolerance.
Example:
This is a classic wedge breakout setup in gold. A trailing stop set at two times the ATR helps manage risk while giving the trade enough room to breathe. As price moves in your favour, the stop tightens automatically based on volatility. It’s worth remembering that trailing stops are only adjusted in one direction. Once set, they follow the move but are never loosened, which means the stop will eventually take you out as momentum fades or the market turns.
Gold Daily Candle Chart
Past performance is not a reliable indicator of future results
Decide on Your Technique BEFORE You Place the Trade
There’s no perfect way to trail a stop. Each method has its strengths. Structure-based stops keep you aligned with price action. EMAs are smooth and simple. ATR lets volatility do the work for you.
The most important thing is to make a decision before you place the trade. Know whether you’re using a manual swing method or a dynamic indicator. Know what would trigger a move in your stop, and what would keep it steady. Avoid changing the plan just because the trade gets emotional.
Trailing stops give you freedom. They let you step back, protect your capital and give your best trades a real chance to develop. Used properly, they enhance trade management consistency.
Disclaimer: This is for information and learning purposes only. The information provided does not constitute investment advice nor take into account the individual financial circumstances or objectives of any investor. Any information that may be provided relating to past performance is not a reliable indicator of future results or performance. Social media channels are not relevant for UK residents.
Spread bets and CFDs are complex instruments and come with a high risk of losing money rapidly due to leverage. 85.24% of retail investor accounts lose money when trading spread bets and CFDs with this provider. You should consider whether you understand how spread bets and CFDs work and whether you can afford to take the high risk of losing your money.
Bullish reversal off pullback support?The Fiber (EUR/USD) has bounced off the pivot, which is a pullback support, and could rise to the 1st resistance, which is a pullback resistance.
Pivot: 1.1537
1st Support: 1.1456
1st Resistance: 1.1659
Risk Warning:
Trading Forex and CFDs carries a high level of risk to your capital and you should only trade with money you can afford to lose. Trading Forex and CFDs may not be suitable for all investors, so please ensure that you fully understand the risks involved and seek independent advice if necessary.
Disclaimer:
The above opinions given constitute general market commentary, and do not constitute the opinion or advice of IC Markets or any form of personal or investment advice.
Any opinions, news, research, analyses, prices, other information, or links to third-party sites contained on this website are provided on an "as-is" basis, are intended only to be informative, is not an advice nor a recommendation, nor research, or a record of our trading prices, or an offer of, or solicitation for a transaction in any financial instrument and thus should not be treated as such. The information provided does not involve any specific investment objectives, financial situation and needs of any specific person who may receive it. Please be aware, that past performance is not a reliable indicator of future performance and/or results. Past Performance or Forward-looking scenarios based upon the reasonable beliefs of the third-party provider are not a guarantee of future performance. Actual results may differ materially from those anticipated in forward-looking or past performance statements. IC Markets makes no representation or warranty and assumes no liability as to the accuracy or completeness of the information provided, nor any loss arising from any investment based on a recommendation, forecast or any information supplied by any third-party.

EURUSD H1 I Bullish Bounce Off Based on the H4 chart analysis, we can see that the price is testing our buy entry at 1.15782, which is a swing low support.
Our take profit will be at 1.1629, which is a pullback resistance level.
The stop loss will be placed at 1.1547, below the swing low support.
High Risk Investment Warning
Trading Forex/CFDs on margin carries a high level of risk and may not be suitable for all investors. Leverage can work against you.
Stratos Markets Limited (tradu.com ):
CFDs are complex instruments and come with a high risk of losing money rapidly due to leverage. 65% of retail investor accounts lose money when trading CFDs with this provider. You should consider whether you understand how CFDs work and whether you can afford to take the high risk of losing your money.
Stratos Europe Ltd (tradu.com ):
CFDs are complex instruments and come with a high risk of losing money rapidly due to leverage. 66% of retail investor accounts lose money when trading CFDs with this provider. You should consider whether you understand how CFDs work and whether you can afford to take the high risk of losing your money.
Stratos Global LLC (tradu.com ):
Losses can exceed deposits.
Please be advised that the information presented on TradingView is provided to Tradu (‘Company’, ‘we’) by a third-party provider (‘TFA Global Pte Ltd’). Please be reminded that you are solely responsible for the trading decisions on your account. There is a very high degree of risk involved in trading. Any information and/or content is intended entirely for research, educational and informational purposes only and does not constitute investment or consultation advice or investment strategy. The information is not tailored to the investment needs of any specific person and therefore does not involve a consideration of any of the investment objectives, financial situation or needs of any viewer that may receive it. Kindly also note that past performance is not a reliable indicator of future results. Actual results may differ materially from those anticipated in forward-looking or past performance statements. We assume no liability as to the accuracy or completeness of any of the information and/or content provided herein and the Company cannot be held responsible for any omission, mistake nor for any loss or damage including without limitation to any loss of profit which may arise from reliance on any information supplied by TFA Global Pte Ltd.
The speaker(s) is neither an employee, agent nor representative of Tradu and is therefore acting independently. The opinions given are their own, constitute general market commentary, and do not constitute the opinion or advice of Tradu or any form of personal or investment advice. Tradu neither endorses nor guarantees offerings of third-party speakers, nor is Tradu responsible for the content, veracity or opinions of third-party speakers, presenters or participants.

EURUSD Forecast📊 Technical Analysis
● FX:EURUSD EURUSD confirmed a double rejection below long-term resistance with two lower highs and broke channel support at 1.1567.
● Price is now trending within a descending channel toward 1.1363, with lower targets pointing into the 1.12–1.11 demand zone.
💡 Fundamental Analysis
● US Q2 GDP surprised to the upside, reinforcing the Fed’s hawkish tone, while Eurozone CPI inflation cooled below forecast.
● Diverging central bank trajectories continue to widen yield differentials in favor of the dollar, sustaining bearish euro flows.
✨ Summary
Short bias confirmed below 1.1567. Break of 1.1450 opens path to 1.1363 ➜ 1.1200 zone. Watch for rallies to fade below trendline.

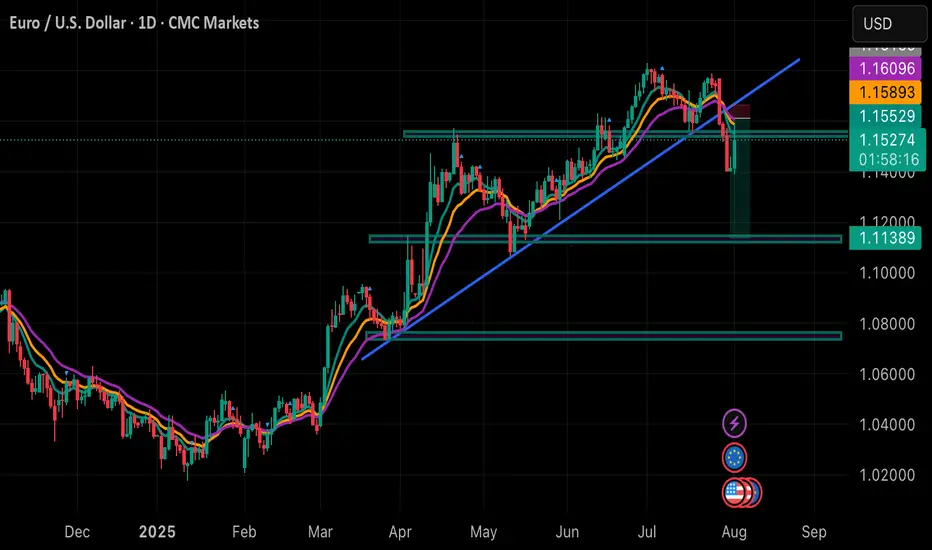
PROFIT TAKING ON EURUSD BUT UPTREND REMAINS INTACT Looking at the daily timeframe of EURUSD we can see that price action didn't take out liquidity at the Blue rectangle zone which was the all time high for EURUSD.
Going forward,I can anticipate signs of profit taking or hedging by market players or institutions but on general basis the uptrend of EURUSD is still intact.
So I will be anticipating a pullback to the desired zones which I indicated with a red rectangle and later we look for buying opportunities.
Targets are:1.15900,1.14900

Eurusd sell pending order set already. Hopefully on mondayBased on my technical analysis, I strongly speculate EURUSD fall on Monday.
EURUSD likely to have pullbackEURUSD formed a 2 long Big bearish candles, now it is at the support level. It will pullback to fib 0.5 and then further declines from trendline resistance.

EUR USD buy setupHello traders!
This is a possible reversal scenario. Today, we had a pump following Trump’s EU deal, which gave the market a bullish push.
However, just like every mountain climb requires a descent, I’m considering this setup as a potential correction.
⚠️ Important: Keep in mind that this trade goes against the trend! So, it's crucial to wait for a confirmed price close above the marked line before taking action.
If the setup offers a favorable risk-to-reward ratio, you may consider an instant execution. If not, you can place a buy limit order instead.
Also, keep an eye on the upcoming JOLTS Job Openings data—it could shift the market sentiment significantly.
Disclaimer: This is just an idea and not a trading signal. It’s shared for educational and backtesting purposes only. Please do your own analysis before making any trading decisions.

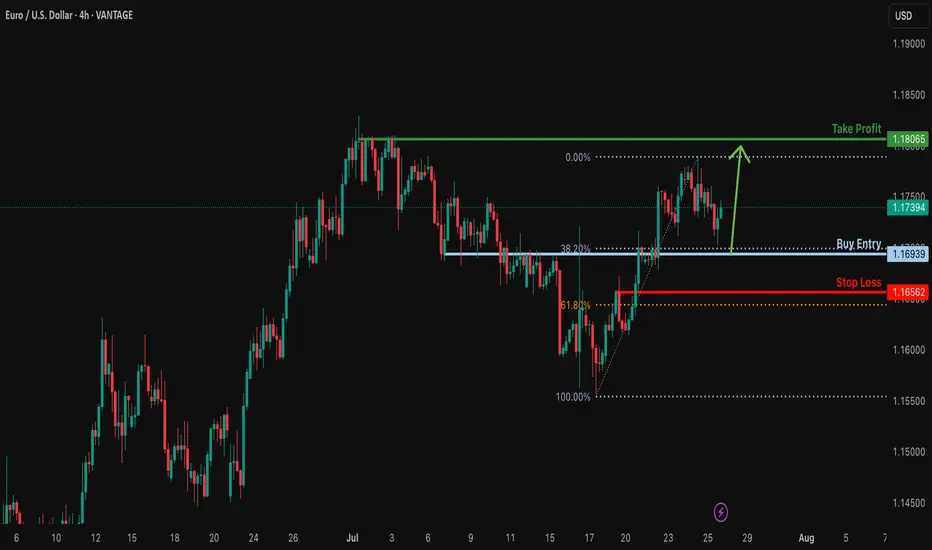
Bullish bounce off 38.2% Fibonacci support?EUR/USD is falling towards the support level, which is an overlap support that aligns with the 38.2% Fibonacci retracement and could bounce from this level to our take-profit.
Entry: 1.1693
Why we like it:
There is an overlap support that lines up with the 38.2% Fibonacci retracement.
Stop loss: 1.1656
Why we like it:
There is a pullback support that is slightly above the 61.8% Fibonacci retracement.
Take profit: 1.1806
Why we like it:
There is a swing high resistance.
Enjoying your TradingView experience? Review us!
Please be advised that the information presented on TradingView is provided to Vantage (‘Vantage Global Limited’, ‘we’) by a third-party provider (‘Everest Fortune Group’). Please be reminded that you are solely responsible for the trading decisions on your account. There is a very high degree of risk involved in trading. Any information and/or content is intended entirely for research, educational and informational purposes only and does not constitute investment or consultation advice or investment strategy. The information is not tailored to the investment needs of any specific person and therefore does not involve a consideration of any of the investment objectives, financial situation or needs of any viewer that may receive it. Kindly also note that past performance is not a reliable indicator of future results. Actual results may differ materially from those anticipated in forward-looking or past performance statements. We assume no liability as to the accuracy or completeness of any of the information and/or content provided herein and the Company cannot be held responsible for any omission, mistake nor for any loss or damage including without limitation to any loss of profit which may arise from reliance on any information supplied by Everest Fortune Group.
My opinion on the euro to dollarI think the trend is bearish in the medium term, although we may have an upward correction first, so you can wait to enter when shorting.

Eurusd
---
### 💥 The Hidden Secret of Pro Traders:
Most traders jump straight into low timeframes like M15 or H1, chasing signals...
But the market's real moves? They start on the **higher timeframes** like weekly or Daily. 🤯
👉 **Golden Formula:**
- 🧭 **Higher Timeframe = Direction**
(Is the market trending up, down, or just ranging?)
- ⏱️ **Lower Timeframe = Precise Entry**
(When to get in? Where to place stops?)
Trading without the higher timeframe is like driving without a map. Sure, you're moving—but do you know *where you're going*?
---
### 📌 Quick Breakdown:
- Start on **2D or Daily** charts to define:
- Strong support/resistance zones
- Overall market structure
- Clear chart patterns
Then drop into **lower timeframes** (like H1 or M15):
This is where sniper entries and clean risk/reward setups live.
Pro Tip:
> "Your trading plan starts at the top... and finds its perfect shot at the bottom."
Be the sniper, not the spray-and-pray trader.
---

EURUSD: NEW WEEK TECHNICAL BIAS (MARKET OPEN)REVIEW SUMMARY
▪︎ On the Higher Timeframes (HTFs), the Buy-Side Bias Environment (BBE) remains intact, with no confirmed breach of the ongoing Ascend Sequence.
▪︎ However, the 4H chart reveals a developing Descend Sequence within a steep, channel-like structure, recently triggering a Rejection Block (Activated).
▪︎ If this Rejection Zone holds, I expect a potential Trend Shift that resumes the broader Ascend Sequence.
▪︎ Otherwise, a decline into the discount region near 1.16523 may unfold before any significant rally toward the primary Target Zone.
▪︎ Invalidation occurs with a structural breakdown to and below 1.15571, which opens the door toward the pending ARBs lower.
📌 This is not trade advice. Just technical observations and market perspective. Validate independently before acting.
#IntelEdgeProtocol

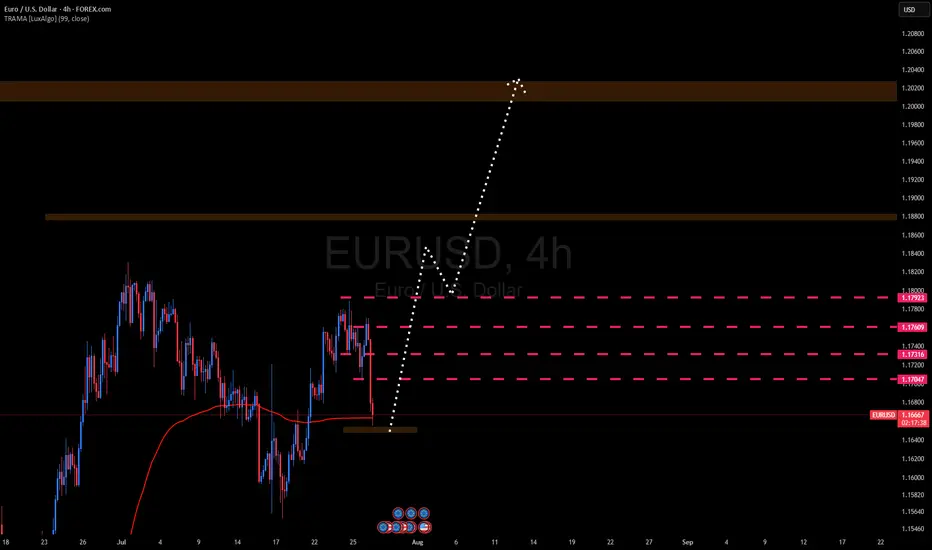
EURUSD BULLISH TREND 28-15 JUL-2025EUR/USD is expected to enter a bullish phase, with an upward move likely to start from the 1.16557–1.16486 range. The pair is projected to rise throughout the week, potentially reaching the 1.20051–1.20200 levels. As long as it continues toward that zone, the trend remains bullish