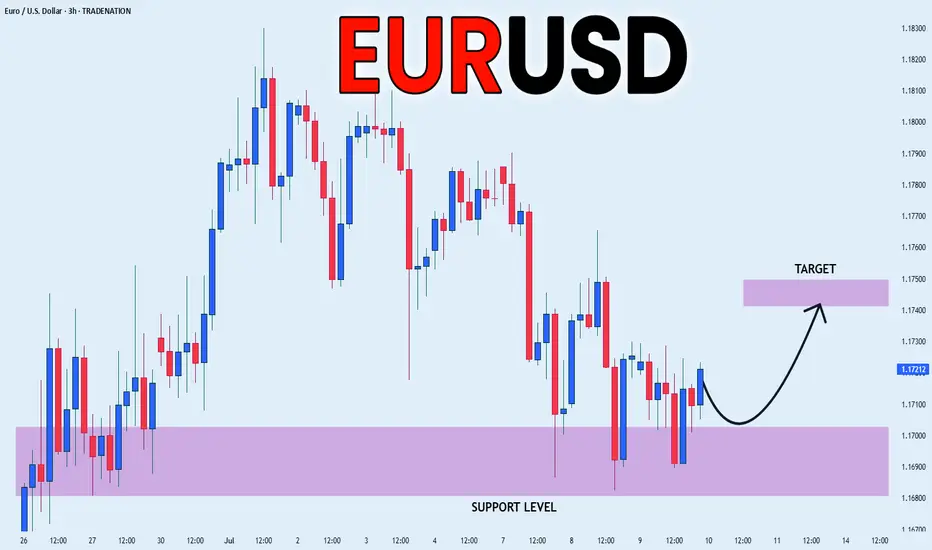
EURUSD sideways consolidation support at 1.1640The EURUSD currency pair continues to exhibit a bullish price action bias, supported by a sustained rising trend. Recent intraday movement reflects a sideways consolidation breakout, suggesting potential continuation of the broader uptrend.
Key Technical Level: 1.1640
This level marks the prior consolidation range and now acts as pivotal support. A corrective pullback toward 1.1640 followed by a bullish rejection would reinforce the bullish trend, targeting the next resistance levels at:
1.1830 – Near-term resistance
1.1900 – Minor swing high
1.1940 – Longer-term bullish objective
On the other hand, a decisive daily close below 1.1640 would invalidate the bullish setup, shifting the outlook to bearish in the short term. This could trigger a deeper retracement toward:
1.1590 – Initial support
1.1530 – Key downside target
Conclusion:
As long as 1.1640 holds as support, the technical outlook remains bullish, favoring long positions on dips. A confirmed break below this level would signal a shift in sentiment and open the door to a corrective pullback phase.
This communication is for informational purposes only and should not be viewed as any form of recommendation as to a particular course of action or as investment advice. It is not intended as an offer or solicitation for the purchase or sale of any financial instrument or as an official confirmation of any transaction. Opinions, estimates and assumptions expressed herein are made as of the date of this communication and are subject to change without notice. This communication has been prepared based upon information, including market prices, data and other information, believed to be reliable; however, Trade Nation does not warrant its completeness or accuracy. All market prices and market data contained in or attached to this communication are indicative and subject to change without notice.
USDEUR trade ideas


EURUSD : Sell signalThe SELL signal was triggered yesterday. The price stayed below the threshold, which equals confirmation.
The R/R is good - remember the priority here is the BIG fish.
Good luck.

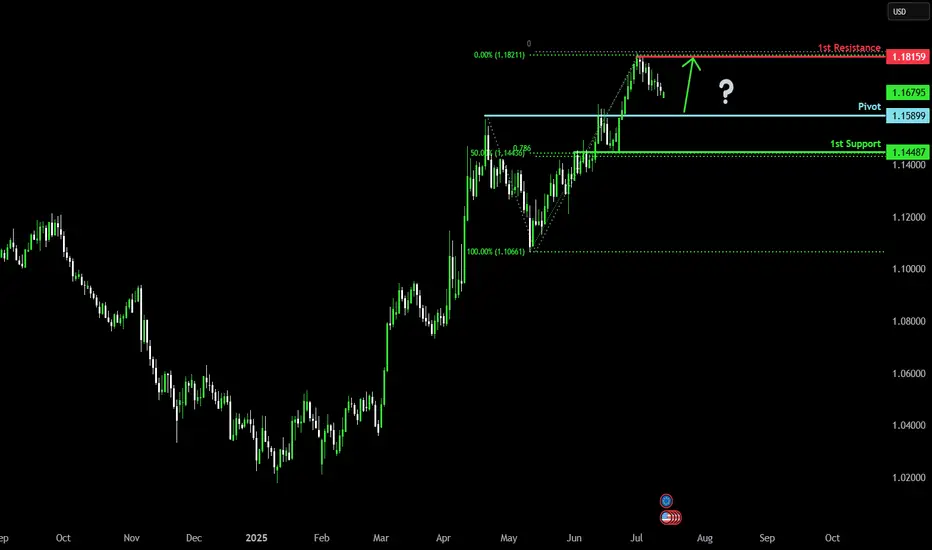
Bullish continuation?The Fiber (EUR/USD) is falling towards the pivot, which has been identified as a pullback support and could bounce to the 1st resistance.
Pivot: 1.1589
1st Support: 1.1448
1st Resistance: 1.1815
Risk Warning:
Trading Forex and CFDs carries a high level of risk to your capital and you should only trade with money you can afford to lose. Trading Forex and CFDs may not be suitable for all investors, so please ensure that you fully understand the risks involved and seek independent advice if necessary.
Disclaimer:
The above opinions given constitute general market commentary, and do not constitute the opinion or advice of IC Markets or any form of personal or investment advice.
Any opinions, news, research, analyses, prices, other information, or links to third-party sites contained on this website are provided on an "as-is" basis, are intended only to be informative, is not an advice nor a recommendation, nor research, or a record of our trading prices, or an offer of, or solicitation for a transaction in any financial instrument and thus should not be treated as such. The information provided does not involve any specific investment objectives, financial situation and needs of any specific person who may receive it. Please be aware, that past performance is not a reliable indicator of future performance and/or results. Past Performance or Forward-looking scenarios based upon the reasonable beliefs of the third-party provider are not a guarantee of future performance. Actual results may differ materially from those anticipated in forward-looking or past performance statements. IC Markets makes no representation or warranty and assumes no liability as to the accuracy or completeness of the information provided, nor any loss arising from any investment based on a recommendation, forecast or any information supplied by any third-party.
EURUSDEUUSD bouncing of a nice 4hr trendline for few days already. its time to break from the curse and move in a direction. Could it be bearish or bullish?
if the elliot wave is accurate, seems like to have a correction for the begining of next week. Let us know what you think?

EURUSDBased on NeoWave analysis:
Either we are in ABC-X-ABC wave --> so, after B, we get a Buy position for C
Or we are in ABCDE wave --> so, after D, we get a Buy position for large E

Bearish reversal off Fibonacci confluence?The Fiber (EUR/USD) is rising towards the pivot and could reverse to the 1st support.
Pivot: 1.1905
1st Support: 1.1577
1st Resistance: 1.2152
Risk Warning:
Trading Forex and CFDs carries a high level of risk to your capital and you should only trade with money you can afford to lose. Trading Forex and CFDs may not be suitable for all investors, so please ensure that you fully understand the risks involved and seek independent advice if necessary.
Disclaimer:
The above opinions given constitute general market commentary, and do not constitute the opinion or advice of IC Markets or any form of personal or investment advice.
Any opinions, news, research, analyses, prices, other information, or links to third-party sites contained on this website are provided on an "as-is" basis, are intended only to be informative, is not an advice nor a recommendation, nor research, or a record of our trading prices, or an offer of, or solicitation for a transaction in any financial instrument and thus should not be treated as such. The information provided does not involve any specific investment objectives, financial situation and needs of any specific person who may receive it. Please be aware, that past performance is not a reliable indicator of future performance and/or results. Past Performance or Forward-looking scenarios based upon the reasonable beliefs of the third-party provider are not a guarantee of future performance. Actual results may differ materially from those anticipated in forward-looking or past performance statements. IC Markets makes no representation or warranty and assumes no liability as to the accuracy or completeness of the information provided, nor any loss arising from any investment based on a recommendation, forecast or any information supplied by any third-party.

EUR/USD Analysis: US Dollar Strengthens at the Start of the WeekEUR/USD Analysis: US Dollar Strengthens at the Start of the Week
On 2 July, on the EUR/USD chart, we noted that the rally—during which the pair had gained more than 6% since mid-May—was under threat, citing several technical signals, including:
→ proximity of the price to the upper boundary of the ascending channel;
→ overbought conditions on the RSI indicator;
→ nearby resistance from the Fibonacci Extension levels, around 1.18500.
Trading at the start of the week points to renewed US dollar strength. This became particularly evident with the opening of the European session, which triggered a decline in EUR/USD to the 1.17500 area.
It is reasonable to assume that the dollar’s strength against the euro is linked to early-week positioning by traders, who are anticipating news regarding US trade agreements.
According to Reuters, the United States is close to finalising several trade deals in the coming days and is expected to notify 12 other countries today about higher tariffs.
EUR/USD Technical Chart Analysis
The ascending channel established last week remains in play, with the following developments:
→ a dashed midline within the upper half of the channel has been breached by bearish pressure (as indicated by the arrow);
→ a series of lower highs in recent sessions suggests the formation of a downward trajectory, within which the price could move towards the channel median—or potentially test its lower boundary.
P.S. In the longer term, analysts at Morgan Stanley maintain a bullish outlook, forecasting that EUR/USD could rise to 1.2700 by the end of 2027.
This article represents the opinion of the Companies operating under the FXOpen brand only. It is not to be construed as an offer, solicitation, or recommendation with respect to products and services provided by the Companies operating under the FXOpen brand, nor is it to be considered financial advice.

EUR/USD💰Symbol: { EUR/USD }
🟩Price: { 1.17141 }
🟥Stop: { 1.17642 }
1️⃣profit: { 1.17175 }
2️⃣profit: { 1.16865 }
3️⃣profit: { 1.16338 }
📊Check your chart before entering.
🚨Check before use to make sure there is no important news.🚨

121Hello awesome traders! 👑✨
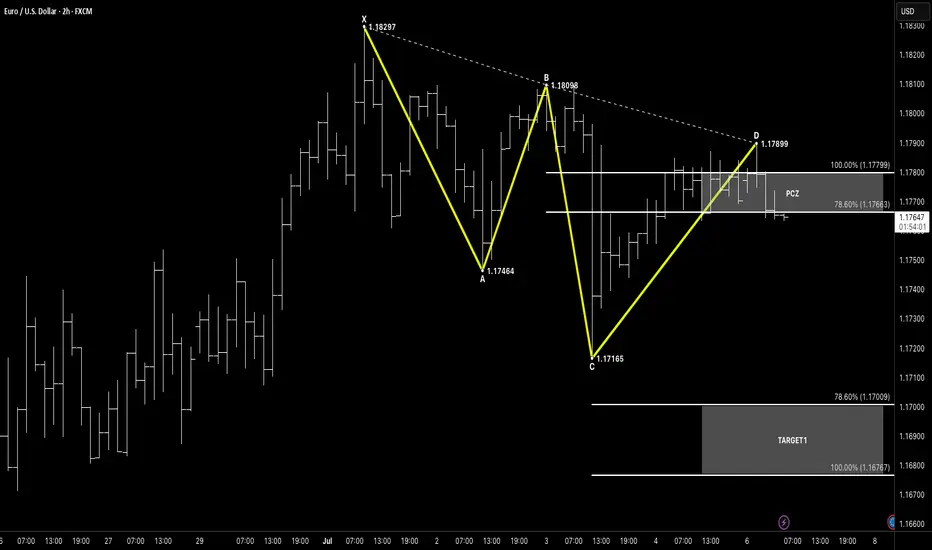
Let’s kick off the week with a EUR/USD 2-Hour chart — spotting a high-probability 121 Bearish reversal to ride lower.
🧠 Setup Breakdown
Pattern Type: 121 Bearish Reversal
X → A: Downtrend from 1.18297 → 1.17464
A → B: Retracement up to 1.18098
B → C: Drop to 1.17165
C → D: Leg up into 1.17899 completing the 121
PRZ / PCZ: Confluence of 78.6% & 100% of BC at 1.17663–1.17799
✅ Why This Works
Clean 121 structure with two distinct retracements
Amplitude Symmetry: AB ≈ CD in price distance (~130 pips each)
Horizontal resistance from the prior B-swing lines up with PCZ
⚔️ Entry & Risk Management
Entry Zone: Short within 1.1766–1.1780 (PCZ)
Stop-Loss: Above swing high D at 1.17899, 5–10 pips higher (~1.1805)
Risk: ≤ 1–2 % of account per trade
🎯 Target Zones
Target Zone 1: 78.6%–100% retracement of C→D → 1.17009–1.16767
Target Zone 2: 127.2%–161.8% extension of C→D → 1.16459–1.16067
🔍 Confirmation & Invalid
Candlestick Rejection: Watch for bearish pin-bar or engulfing at PCZ
Structure Break: Close back below C→D trendline adds conviction
Invalidation: A decisive close above 1.1805 (above PCZ & D) negates the setup
💡 Keep It Simple:
Pattern → Spot 121 Bearish
PCZ → Wait for 78.6–100 % retracement of BC
Trigger → Bearish price action at D
Continuation → Ride the move into your Target Zones
🔔 Monitor ECB speak and risk-sentiment for broader catalysts.
Wishing everyone a profitable week ahead — stay disciplined, manage risk, and let structure lead, not emotions! 🚀
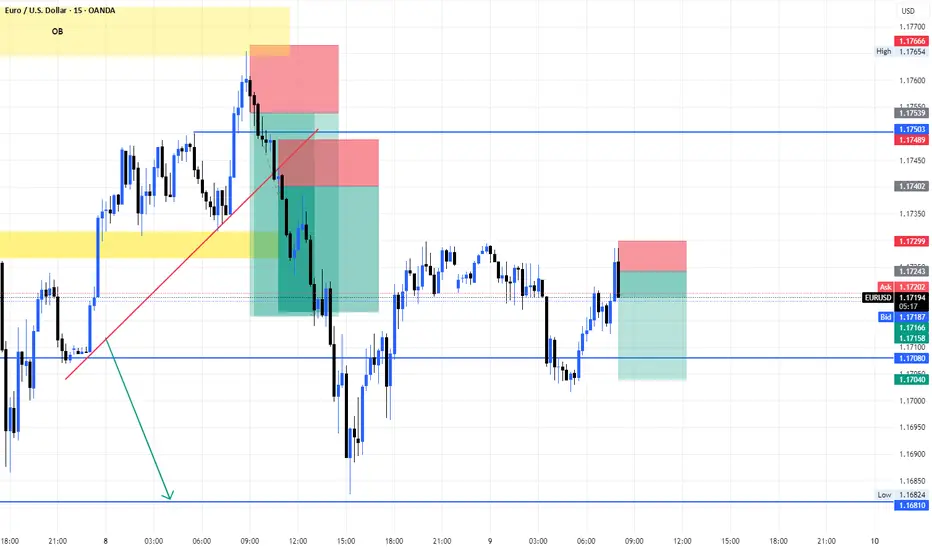
EURUSD – Bearish Reversal Confirmed After Structural BreakEURUSD has shifted out of its bullish environment after a sustained rally inside a clean ascending channel. Price recently rejected a resistance zone that capped previous buying pressure and has now started to rotate downward. This marks the first serious challenge to the trend and sets the tone for a potential bearish phase.
Channel Breakdown and Price Behavior
The ascending channel had been respected for several sessions, guiding price upward with consistent higher highs and higher lows. The recent breakdown from this structure is significant, as it shows the market is no longer willing to support higher prices within that controlled environment. This type of breakout often signals a loss of momentum and increased volatility in the opposite direction.
Break of the Low and Shift in Structure
After breaking the channel, price also took out a major internal low, which had previously held during retracements. This is a key signal of a structural shift, confirming that the uptrend has been interrupted. When price breaks a low that buyers had been defending, it shows sellers have stepped in with conviction and are likely aiming lower targets.
Short-Term Target and Reaction Zone
The first area of interest sits just below current price where a support shelf and price inefficiencies line up. This zone, marked with the dollar sign symbol on the chart, may attract a short-term reaction. If buyers are still present, this is where they would likely try to step in. However, the rejection from resistance and the structural break suggest this level could eventually give way.
Imbalance Zone Below and Liquidity Target
If that support fails, the next high-probability draw is the large untested imbalance sitting further below. This zone has remained untouched since the rally began and represents unfinished business for the market. Price often seeks out these inefficiencies, especially after trend shifts, making it a natural target for sellers if momentum continues.
Conclusion
EURUSD is showing clear signs of bearish pressure after rejecting resistance, breaking structure, and leaving behind unmitigated downside targets. As long as we remain below the broken low, the path of least resistance points lower. The imbalance zone below remains the key destination unless the market shows signs of reversal higher.
Disclosure: I am part of Trade Nation's Influencer program and receive a monthly fee for using their TradingView charts in my analysis.
___________________________________
Thanks for your support!
If you found this idea helpful or learned something new, drop a like 👍 and leave a comment, I’d love to hear your thoughts! 🚀

EURusd Short position 09/07/2025English : According to our analysis, we anticipate a bearish scenario.
Morocan Darija : kanchofo d'apres l'analyse dyalna antsanaw hboot
ATENTION : I only share my ideas, not signal
Sell EURUSD"On the 15-minute timeframe, the market is currently in a downtrend. I anticipate a pullback toward the trendline, and if a clear bearish reaction occurs around the 80% Fibonacci retracement zone, I will consider entering a short position."

EURUSD : taking profit and BUYINGWhile the overall trend is DOWN, sometimes we need to know when to take some profit and buy a bit.
Those who are good play both ways.
Good luck.

EURUSD Sell analysis/ideaThis trade is based on the daily and 4-hour timeframes and executed based on reversal trading and trend formation. Complete explanation in the video!

EURUSD longWe are in clear up trend. Daily and all TF bellow are bullish. We are buying at low area. Price make divergence. We are already on breakeven and waiting for evening FOMC.

EUR_USD LOCAL REBOUND|LONG|
✅EUR_USD has retested a key support level of 1.1690
And as the pair is already making a bullish rebound
A move up to retest the supply level above at 1.1744 is likely
LONG🚀
✅Like and subscribe to never miss a new idea!✅
Disclosure: I am part of Trade Nation's Influencer program and receive a monthly fee for using their TradingView charts in my analysis.
EURUSD Will Go Down!
HI,Traders !
#EURUSD is making a
Bullish rebound after a
Bearish breakout but the
Pair will soon hit a new
Horizontal resistance
Of 1.17489 from where
We will be expecting a
Further move down !
Comment and subscribe to help us grow !

EURUSD On The Rise! BUY!
My dear friends,
My technical analysis for EURUSD is below:
The market is trading on 1.1709 pivot level.
Bias - Bullish
Technical Indicators: Both Super Trend & Pivot HL indicate a highly probable Bullish continuation.
Target - 1.1729
About Used Indicators:
A pivot point is a technical analysis indicator, or calculations, used to determine the overall trend of the market over different time frames.
Disclosure: I am part of Trade Nation's Influencer program and receive a monthly fee for using their TradingView charts in my analysis.
———————————
WISH YOU ALL LUCK

EURusd Short position 07/07/2025English : According to our analysis, we anticipate a bearish scenario.
Morocan Darija : kanchofo d'apres l'analyse dyalna antsanaw hboot
ATENTION : I only share my ideas, not signal

EUR-USD Bullish Bias! Buy!
Hello,Traders!
EUR-USD is trading in an
Uptrend and the pair is
Making a local bearish correction
But we are bullish biased and
After the retest of the horizontal
Support of 1.1640
We will be expecting a further
Bullish move up
Buy!
Comment and subscribe to help us grow!
Check out other forecasts below too!
Disclosure: I am part of Trade Nation's Influencer program and receive a monthly fee for using their TradingView charts in my analysis.

EURUSD BUYTake trade on your own risk!
clear broke supply & demand zone, will now be moving upwards.
Set TP: 1.17607

EURUSD-SELL strategy Daily chart Line Brk (2)The pair is under pressure and I feel we may see 1.1535 test in the neat-term. The indicators show negativity and line break shows downward pressure.
Strategy SELL @ 1.1700-11735 and take profit near 1.1567 for now.
