USDEUR trade ideas

Hold off on EURUSD for nowYesterday, EURUSD dropped over 150 pips following the trade agreement between the US and the European Union.
Tomorrow, the Fed is expected to announce interest rates, which could bring further volatility.
Avoid entering new positions at the moment and don’t overdo it with your lot sizes.
Once the news is out, there will be clearer and more confirmed trade opportunities.

EURUSD Wave Analysis – 28 July 2025- EURUSD reversed from the resistance level 1.1775
- Likely to fall to support levels 1.1555 and 1.1460
EURUSD recently reversed down from the resistance zone between the resistance level 1.1775 (which stopped the previous impulse wave 3 at the start of July, as can be seen below) and the upper daily Bollinger Band.
This resistance zone was further strengthened by the lower trendline of the recently broken up channel from May (acting as resistance after it was broken earlier).
Given the strongly bullish US dollar sentiment, EURUSD can be expected to fall to the next support levels 1.1555 and 1.1460 – the low of waves 4 and iv.

EURUSD Outlook – From Bias to Execution Previous day closed bearish, leading to a sell bias, on the 45M, I marked my possible entry and exit area.

Euro will rise a little and then start to fall to support lineHello traders, I want share with you my opinion about Euro. After a prolonged consolidation period, a strong upward trend was initiated from the buyer zone around 1.1285, propelling the EUR significantly higher. This initial impulsive move has since transitioned into a more complex and mature phase, taking the shape of a large upward wedge formation, a pattern which often signals underlying exhaustion in the prevailing trend. Currently, the pair is operating within this defined market zone, characterized by a clear ascending support line and a corresponding resistance line. The price action inside the wedge has become corrective, with the most recent upward correction originating from the support area near 1.1575. The working hypothesis is centered on a short-term bearish scenario, which anticipates that this current rally will fail as it approaches the upper boundary of the wedge. A rejection from this resistance would confirm that selling pressure is increasing and that the bullish momentum is waning. This would likely trigger a significant downward rotation within the structure, with the immediate objective being a retest of the main ascending support line. For this reason, the TP is strategically and logically placed at the 1.1665 level, as this point lies directly on the trend line and serves as the most critical test for the existing uptrend's viability. Please share this idea with your friends and click Boost 🚀
Disclaimer: As part of ThinkMarkets’ Influencer Program, I am sponsored to share and publish their charts in my analysis.

Xmoon Indicator Tutorial – Part 1 – Strategy🔻🔻🔻+ Persian version below🔻🔻🔻
📘 Xmoon Indicator Tutorial – Part 1
🎯 3Push Divergence RSI Strategy
🔥 The core of the Xmoon indicator
is built upon one of the most powerful strategies in technical analysis:
The advanced 3Push Divergence RSI pattern
🔁 A pattern that typically appears at key market turning points.
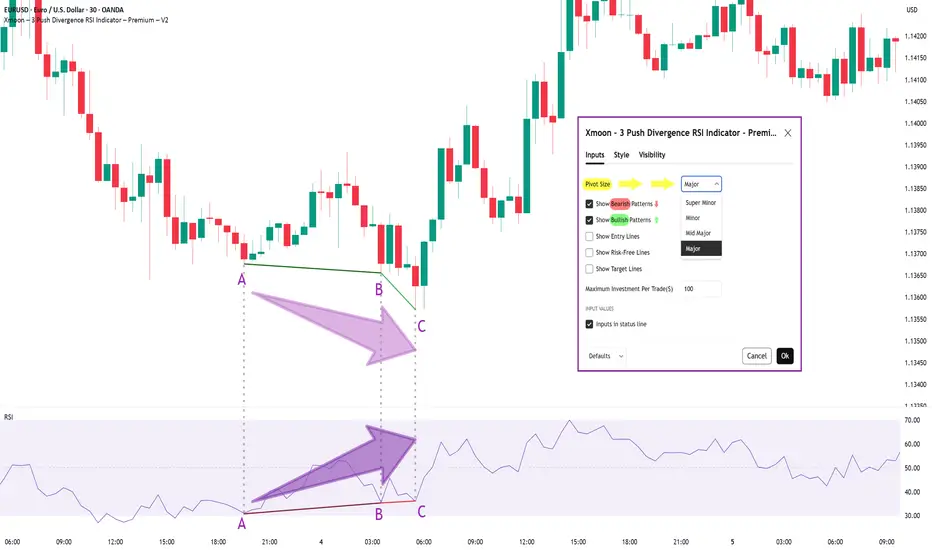
📉 When the price moves in the same direction three consecutive times on pivot points (e.g., making lower lows or higher highs), but the RSI shows the opposite behavior, it indicates a clear divergence !
💡 This divergence can act as a strong signal for a potential trend reversal.
🎯 The Xmoon Indicator is designed to detect this critical moment.
⚙️ Xmoon Indicator Settings Panel
The Xmoon settings panel offers the following options:
🔸 Pattern Type Selection: In the first and second lines, you can specify which type of pattern should be displayed: only bullish patterns or only bearish ones. You can also check both options.
🔸 Pivot Type Selection: From the dropdown menu, you can choose one of four pivot types:
“Super Minor”, “Minor”, “Mid-Major”, and “Major”, ordered from smallest to largest.
📌 Educational Note: The greater the distance (in candle count) between two lows or two highs, the larger the pivot is considered.
A Major Pivot is the largest among them.
✅ Larger Pivot = Higher Accuracy
❗ But naturally = Fewer Signals
📣 If you have any questions or need guidance, feel free to ask us. We’d be happy to help.
🔻🔻🔻بخش فارسی – Persian Section 🔻🔻🔻
📘 آموزش اندیکاتور ایکسمون - قسمت اول
🎯 استراتژی سهپوش واگرایی (3Push Divergence RSI)
🔥 هسته اصلی ایکسمون
بر پایه یکی از قویترین استراتژیهای تحلیل تکنیکال طراحی شده است
الگوی پیشرفته سهپوش واگرایی
🔁 الگویی که معمولاً در نقاط چرخش مهم بازار ظاهر میشود
📉 وقتی قیمت سه بار پشت سر هم روی نقاط پیوت ، در یک جهت حرکت میکند (مثلاً کفهای پایینتر یا سقفهای بالاتر میسازد) ، اما آر-اِس-آی خلاف آن را نشان میدهد، یعنی یک واگرایی آشکار رخ داده است
💡این واگرایی میتواند سیگنالی قوی برای برگشت روند باشد
🎯 اندیکاتور ایکسمون این لحظه را شناسایی میکند
⚙️ پنجره تنظیمات اندیکاتور ایکسمون
در بخش تنظیمات اندیکاتور ایکسمون، امکاناتی در اختیار شما قرار دارند
🔸 انتخاب نوع الگو: در خط اول و دوم میتوانید مشخص کنید چه نوع الگویی نمایش داده شود
فقط الگوهای صعودی یا فقط نزولی. همچنین می توانید تیک هر دو گزینه را بزنید
🔸 انتخاب نوع پیوتها: از پنجره کشویی بالا، می توانید یکی از ۴ نوع پیوت را انتخاب کنید
پیوت ها به ترتیب از کوچک به بزرگ عبارتند از: سوپر مینور ، مینور ، میدماژور و ماژور
📌 نکته آموزشی: هرچه فاصله بین دو کف یا دو سقف بیشتر باشد (یعنی تعداد کندلهای بین آنها زیادتر باشد)، آن پیوت، بزرگتر محسوب میشود
پیوت ماژور از بقیه بزرگ تر است
✅ پیوت بزرگتر = دقت بالاتر
❗ اما طبیعتاً = تعداد سیگنال کمتر
📣 اگر سوالی دارید یا نیاز به راهنمایی دارید، خوشحال میشویم از ما بپرسید
با کمال میل در خدمتتان هستیم

EURUSD Buy Limit Order Opportunity You Can’t MissAnalyzing market structure and liquidity using Price Action and Smart Money Concepts. Focused on key supply/demand zones and institutional order flow

Smart Money Concepts (SMC) Strengths of the analysis:
1. Break of Structure (Choch + Bos)
A break of Structure (Bos) is clearly identified after s Choch, indicating the star of a new bearish structure.
2. OB 1H and FVG as an entry zone:
the price returns to a block order (OB-1H) within the resistance zone, which is an excellent institucional area to look for a short entry. Furthermore, the presence of a FVG on the 1H provides additional confluence.
3.Projection toward the last LL (Lower Low):
It is very accurate to project the bearish continuation toward the support zone, which coincides with the last LL, an area with a high probability of being mitigated.....

EURUSD Analysis – Supply Zones & Reversal Opportunities (MMC)Today’s EURUSD analysis focuses on identifying major supply zones, potential reversal points, and directional bias using the Mirror Market Concept (MMC) on the 8-hour timeframe.
1️⃣ Market Structure & Channel Supply Zone
The market recently formed a descending channel 📉, acting as a full supply zone where sellers dominated.
Every time price touched the upper boundary of this channel, we saw bearish reactions, proving this zone as a strong liquidity grab area.
Breakdown from the channel: After repeated attempts to break the channel to the upside, sellers regained control, pushing EURUSD lower and confirming bearish momentum.
2️⃣ Central Reversal Zone (Decision Point) ⚖️
Currently, price is consolidating around the Central Reversal Zone.
This zone is crucial because it can act as:
Reversal Point 🟢: If buyers step in aggressively, we might see a bullish leg toward previous swing levels, targeting resistance zones.
Continuation Zone 🔻: If sellers maintain pressure and break below this level, momentum will shift strongly bearish, aiming for deeper support.
Price behavior here will define short-term direction. Traders must wait for confirmation before committing to large positions.
3️⃣ Next Major Reversal Zone (High-Probability Demand) 🟩
Marked in green, this zone is expected to attract buyers if the current level fails.
Historically, these areas show high liquidity grabs and institutional activity.
If price reaches this zone, we expect significant bullish interest, making it a high-probability reversal area for medium-term buy setups.
4️⃣ Trade Scenarios
Scenario 1 (Bullish Reaction 🟢):
Price bounces from the Central Reversal Zone.
Possible targets: Previous structure highs inside the channel break zone.
Scenario 2 (Bearish Continuation 🔻):
Price fails to hold above and breaks lower.
Target: Next Major Reversal Zone for fresh liquidity accumulation.
5️⃣ Trading Approach & Risk Management 🛡️
Aggressive Approach: Intraday traders can scalp inside the Central Reversal Zone but must keep tight stop-losses to avoid fake-outs.
Conservative Approach: Wait for a clean break and retest confirmation, especially near the Next Reversal Zone for high-probability trades.
Maintain risk-to-reward (RR) ≥ 1:2 and avoid emotional trading during reversal attempts.
Summary:
EURUSD is at a critical juncture. The current market structure shows a bearish tone, but the Central Reversal Zone can still cause a temporary bullish reaction. A failure to hold will open the path toward the green reversal demand zone, where major buyers are likely to appear.

EUR/USD Technical Analysis📈 EUR/USD Technical Analysis
🔍 1. Market Structure
⚙ Trend Context
• The overall trend since mid-July has been bullish, with higher highs and higher lows forming after a bounce from a key demand zone (around 1.15380).
• However, recent candles show indecision and a potential reversal, suggesting weakening momentum.
⸻
🧱 2. Volume Profile Insight (VRVP)
• High Volume Nodes (HVNs):
• Significant trading activity occurred between 1.172–1.176, now acting as resistance.
• Low Volume Gaps:
• Thin liquidity zones exist between 1.165–1.158, which could result in swift price movement if selling pressure increases.
📘 Educational Insight: Thin volume areas on a profile typically allow for faster price transitions due to lack of order density.
⸻
📊 3. Envelope Indicator – Nadaraya-Watson (8,3)
• A mean-reversion tool estimating dynamic overbought and oversold areas.
• Price recently rejected the upper boundary, reinforcing the bearish outlook.
• The lower envelope, around 1.158–1.160, aligns with the projected bearish target.
⸻
🟫 4. Demand Zone Analysis
• Labeled “DEMAND ZONE” at 1.15380–1.15830
• Previously caused a strong bullish reversal, marking it as an area of institutional interest.
• A re-test of this zone may attract buyers once again, presenting a key support area.
📘 Educational Insight: Demand zones reflect

EURUSD - Parallel channel in play!The following chart offers a closer look at the current structure of the EUR/USD pair on the 4-hour timeframe. Price action has been respecting a well-defined bearish parallel channel, which has provided clear boundaries for both resistance and support. Based on the ongoing reaction to these levels, we outline both bullish and bearish scenarios that could unfold in the coming sessions.
Bearish Parallel Channel
Since June 30, EUR/USD has been consistently moving within a downward-sloping bearish parallel channel. Each attempt to break above the upper boundary of the channel has been rejected, while the lower boundary continues to act as dynamic support. This sustained rejection from the upper trendline confirms the strength of the bearish momentum currently at play. The pair remains structurally weak unless a clean breakout to the upside occurs, accompanied by strong bullish confirmation.
Bullish Scenario
A potential bullish reversal could materialize if EUR/USD manages to hold above the 4-hour Fair Value Gap (FVG) located between 1.1620 and 1.1600. This zone may provide the necessary support for the bulls to step in. If the price maintains strength within or just above this FVG and buyers begin to show dominance, a rebound toward the upper boundary of the channel could occur. A successful breakout above the channel could then trigger a stronger rally, possibly targeting the 1.1750–1.1800 region, marking a clear shift in short-term momentum.
Bearish Scenario
Conversely, if the pair fails to hold the 4-hour FVG between 1.1620 and 1.1600 and closes a strong bearish 4-hour candle below this zone, the market may be setting up for further downside. This would suggest a rejection of the FVG as resistance and open the path for a drop toward the lower end of the channel. Interestingly, this area also aligns with a previously established larger 4-hour FVG. A move into this deeper FVG could present a more favorable zone for a longer-term bullish reversal, as it offers a stronger liquidity pool and potential demand area.
Final Thoughts
The EUR/USD pair is at a critical juncture. Price is hovering near a key support zone within a bearish channel that has defined its movement for several weeks. Whether bulls can hold this support and break above the channel, or bears take control and push it lower toward the broader 4-hour FVG, will determine the next major directional move. Traders should closely monitor price action around the 1.1620–1.1600 level for clues on the likely breakout direction.
--------------------------
Disclosure: I am part of Trade Nation's Influencer program and receive a monthly fee for using their TradingView charts in my analysis.
Thanks for your support. If you enjoyed this analysis, make sure to follow me so you don't miss the next one. And if you found it helpful, feel free to drop a like and leave a comment, I’d love to hear your thoughts!

EURUSD Long Trade - Bounce Back from Monthly SupportFX:EURUSD Long Trade.
EURUSD is Bouncing Back from Monthly Support.
Note: Manage your risk yourself, its risky trade, see how much your can risk yourself on this trade.
Don't be greedy.
Use proper risk management
Looks like good trade.
Lets monitor.
Use proper risk management.
Disclaimer: only idea, not advice

EURUSD plunges without brakes – The bears take full control!EURUSD continues its steep decline as both macroeconomic and technical pressures mount. A trade deal unfavorable to the EU, combined with the Fed’s hawkish stance, has fueled USD strength and dragged the euro sharply lower. At the same time, strong U.S. labor data and rising employment costs further reinforce the bearish outlook.
On the H1 chart, EURUSD is clearly moving within a descending channel. Key price zones have been broken with no significant bullish reaction, indicating that sellers remain firmly in control. The market is heading toward a psychological support area, with no signs of reversal as RSI stays weak.
I remain biased toward SELL setups on any short-term pullbacks, avoiding countertrend trades in this environment. If downside momentum continues, deeper targets may still be ahead.
In a market dominated by bearish sentiment, trading with the trend remains the smartest and safest approach.

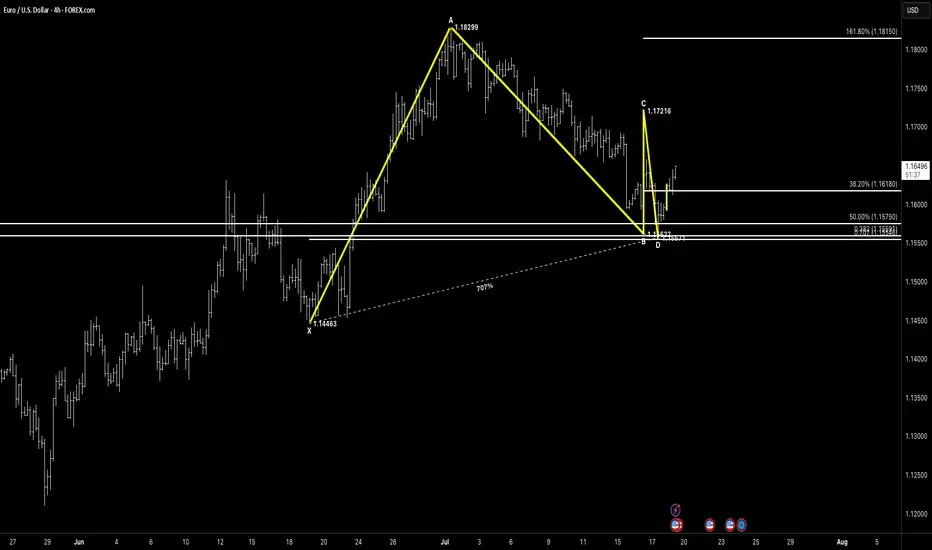
EURUSD / Euro – U.S. Dollar (4H) – ABC Bullish Structure EURUSD / Euro – U.S. Dollar (4H) – ABC Bullish Structure with Double Bottom Base
Pattern Overview:
Pattern Type: ABC Bullish + Corrective Double Bottom
Asset: EURUSD
Timeframe: 4H
Trade Type: Bullish Bias – Monitoring for continuation after rejection from cluster support
🔎 Key Levels
XA: 1.14663 → 1.18299
AB: 1.18299 → 1.16292
BC: 1.16292 → 1.17216
CD: Completion just under 1.15621 cluster
Major Fib Cluster: 0.707% XA, 0.886 AB, 50% CD, Prior Horizontal Support Zone
📐 Fibonacci Extensions & Key Ratios
38.2% retracement: 1.16180
50.0% retracement: 1.15750
161.8% extension: 1.18150
💡 Price Action & Setup
Price has completed an ABC corrective leg, forming a clean double bottom at the D point, hovering over the fib-rich support cluster.
The rejection candle shows buyer interest, and the recent higher low structure implies potential for continuation, especially if price reclaims and holds above 1.1650 short-term structure.
🧠 Market Sentiment
DXY easing slightly after strong dollar dominance
EUR macro calendar quiet – technicals may dominate next moves
Strong base = smart money accumulation likely underway
📊 Next Potential Movement
Break above 1.1675 opens path toward 1.1720, then possibly 1.1815
If 1.1575 cluster fails → risk of full XA retracement
🛡 Risk Management
Aggressive long entries already in play
Conservative entries should wait for higher low confirmation above 1.1650
Protective stop: under 1.1550 zone
📌 Conclusion
This is a bullish structure with a corrective double bottom base sitting right inside a dense confluence zone. Price is compressing between key fibs – expect a directional move next week. Keep your eye on the 1.1675 breakout or 1.1570 loss for next major decision.
“In the densest zones of indecision, patterns and confluence provide the clearest map.”
EurUsd Going Bullish 20 to 30 pipsEur usd now buy mode 20 to 30 pips .
If anyone wanted to learn this System Analysis contrect with me .

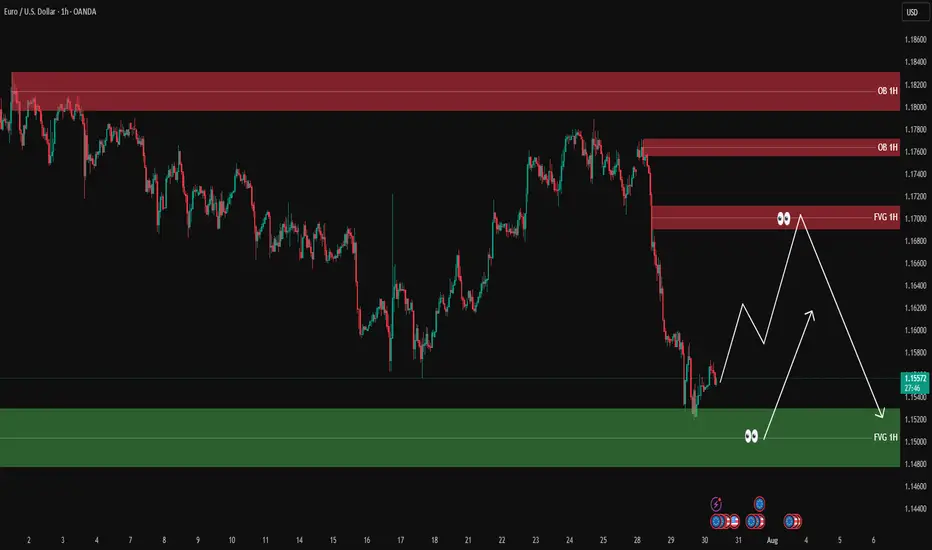
EURUSD analysis - 1H FVG and OB setupsOn the 1H timeframe, price has entered the green demand zone (1H FVG) around 1.1480 – 1.1520 after a strong bearish leg.
We're expecting a bullish retracement from this zone, aiming toward the upper red FVG/OB zone around 1.1690 – 1.1715.
📌 There are two key scenarios:
1️⃣ Scenario 1: Price starts moving up from the green FVG → reaches red FVG zone → short setup after lower timeframe confirmation
2️⃣ Scenario 2: Price makes an initial move to ~1.1620 → pulls back to the green zone → pushes back up into the red OB → short setup on confirmation
🎯 Final target for both scenarios: a break below the green FVG zone and continuation down
✅ Entry only after confirmation from lower timeframes (3M–15M)
❌ No trades without confirmation
EURUSD: Will Go Down! Short!
My dear friends,
Today we will analyse EURUSD together☺️
The market is at an inflection zone and price has now reached an area around 1.15996 where previous reversals or breakouts have occurred.And a price reaction that we are seeing on multiple timeframes here could signal the next move down so we can enter on confirmation, and target the next key level of 1.15562..Stop-loss is recommended beyond the inflection zone.
❤️Sending you lots of Love and Hugs❤️

EURUSD InsightWelcome, everyone.
Please share your personal opinions in the comments. Don’t forget to hit the boost and subscribe buttons.
Key Points
- The U.S. and the EU have reached a trade agreement to impose a 15% tariff on EU goods, including automobiles. However, President Trump stated that pharmaceuticals, steel, and aluminum would be exempt from the 15% tariff. Both sides also agreed to mutually waive tariffs on "strategic items" such as aircraft and semiconductor equipment. Additionally, the EU has agreed to purchase $750 billion worth of U.S. energy and to invest an additional $600 billion in the U.S.
- High-level trade talks between the U.S. and China will be held on July 28–29, with the market expecting an extension of the current trade truce.
- Ahead of the FOMC meeting scheduled for July 29, markets are projecting an interest rate cut more likely in September rather than July.
Key Economic Events This Week
+ July 29: U.S. Department of Labor JOLTS
+ July 30: Germany Q2 GDP, U.S. July ADP Non-Farm Employment Change, U.S. Q2 GDP, Bank of Canada interest rate decision, FOMC meeting outcome
+ July 31: Bank of Japan interest rate decision, Germany July CPI, U.S. June Core PCE Price Index
+ August 1: Eurozone July CPI, U.S. July Non-Farm Payrolls, U.S. July Unemployment Rate
EURUSD Chart Analysis
The pair is showing an upward trend after finding support near the 1.16000 level. However, with resistance at the 1.18000 level—where the price previously faced rejection—the overall bias still appears bearish. That said, a breakout above this resistance line could signal a continuation of the uptrend, warranting close monitoring. For now, the outlook remains bearish toward the 1.15000 level. Should a breakout be confirmed, we will promptly revise our strategy.

EURUSD: Move Down Expected! Short!
My dear friends,
Today we will analyse EURUSD together☺️
The price is near a wide key level
and the pair is approaching a significant decision level of 1.15337 Therefore, a strong bullish reaction here could determine the next move up.We will watch for a confirmation candle, and then target the next key level of 1.15208.Recommend Stop-loss is beyond the current level.
❤️Sending you lots of Love and Hugs❤️

EURUSD 60/15 Pullback ShortOverall down trend. Now the price is located at the defending gap and stay above. Expected to break up and reach the sell zone then drop. Set alarm on lower sell zone and monitor.

EURUSD SELL SHORTEURUSD in Daily TF Market will bearish , In Daily TF mss in LTF after valid MSS then Entry short in LTF
Target to Monthly BISI / Monthly OBI / OB
enjoYYYYYYYYYYYYYYYYYYYYYYYYYYYYYYYYYYYYYYYYYYYYYYYYYYYYYYYYYYYYYYYYYYYY

EURUSD(20250730) Today's AnalysisMarket News:
According to a Reuters/Ipsos poll, Trump's approval rating has fallen to 40%, the lowest level since his second term.
Technical Analysis:
Today's Buy/Sell Levels:
1.1554
Support and Resistance Levels:
1.1634
1.1604
1.1584
1.1523
1.1504
1.1474
Trading Strategy:
If the price breaks above 1.1584, consider entering a buy position, with the first target price at 1.1604. If the price breaks below 1.1554, consider entering a sell position, with the first target price at 1.1523.
