EUR/USD Bearish Reversal SetupEUR/USD is forming a head and shoulders pattern with bearish divergence, indicating a potential price drop. A sell below the neckline confirms the breakout of the last higher low.
USDEUR trade ideas

EURUSDPrice rejecting supply; structure showing lower highs/lows. COT supports USD strength — expecting further downside.
EUR/USD (Bearish)
Price rejecting supply; lower highs/lows forming with COT backing USD strength. Bias remains bearish toward next support.
EUR/USD Elliott Wave: Corrective Pullback in Progress Wave ((4))EUR/USD 4H chart with Elliott Wave count. The pair remains in a steady downtrend after peaking at the wave (C) high, and is now in the middle of a larger wave iii decline. Bearish impulse waves dominate, with lower lows confirming the trend (mid-wave iii scenario). Now expecting a wave ((4)) relief bounce (corrective) within this wave iii. Price could rebound toward 1.15788–1.16153, the ~38.2–50% Fibonacci retracement zone of the prior drop.
This area is a likely resistance for the bounce, suggesting only a temporary uptick in an otherwise bearish move. After wave ((4)) completes, the downtrend should resume as wave ((5)) of iii kicks in. The next downside target is around 1.13974 (or lower) – near a 1.618 Fibonacci extension projection where wave ((5)) may complete. This would likely finish wave iii and aligns with the broader bearish Elliott Wave count.

EURUSD ahead of the FEDEURUSD remains below the 1,1600 level following the trade agreement between the US and the European Union.
Today, all eyes are on the FED’s decision regarding interest rates.
Watch for a reaction around the support zone, as it may present an opportunity for the trend to continue.
However, it's advisable to reduce risk and hold off on new entries until after the news is released.

TRADE UPDATE – LIVE SHORT IN PLAY⚠️ TRADE UPDATE – LIVE SHORT IN PLAY
📉 Pair: EUR/USD
🔹 Entry: 1.1665 (Short)
🔒 SL: 1.1800
🎯 TP1: 1.1500
📍 Current Price: 1.1633
🧮 Current R:R (TP1): 1.22:1
🧱 Renko Structure: Active inside Brick 16 (1.1600–1.1700)
📊 Bias: Bearish continuation confirmed
⸻
🧠 Why We’re In This Trade:
• The previous long thesis is invalidated — price closed below 1.1700 and rejected Brick 17
• We’re now inside Brick 16, actively rotating downward
• Momentum is cleanly bearish, with H1 confirming lower highs
• 1.1500 is the first Renko target, and macro structure favors continuation to 1.1400+
• All bricks beneath 1.1600 are clean — no support zones until TP1
⸻
🎯 NEXT TARGET ZONE: 1.1500 (TP1)
〰️ Brick 14 Confirm — High-probability completion zone for current leg
⸻
📌 Action Plan:
✅ If price breaks and closes below 1.1600:
→ Move SL to BE
→ Watch for fast drop toward 1.1500
❌ If price closes above 1.1700:
→ Structure is weakening — prepare to cut or re-evaluate
❌ If 1.1800 hits:
→ Full invalidation — trade thesis broken
⸻
📛 Reminder:
No new longs allowed unless Brick 17 (1.1700+) is fully reclaimed
No FOMO shorts — only add on rejection spikes or full brick closes

Bullish momentum to extend?The Fiber (EUR/USD) is falling towards the pivot, which acts as an overlap support and could rise to the 1st resistance, which has been identified as a swing high resistance.
Pivot: 1.1588
1st Support: 1.1447
1st Resistance: 1.1817
Risk Warning:
Trading Forex and CFDs carries a high level of risk to your capital and you should only trade with money you can afford to lose. Trading Forex and CFDs may not be suitable for all investors, so please ensure that you fully understand the risks involved and seek independent advice if necessary.
Disclaimer:
The above opinions given constitute general market commentary, and do not constitute the opinion or advice of IC Markets or any form of personal or investment advice.
Any opinions, news, research, analyses, prices, other information, or links to third-party sites contained on this website are provided on an "as-is" basis, are intended only to be informative, is not an advice nor a recommendation, nor research, or a record of our trading prices, or an offer of, or solicitation for a transaction in any financial instrument and thus should not be treated as such. The information provided does not involve any specific investment objectives, financial situation and needs of any specific person who may receive it. Please be aware, that past performance is not a reliable indicator of future performance and/or results. Past Performance or Forward-looking scenarios based upon the reasonable beliefs of the third-party provider are not a guarantee of future performance. Actual results may differ materially from those anticipated in forward-looking or past performance statements. IC Markets makes no representation or warranty and assumes no liability as to the accuracy or completeness of the information provided, nor any loss arising from any investment based on a recommendation, forecast or any information supplied by any third-party.


Eurusd techinical analysis.Eurusd techinical analysis next move posibale at h1 time frame not finchinal advice.

EUR/USD: A Fragile Rebound Within a Broader Bearish TrapEUR/USD has managed to stage a slight recovery after plunging through the key 1.1680 support — a level that had held firm for two weeks. The pair is now hovering just above 1.1500, but the bounce appears shallow and unconvincing. Volume remains low, momentum indicators offer little confirmation, and the broader structure still points to a prevailing downtrend.
On the H2 chart, price has rebounded from the 1.1505 area — a minor support formed during July's short-term consolidation. Yet, the EMA slope remains strongly negative, and RSI is struggling below the neutral 50 mark after exiting oversold territory. The structure continues to display classic lower highs and lower lows, with the 1.1585–1.1600 zone emerging as a potential resistance area for bears to re-enter.
From a macro perspective, the U.S. dollar remains supported by expectations that the Fed will maintain a hawkish stance, fueled by solid GDP, durable goods, and PCE data. In contrast, the Eurozone struggles with signs of stagnation, with both services and manufacturing PMIs deteriorating — most notably in Germany. This policy divergence continues to favor the greenback.
Unless bulls manage to decisively reclaim the 1.1600 zone with strong follow-through buying, any rebound risks being nothing more than a dead cat bounce. The downside target remains near 1.1460 – 1.1440 in the near term.

EURUSD – Post-FOMC Macro Compression in Play📉 EURUSD – Post-FOMC Macro Compression in Play
WaverVanir | VolanX Protocol | July 30, 2025
The recent Fed hold has added pressure to the euro as rate differentials remain in favor of the USD. On the chart, EURUSD failed to sustain above the 0.786 retracement level (~1.1476), with clear signs of exhaustion.
🧠 Thesis:
We may see a macro compression pullback with EURUSD potentially revisiting the baseline support zone at 1.08147, which previously acted as a long-term resistance-turned-support.
🔍 Technical Confluence:
Rejection near 0.786 Fib (1.1476)
No bullish breakout above 2023–2024 ceiling
Downside targets:
1.1070 → short-term support
🟡 1.0815 → baseline zone and decision point
🧠 Macro Overlay:
Fed is in pause-and-watch mode
ECB growth outlook is slowing
US inflation is stickier = USD strength persisting short term
📌 VolanX DSS Summary: Bearish structure developing. We favor tactical shorts on rallies toward 1.1470–1.15 with eyes on the 1.08 handle.
#EURUSD #FOMC #VolanX #WaverVanir #MacroTrading #ForexSignals #USD #ECB #RateDifferential #Fibonacci #SMC #Liquidity #ForexMacro


A POTENTIAL TREND REVERSAL Hello Traders 👋
What are your thoughts on EURUSD
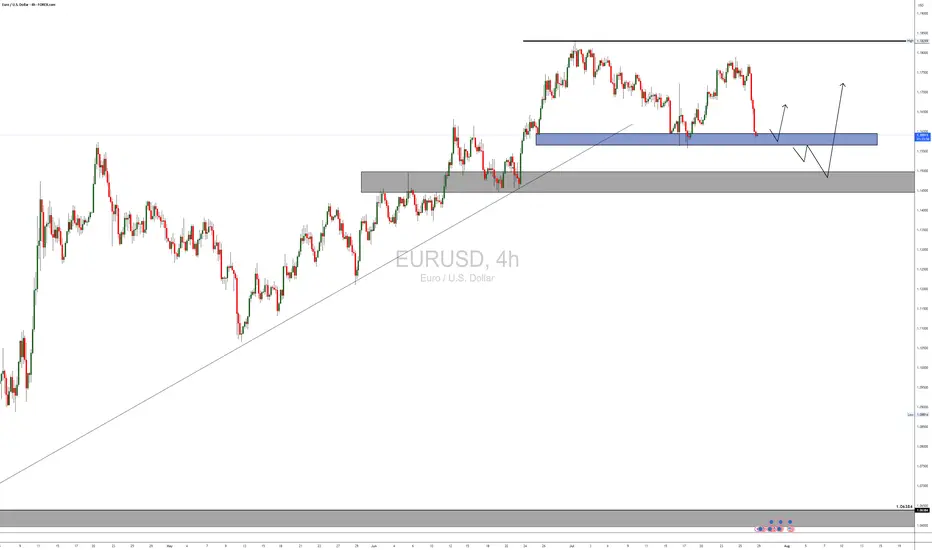
Looking at the daily timeframe we can see that price action didn't take out the liquidity which is located with a blue rectangle which is also acting as the all-time high for EURUSD.
I'm seeing price retracing to reach the liquidity around that blue rectangle and then after start falling downwards.
Let's look at the fundamentals of EURUSD
Trump announced the conclusion of a trade agreement with the EU:
The EU will invest $600 billion more in the US than before
15% tariff on EU goods, including cars
All EU countries will open their markets to the US
EU to purchase hundreds of billions of dollars worth of military equipment
EU to purchase $750 billion worth of energy from the US. Energy is a key part of the agreement.
PS:
It is worth monitoring the market reaction from the opening. Pay attention to the market reaction during different sessions.
Markets may react ambiguously, but against the general backdrop, the following reaction should be expected:
USD → sharp rise (dollar strengthening due to capital inflows and growth in energy exports).
EUR → down, as the EU will bear the costs of tariffs and rising imports from the US.
Gold → down (correction or decline due to the strengthening of the dollar and reduced demand for hedging).
BTC → neutral or slight decline (due to USD strength):
If the agreement stimulates the economy and liquidity, this could be a bullish factor for BTC.
………………………………………….

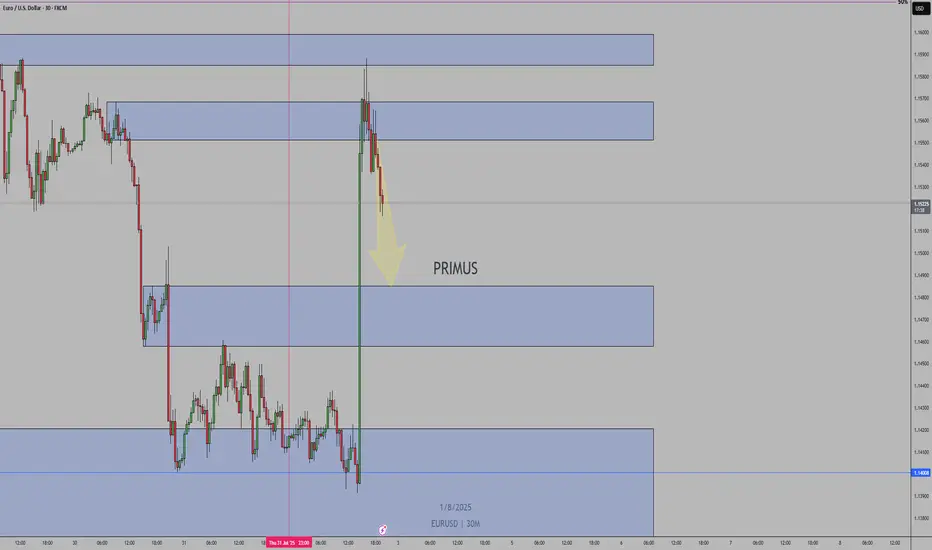
Trend decision after the newsAfter the news, the price nearly reached the bottom of the higher time frame channel and paused. We need to see whether the price can break into the channel or not. Personally, I don’t think that will happen. I believe a range will form within the marked zone, and then the price will drop further.
EURUSD short to 1.121Hello Traders,
Factoring in the fundamentals such as US EUR trade deal, $600 billion of investment into US, $350 billion investment from South Korea.
4hr chart, trading under 1 day up trendline.
Was strong sell signal from 1.177 last Thursday.
200ema starting to turn downwards
Still close to upper regression channel that began July 1st, believe it is still in play.
6 hr and 12 hr block still support, strong rejection at 4h bearish block. not expecting much else today since it's Friday. Still targeting 1.121 in August
Originally entered trade at 1.172 area, added 3 times on the way down, originally targeting 1.143 but with the ever evolving trade deal news that I believe to be bullish for the USD I moved target to 1.121.
Goodluck to you all.

EURUSD - 31/7/25Price has reached a zone that broke the structure - see BoS on the left. Now that price is here in the zone, im not comfortable entering a buy order yet. The full bearish candle into the zone, leaves me with an indication that price may go lower.
+ve:
1. Big bearish candle in to the BoS zone - price may drop lower
2. There is equal low liquidity on the left which sits just below the zone which is expected to be taken out
4. HTF direction is still bullish
-ve:
1. below the equal low liquidity is an efficient zone before some imbalance
2. that imbalance may draw price to it and stop me out
Second trade idea:
Assuming that the first trade does not hold, then my focus will be the extreme zone where i will place a buy limit.
TP: 8.86R

EURUSD after the FedEURUSD continues to trade within the reversal zone highlighted in our previous analyses.
Following yesterday’s Fed decision, we’re seeing additional downside movement, though price hasn’t yet reached the support level at 1,1346.
Our outlook remains unchanged – we’re watching for the end of the pullback and will look for buying opportunities afterwards.
The H1 candle formed during the news release can serve as a reference. A break and close above it would signal a potential reversal to the upside.
Conversely, if price breaks and closes below that candle, it would suggest the correction is likely to continue toward lower levels.

EURUSD H4 | Bearish reversal off overlap resistanceThe Fiber (EUR/USD) is rising towards the sell entry, which is an overlap resistance and could drop lower.
Sell entry is at 1.1452, which is an overlap resistance.
Stop loss is at 1.1536, which is a pullback resistance that lines up with the 38.2% Fibonacci retracement.
Take profit is at 1.1323, which is a pullback support that is slightly below the 78.6% Fibonacci retracement.
High Risk Investment Warning
Trading Forex/CFDs on margin carries a high level of risk and may not be suitable for all investors. Leverage can work against you.
Stratos Markets Limited (tradu.com ):
CFDs are complex instruments and come with a high risk of losing money rapidly due to leverage. 65% of retail investor accounts lose money when trading CFDs with this provider. You should consider whether you understand how CFDs work and whether you can afford to take the high risk of losing your money.
Stratos Europe Ltd (tradu.com ):
CFDs are complex instruments and come with a high risk of losing money rapidly due to leverage. 66% of retail investor accounts lose money when trading CFDs with this provider. You should consider whether you understand how CFDs work and whether you can afford to take the high risk of losing your money.
Stratos Global LLC (tradu.com ):
Losses can exceed deposits.
Please be advised that the information presented on TradingView is provided to Tradu (‘Company’, ‘we’) by a third-party provider (‘TFA Global Pte Ltd’). Please be reminded that you are solely responsible for the trading decisions on your account. There is a very high degree of risk involved in trading. Any information and/or content is intended entirely for research, educational and informational purposes only and does not constitute investment or consultation advice or investment strategy. The information is not tailored to the investment needs of any specific person and therefore does not involve a consideration of any of the investment objectives, financial situation or needs of any viewer that may receive it. Kindly also note that past performance is not a reliable indicator of future results. Actual results may differ materially from those anticipated in forward-looking or past performance statements. We assume no liability as to the accuracy or completeness of any of the information and/or content provided herein and the Company cannot be held responsible for any omission, mistake nor for any loss or damage including without limitation to any loss of profit which may arise from reliance on any information supplied by TFA Global Pte Ltd.
The speaker(s) is neither an employee, agent nor representative of Tradu and is therefore acting independently. The opinions given are their own, constitute general market commentary, and do not constitute the opinion or advice of Tradu or any form of personal or investment advice. Tradu neither endorses nor guarantees offerings of third-party speakers, nor is Tradu responsible for the content, veracity or opinions of third-party speakers, presenters or participants.

MARKET CONTEXT...#1 TOOL FOR PROFITABLE TRADING...EURUSD EXAMPLEHey hey TradingView family! Hope you are all doing amazing! I just wanted to come on and make a video speaking on market context, the #1 tool/idea that helped me go from struggling to profitable trader.
Understanding the bigger picture in trading, like TRULY understanding the higher timeframe perspective will work wonders in your analysis & trading whether you are a scalper or a position trader. It gives you the context for what market and the stage of market you are in whether in short term or longer term positions, which will IMMEDIATELY give you an edge.
Understanding=profitability in the markets. So does simplicity.
So watch this video as many times as you guys need, keep it simple, and watch this change your trading starting TODAY for the GOOD!
Cheers!

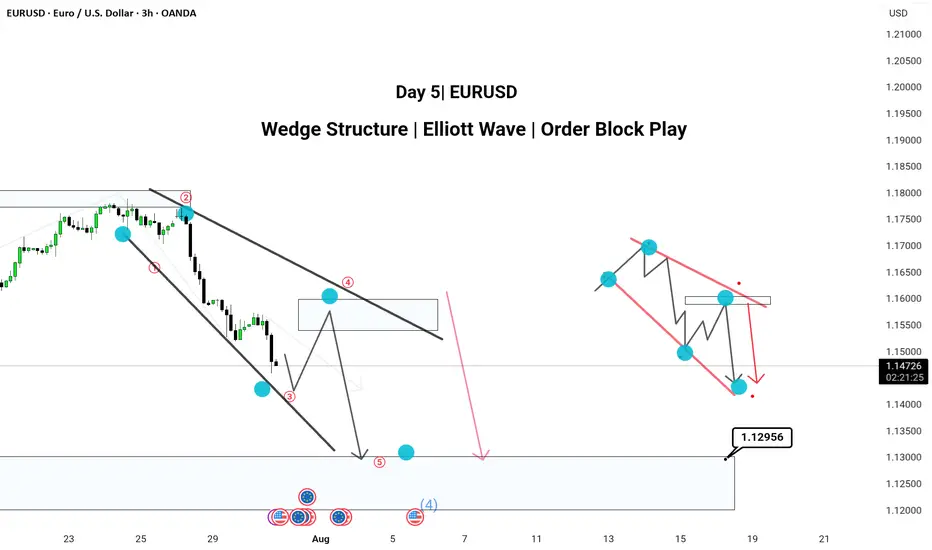
Pattern: Wedge Structure | Elliott Wave | Order Block PlayHere’s a powerful and professional description you can use when publishing this chart on TradingView:
---
🔻 Day 4 | EUR/USD Analysis 🔻
Chart Type: 3H Timeframe
---
📌 Chart Breakdown:
EUR/USD is respecting a textbook XABCD wedge pattern with clean Elliott Wave structure forming inside.
We’ve marked 5 key waves (1–5) completing within a falling wedge, aligning with a 50–60% retracement (Golden Zone) between point A and D.
🧠 Most traders miss the Golden Zone, but it’s often the clearest sign of upcoming trend continuation. Here, that continuation is bearish.
---
✅ 3H Confluence Factors:
Wedge forming within a larger downtrend
Multiple Break of Structures (BOS) confirming bearish momentum
Price targeting 1.12956 zone (mapped order block)
Elliott Wave fractals confirmed within structure
Hidden supply zone respected at Wave 4
---
📉 Expecting:
Retracement to supply → drop toward demand zone near 1.12956
---
📎 Strategy Insight:
SMC + Elliott Wave + Multi-timeframe path tool mapping gives us high confluence to expect continuation into the demand area.
💬 Comment below your views —
Do you also trade Wedges with Elliott Wave confirmation?
#EURUSD #WedgePattern #ElliottWave #SmartMoneyConcepts #OrderBlock #TechnicalAnalysis #TradingView #ForexIndia
---
EUR USD long As the EUR treaty yesterday gave strength to the USD and "made America great again," today we’re seeing a correction. This setup is based on a value gap—if price breaks through this gap, there's a strong chance it will reach the next zone quickly. A buy setup could be effective in this scenario.
Disclaimer: This analysis is for educational purposes only and does not constitute financial advice. Always do your own research before making any trading decisions.

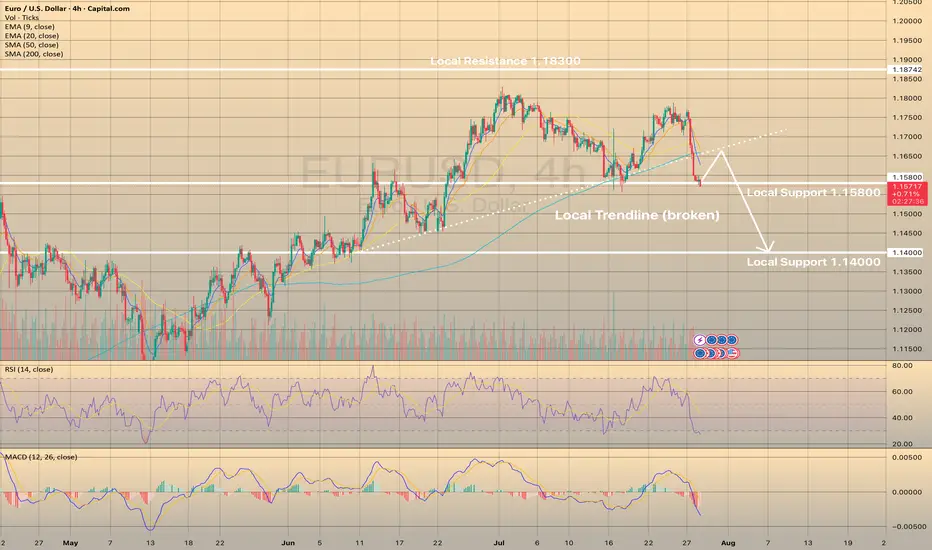
EURUSD - STRONGEST DECLINE FOR THE LAST COUPLE OF MONTHSEURUSD - STRONGEST DECLINE FOR THE LAST COUPLE OF MONTHS
EURUSD has lost 1.32% yesterday on the U.S. - E.U. trade deal. Experts suggest that the relief felt by the United States and the European Union upon reaching a trade agreement has been overshadowed by worries about the potential economic harm caused by a 15% tariff on EU imports. The dollar has recently experienced a positive trend, and this trend could continue if U.S. economic data, including Friday's employment figures, indicates a strong economy. The investors who had previously made substantial bets on the euro's appreciation are now reversing their positions, causing the euro to weaken.
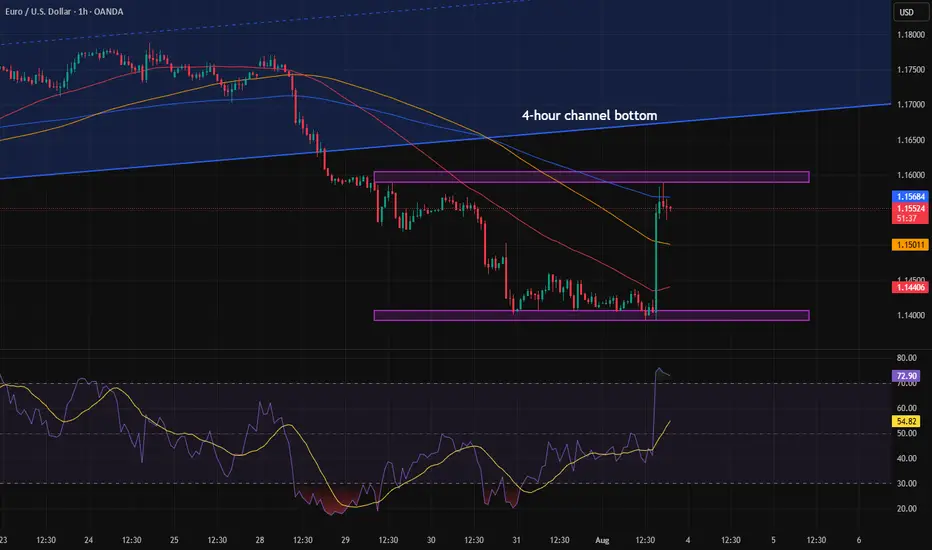
Technically, the asset broke down the local trendline and is currently trying to rebound from the local support level of 1.15800. RSI tells us that the asset is oversold, so the most possible outcome here is the EURUSD to rebound from current level, retest former trendline and continues downwards movement.
EUR/USD: Follow the yellow brick roadHello traders
I have utilized MTF(Multiple Time Frame) analysis for this idea in addition to the current fundamental environment.
The previous weekly levels can often be a good starting point for where this widely traded pair may head next.
On these charts, price has failed ahead of the weekly close of 1.1775. So far.
Fundamentally, the details of the USA/Euro Zone trade deal or framework for a deal, are not very clear yet. Which industries will be hit the hardest in Europe? Fine French wines, Stinky Swiss cheese, Monster M cars from BMW? Take your pick. In my mind, as a consumer, both the USA and the Old Country have significant strengths in different arenas.
As American consumers, we are now going to be forced to some degree to become price conscious one way or the other. Or maybe not. I'll still be sipping California, French or New Zealand wines.
As for the economy:
These "deals" DJT has made so far with Japan and the Euro Zone, once again, smacks of a strong arm policy, more than a reasonable and fair agreement. Time will be the deciding factor. As we have seen over time, trade agreements mean nothing. The WTO is a toothless institution.
The IEEPA ruling heads for the Federal Appeals Court this week and no doubt all the way to the Supreme Court.
However, based on the available information, I am observing the charts by looking back at how the markets react at the Sunday open. It tends to retest weekly OCHL levels first.
As for the USA/EURO zone deal, if it plays out according to news reports, it seems to be logical that a lot of Euros will have to be converted to USD.
But feel free to correct me.
Therefore, until Wednesday and the FOMC presser, I am short EUR/USD.
Best of luck.