EURUSD - Bullish Continuation SetupEURUSD recently retraced into a key demand zone where a 4H Fair Value Gap (FVG) aligned perfectly with the golden pocket (between 61.8% and 65% Fibonacci levels). This confluence provided a high-probability setup for a bullish reaction. After testing this level, price rebounded sharply, confirming that buyers are still active and protecting discounted imbalances.
Imbalance Reaction and Demand Strength
The initial bounce from the 4H FVG was clean, with price quickly reclaiming structure and leaving behind a fresh series of upside imbalances. These newly formed gaps are now being respected on smaller retracements, showing that the market is still imbalanced to the upside and that buyers are stepping in early during pullbacks.
Bullish/Bearish Scenarios
As long as price continues to respect these imbalances, the short-term outlook remains bullish. The next major test lies at the resistance zone around 1.14000, which previously caused a sharp rejection. A minor reaction is expected there, but if the market maintains bullish momentum, we could see a clean break above that level. A failure to hold above the smaller imbalances near 1.12800 would be the first sign of weakness and could open the door for a deeper retracement back into the original 4H FVG.
Price Target and Expectations
If the current structure holds, I expect price to push into the 1.14000 resistance zone and eventually aim for the 1.15270 level as the next major liquidity target. The current price action shows a healthy series of higher highs and higher lows, supported by imbalances being filled and respected, suggesting further upside continuation.
Conclusion
EURUSD is showing clean bullish structure following a textbook reaction from the 4H imbalance and golden pocket zone. As long as the market continues to respect the newly formed imbalances, the path of least resistance remains to the upside. Eyes are now on the resistance zone for signs of either rejection or breakout continuation.
Disclosure: I am part of Trade Nation's Influencer program and receive a monthly fee for using their TradingView charts in my analysis.
___________________________________
Thanks for your support!
If you found this idea helpful or learned something new, drop a like 👍 and leave a comment, I’d love to hear your thoughts! 🚀
USDEUX trade ideas

EUR/USD CHART PATTERN.MY EUR/USD trade setup based on the 2-hour chart pattern:
🔻 Trade Type: Short (Sell)
Entry: 1.13500
Resistance (Invalidation / Strong Resistance): 1.14140
Targets:
🎯 Target 1: 1.11300
🎯 Target 2 (Final): 1.10675
⚖️ Risk-Reward Overview
Target Reward (pips) Risk (pips) R:R Ratio
1st Target 220 64 3.44
2nd Target 282.5 64 4.41
🔹 Risk (in pips) = Resistance – Entry = 1.14140 – 1.13500 = 64 pips
🔹 Reward to 1st target = 220 pips
🔹 Reward to final target = 282.5 pips
📉 Chart Pattern Assumptions
You mentioned a 2H pattern—though you didn’t specify, based on price action this could be:
Bearish flag, double top, or rising wedge breakdown near resistance.
✅ Summary:
Excellent risk-reward profile
Tight resistance for SL
Targets are realistic if momentum shifts lower
Consider partial TP at 1.11300 and trail stop to breakeven for 1.10675

EURUSD - Potential Bearish ContinuationEURUSD recently tapped into a 4-hour Fair Value Gap, aligning perfectly with a prior liquidity sweep just above the recent swing high. This zone acted as a magnet for buy-side liquidity, and price reacted sharply once that liquidity was taken out. The rejection confirms this area was used by larger players to offload positions rather than push higher.
Rejection and Structure Shift
After the sweep and tap into the FVG, we saw an immediate and aggressive bearish reaction, signaling a clear rejection of higher prices. Momentum flipped decisively, breaking smaller structural points on the way down. The rejection is not just technical, it’s reactive, showing that the intent was never to sustain the breakout.
Break of Support Zone and Bearish Setup
Price is now testing the critical mid-range structure marked in red. This zone previously held as support multiple times, but it is now under pressure. If we get a clean 4H close below this area, it confirms a market structure shift and opens the door for further downside.
Bearish Target and Liquidity Zone Below
If the break confirms, the next logical move would be a push down into the broader support area below. That zone holds untapped liquidity and marks the base of the recent rally. A sweep of those lows would align perfectly with the narrative of a failed breakout, followed by a deeper correction.
Conclusion
The rejection from the 4H Fair Value Gap, combined with a liquidity sweep and a pending structure break, builds a clean bearish case. A confirmed close below the marked zone would shift this into a continuation setup, with expectations for a move toward the lower support and a potential sweep of the lows.
Disclosure: I am part of Trade Nation's Influencer program and receive a monthly fee for using their TradingView charts in my analysis.
___________________________________
Thanks for your support!
If you found this idea helpful or learned something new, drop a like 👍 and leave a comment, I’d love to hear your thoughts! 🚀

EUR/USD - H4 - Triangle Formation (31.05.2025)The EUR/USD pair on the H4 timeframe presents a recent Formation of a Triangle Pattern.
1. Wait for Breakout with Good Volume
2. Conformation in short Timeframe Must
🎁 Please hit the like button and
🎁 Leave a comment to support for My Post !
Fundamental Updates :
Dollar mixed on tariff uncertainty, U.S. President Donald Trump to battle a U.S. trade court ruling that blocked most of his proposed tariffs.
Your likes and comments are incredibly motivating and will encourage me to share more analysis with you.
Best Regards, KABHI_TA_TRADING
Thank you.
Disclosure: I am part of Trade Nation's Influencer program and receive a monthly fee for using their TradingView charts in my analysis.

EURUSD Analysis Today: Technical and Order Flow Analysis !In this video I will be sharing my EURUSD analysis today, by providing my complete technical and order flow analysis, so you can watch it to possibly improve your forex trading skillset. The video is structured in 3 parts, first I will be performing my complete technical analysis, then I will be moving to the COT data analysis, so how the big payers in market are moving their orders, and to do this I will be using my customized proprietary software and then I will be putting together these two different types of analysis.

EUR/USD4H Bearish Trade Setup Supply Zone Rejection with 3:1 RRR🔷 Trend Overview
📈 Price was in a rising channel (trend line + support line).
❌ Channel broken on downside → potential trend reversal.
🟧 🔼 Supply Zone (Sell Area)
📍 Zone: 1.13707 – 1.14432
🟠 Price faced rejection here.
💡 Institutional selling likely in this zone.
🔥 This is the ideal short-entry area.
🟦 🔽 Entry Point
🎯 Entry: Around 1.13694
🧩 Sits just below supply zone = safer trigger.
✅ Wait for a bearish confirmation candle before entering.
🟨 Support Level
📉 Support Zone: ~1.13100 – 1.13400
📊 Recently broken with a strong bearish candle.
🧱 Used to act as a floor, now may act as resistance.
🟩 🎯 Target Point
✅ Take Profit: 1.10970
📎 Matches previous structure support.
💰 Lock in profits before the psychological level at 1.1100.
🟥 ⛔ Stop Loss
❌ Stop: 1.14419
📏 Placed above the supply zone for protection.
🛡️ Shields from false breakouts or spikes.
⚖️ Risk-to-Reward Ratio (RRR)
💡 Approx. 3:1 ✅
📉 Risk: ~70 pips
📈 Reward: ~270 pips
🔥 High-probability setup
📌 EMA (Exponential Moving Average – 70)
📍 EMA 70 at 1.13102
🔻 Price is below the EMA → favors bearish momentum
🧠 Pro Tips:
🔍 Watch for bearish engulfing or rejection candles at the entry zone.
🗓️ Be aware of major news events (ECB, Fed).
🧮 Adjust lot size for risk management (based on SL size).
✅ Summary:
🧩 Element 📊 Value
Trade Type 🔻 Short (Sell)
Entry Point 📌 1.13694
Stop Loss ⛔ 1.14419
Take Profit 🎯 1.10970
RRR ⚖️ ~3:1
Sentiment 📉 Bearish

#EURUSD: Nothing to expect from DXY| View Changed Swing Trading|Hey there! So, we were previously thinking EURUSD was going to be bearish, but things have turned around and it’s looking bullish for now.
The extreme bearish pressure on USD has caused all the major USD pairs to be in a range. As the week goes on and we get the NFP data, the market will probably focus more on these economic indicators. So, it’s not surprising to see some market ranges during this time.
We’ll keep a close eye on the market, as there might be some manipulation going on this week.
We recommend waiting until Monday’s daily candle closes to see if the bullish trend is strong enough. Then, based on the price momentum, you can make your decisions.
We hope you have a great week and safe trading! If you like our work and analysis, please consider liking, commenting, and sharing our content.
Cheers,
Team Setupsfx
❤️🚀

EURO - Price can boucne up of pennant, breaking resistance levelHi guys, this is my overview for EURUSD, feel free to check it and write your feedback in comments👊
Some time ago, price entered to pennant pattern, where it at once bounced up from support line and reached $1.0850 level.
Next, it broke this level and continued to grow to resistance level, and when Euro reached it, price broke it.
But, after price reached resistance line of pennant, it started to decline and soon broke $1.1380 level one more time.
Price fell to support line of pennant and then turned around and, in a short time rose to resistance area.
After this, price fell to support line of pennant, but recently started to grow and now trades near resistance level.
I believe Euro can correct slightly and then launch upward toward $1.1600, breaking resistance level.
If this post is useful to you, you can support me with like/boost and advice in comments❤️
Disclaimer: As part of ThinkMarkets’ Influencer Program, I am sponsored to share and publish their charts in my analysis.

EURUSD I Weekly CLS I Model 2 I Target CLS 1I2 LowsHey, Market Warriors, here is another outlook on this instrument
If you’ve been following me, you already know every setup you see is built around a CLS Footprint, a Key Level, Liquidity and a specific execution model.
If you haven't followed me yet, start now.
My trading system is completely mechanical — designed to remove emotions, opinions, and impulsive decisions. No messy diagonal lines. No random drawings. Just clarity, structure, and execution.
🧩 What is CLS?
CLS is real smart money — the combined power of major investment banks and central banks moving over 6.5 trillion dollars a day. Understanding their operations is key to markets.
✅ Understanding the behavior of CLS allows you to position yourself with the giants during the market manipulations — leading to buying lows and selling highs - cleaner entries, clearer exits, and consistent profits.
📍 Model 1
is right after the manipulation of the CLS candle when CIOD occurs, and we are targeting 50% of the CLS range. H4 CLS ranges supported by HTF go straight to the opposing range.
"Adapt what is useful, reject what is useless, and add what is specifically your own."
— David Perk aka Dave FX Hunter ⚔️
👍 Hit like if you find this analysis helpful, and don't hesitate to comment with your opinions, charts or any questions.

EURUSD Breakout and Potential RetraceHey Traders, in today's trading session we are monitoring EURUSD for a buying opportunity around 1.13700 zone, EURUSD was trading in a downtrend and successfully managed to break it out. Currently is in a correction phase in which it is approaching the retrace area at 1.13700 support and resistance area.
Trade safe, Joe.

Stronger U.S. JOLTS Data Pressures EURUSD!!!EURUSD ( FX:EURUSD ) failed to break the Resistance zone($1.1487-$1.1424) and started to fall again , breaking the Support lines .
In terms of Elliott Wave theory , it seems that EURUSD has managed to complete the main wave X of the Double Three Correction(WXY) structure .
Just moments ago, the U.S. JOLTS Job Openings data was released.
-------------------------------
Actual: 7.39M
Forecast: 7.11M
Previous: 7.19M
The stronger-than-expected JOLTS figure at 7.39 million signals a resilient labor market. This reduces recession fears and increases the likelihood that the Federal Reserve may keep interest rates elevated for longer.
Bullish for the U.S. Dollar( TVC:DXY )
Bearish pressure could hit EURUSD, especially if it's approaching the key resistance zone.
-------------------------------
I expect EURUSD to start to fall again after the pullback to the Support lines and to fall to the targets I have specified on the chart.
Note: If EURUSD touches $1.14580(Stop Loss(SL)), we can expect a failure of the Resistance zone($1.1487-$1.1424).
Please respect each other's ideas and express them politely if you agree or disagree.
Euro/U.S. Dollar Analyze (EURUSD), 1-hour time frame.
Be sure to follow the updated ideas.
Do not forget to put a Stop loss for your positions (For every position you want to open).
Please follow your strategy and updates; this is just my Idea, and I will gladly see your ideas in this post.
Please do not forget the ✅' like '✅ button 🙏😊 & Share it with your friends; thanks, and Trade safe.

Lingrid | EURUSD Bullish Trendline Breakout. Potential LongFX:EURUSD continues to build strength above the 1.13720 resistance-turned-support line, supported by the upward channel structure. The pair is squeezing between the ascending trendline and the descending blue trendline, with higher lows signaling steady bullish pressure. A confirmed breakout above 1.14400 would likely trigger a move toward the 1.15700 target level inside the resistance zone. Price action favors bulls while the channel base holds.
📈 Key Levels
Buy zone: 1.13720–1.14000
Buy trigger: breakout above 1.14400
Target: 1.15700
Sell trigger: close below 1.13720
💡 Risks
A rejection from the downward trendline could trap breakout buyers
Choppy behavior within the wedge may cause false signals
Broader dollar strength could cap gains if macro data shifts unexpectedly
Traders, if you liked this idea or if you have your own opinion about it, write in the comments. I will be glad 👩💻

Euro will rise to seller zone and then drop to support lineHello traders, I want share with you my opinion about Euro. At first, price was moving inside a downward channel, forming lower highs and lower lows. Each rejection from the resistance line pushed the price lower, and the structure remained bearish until the price reached the buyer zone near 1.1210 - 1.1185 points. A strong rebound from this area triggered a breakout from the channel, signaling a shift in market dynamics. After this breakout, the trend reversed and price started forming an upward channel, with clean impulses and structured corrections. Bulls began stepping in from higher support levels, and the market started respecting the new rising support and resistance lines. Now the price is approaching the seller zone at 1.1435 - 1.1460 points and has already shown signs of rejection from that area. Given this setup, I believe EURUSD may start to decline and fall back toward the support line of the upward channel. That’s why I’ve placed my TP at 1.1325 points, which aligns with the channel's support structure. Please share this idea with your friends and click Boost 🚀
Disclaimer: As part of ThinkMarkets’ Influencer Program, I am sponsored to share and publish their charts in my analysis.

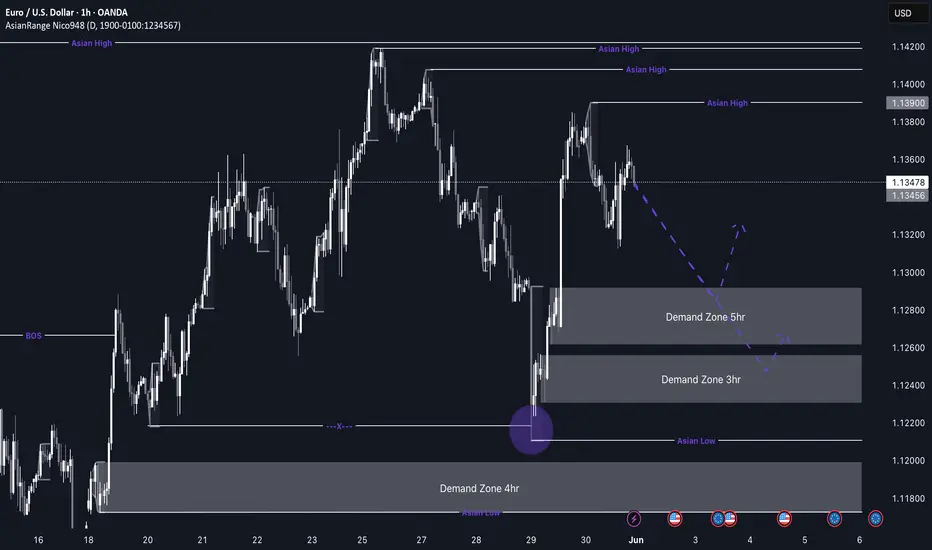
EUR/USD Potential longs to the upsideEU Weekly Outlook — Bullish Pro-Trend Setup in Focus
This week, my EU analysis is centered around the pro-trend movement to the upside. Price has recently broken structure and in doing so, has left behind clean demand zones on the 5H and 3H timeframes. I’ll be watching closely to see when price decides to mitigate these levels for a potential long setup.
Since price is still a bit far from these zones, short-term sells may be possible, but with no strong nearby supply, I’ll be staying patient and letting price action guide me. The key is to avoid marrying any one bias and remain adaptable.
Confluences for EU Buys:
- Strong bullish structure on higher timeframes
- Clean and unmitigated 5H and 3H demand zones
- Plenty of liquidity above, including Asia highs
- This is a pro-trend trade, aligning with market flow
- DXY analysis supports a bullish EU outlook
P.S. If price shifts and breaks structure to the downside, then we could consider short-term sell setups — but for now, I’m focused on the long opportunity forming from demand.
Have a great trading week and stay sharp! 🧠💹
EURUSD 15 MIN Long📊 EUR/USD Smart Money Concept Trade Idea – 15-Minute Chart
This setup highlights a textbook example of how market structure, liquidity grabs, and Fibonacci confluence can provide high-probability trade setups.
🔍 Breakdown:
Support Respected (Left Side)
Price previously respected a key support zone, leading to a strong bullish impulse.
Previous Support → Resistance Flip
Once price revisited this zone (marked in red), it failed to hold, indicating a shift in sentiment. This became a liquidity zone where early buyers got trapped.
Liquidity Grab (Red Line)
Notice how price dipped below the previous swing low, triggering stop-losses from buyers. This is a liquidity grab, a classic smart money move to fuel large buy orders.
Structure Shift (Green Label)
After the liquidity grab, price formed a higher high, indicating a potential shift in market structure from bearish to bullish.
50% Fibonacci Level (Green Line)
The price then retraced perfectly to the 50% Fibonacci level of the bullish leg post-liquidity grab – a golden zone often used by institutions for entries.
Re-Entry After Pullback
The retracement to the 50 FIB level after the structure shift provided a low-risk, high-reward long opportunity, targeting the previous liquidity zone (blue line) as take-profit.
Target & Stop Placement
Entry: Around the 50 FIB level
Stop: Below the liquidity grab low
Take Profit: Near the previous liquidity zone (marked in blue), where many sell-side stops likely sit

EUR/USD - Sweeping the highs, retracement following?The EUR/USD has experienced a steep and aggressive bullish run today, showing strong upward momentum across multiple timeframes. This impulsive move has led to a sweep of the recent highs, taking out key liquidity levels that were resting above previous swing points. In the context of smart money concepts and institutional trading models, such a move typically signifies the activation of buy-side liquidity, where stop-loss orders and breakout entries are triggered above a well-defined high. This behavior is often engineered by larger market participants to fulfill liquidity objectives before potentially reversing or retracing.
During this strong bullish leg, the EUR/USD left behind a noticeable imbalance, commonly referred to as a Fair Value Gap (FVG), on the lower timeframes. This imbalance reflects an area where price moved too rapidly, leaving behind unfilled orders and creating a price inefficiency. Specifically, an FVG remains open around the 1.13700 level, a zone that was bypassed during the impulsive rally and now stands as a likely magnet for price in the near term. These imbalances are significant because price tends to revisit them to seek equilibrium and fill in the inefficient areas, especially after a major liquidity grab.
The sweep of the highs was a classic liquidity-taking event. When price runs above a prominent high, especially one that's visible on higher timeframes like the 4H or daily, it often signals that buy stops (retail breakout entries or protective stops) have been targeted. Once these stops are taken, there is typically a shift in market behavior. The aggressive buyers have been filled, and institutional players may look to reverse or retrace price toward areas of unfilled orders, such as the aforementioned FVG. The market often transitions from a state of expansion (impulse move) to a state of rebalancing or consolidation, which opens the door for a pullback.
Given that the liquidity above the highs has been taken and that the 1.13700 gap remains unmitigated, it becomes increasingly likely that EUR/USD will begin a retracement. This corrective move would serve to rebalance the price, revisit the inefficiency, and potentially test the validity of any newly-formed demand zones. From a technical standpoint, this area is crucial, not only because of the gap itself but also due to its positioning in relation to prior market structure.
In summary, today’s bullish extension in EUR/USD accomplished a major liquidity objective by sweeping the highs. However, the move left behind a significant imbalance at 1.13700, suggesting that the pair could be due for a corrective pullback to fill the gap. Traders should monitor lower timeframes for signs of distribution, potential shifts in market structure, or bearish order blocks forming after the sweep. All of these could provide clues that the market is preparing to return to the gap and restore price efficiency.
Thanks for your support.
- Make sure to follow me so you don't miss out on the next analysis!
- Drop a like and leave a comment!

EURUSD → False breakout of resistance. Correction?FX:EURUSD is strengthening amid a decline in the dollar, but the currency pair is encountering strong resistance and forming a false breakout, which could trigger a correction.
EURUSD is testing the resistance range as part of a distribution and forming a false breakout. The market structure is bullish, with the price breaking through local resistance and updating its high. The inability to continue growth and price consolidation below 1.1418 may trigger a correction. The dollar is also hitting support and may form a small correction, which will put pressure on EURUSD
Resistance levels: 1.14246, 1.1418
Support levels: 1.1384, 1.1343
If the currency pair fails to consolidate above 1.14246 during the resistance retest in order to continue its growth, then we can expect price consolidation below this level to open a short position. The correction may reach the specified support zones before continuing its growth.
Best regards, R. Linda!

Trading Signals for EUR/USD sell below 1.1432 (21 SMA-6/8 MurrayEUR/USD is trading around 1.1410, below the Murray 6/8 level and within the uptrend channel formed on May 9.
The instrument has an area where buyers have found it easier to take profits around 1.1476. This level could be a barrier for the euro, and from there we could expect a technical correction.
If the bullish force prevails, the euro could reach the top of the uptrend channel around 1.1474 and even the psychological level of 1.1500.
Technically, we observe that the euro is overbought and there could be a technical correction in the coming days, as crucial data from the United States will be released later this week, which could generate strong volatility in the market.
The indicator is showing a negative signal, so if an additional upward movement occurs above the current price, we could consider selling as long as the instrument consolidates below 1.1500.

EURUSD: Important Bullish Breakout The EURUSD broken above an important resistance zone on the daily chart.
We see its retest now.
I anticipate that the price will continue to rise from this point, aiming for a minimum target of 1.1515.

EURUSD Analysis – Short Bias Builds on Key Resistance RejectionEURUSD pair is currently testing a critical resistance zone around 1.1495–1.1500, with bearish rejection beginning to form on the 4H timeframe. The technical setup suggests a potential lower high forming within the context of a broader downtrend, supported by a confluence of horizontal resistance and bearish risk catalysts.
🔍 Technical Overview:
Resistance Zone: 1.1495–1.1575 (multi-timeframe key levels)
Support Levels to Watch: 1.1234 (range base) and 1.1086 (swing low)
Price Action: After a sustained rally, price is showing exhaustion near previous highs, and a rejection pattern is emerging, suggesting selling interest.
Risk Management: Stop placed above 1.1575 high, with downside targets near 1.1234 and extended toward 1.1086.
🧠 Fundamental Backdrop:
ECB Policy Outlook: Lagarde recently warned that a stronger euro and higher tariffs may hurt EU exports. This dovish tone could weigh on EUR sentiment in the medium term.
US Dollar Strengthening: The latest US labor market data (ADP, JOLTS) beat expectations, showing continued resilience in employment and wage growth. This supports the Fed's data-dependent approach, favoring a stronger USD.
Macro Tensions: Global trade concerns (Trump’s tariffs, weak China demand, Germany’s slowing job market) are adding pressure to EUR while supporting safe-haven USD flows.
ECB Consumer Expectations Survey (April): Highlights persistent inflation fears and deteriorating economic confidence.
⏳ Scenario Outlook:
✅ Bearish Bias Preferred below 1.1500 with confirmation of rejection.
🎯 Target Zone 1: 1.1234 – Strong structure & demand zone.
🎯 Target Zone 2 (Extended): 1.1086 – Major low from mid-May.
❌ Invalidation: A breakout and close above 1.1575 would neutralize the bearish outlook and open up higher targets toward 1.17.
Conclusion: The EURUSD pair presents a compelling short opportunity, with both technical resistance and macro pressure aligning for a retracement or reversal. Short setups are favored unless bulls reclaim and hold above the 1.1575 handle.

EURO - Price can drop to $1.1280, breaking support levelHi guys, this is my overview for EURO, feel free to check it and write your feedback in comments👊
A few days ago price broke $1.1375 level and then entered to triangle pattern, where it at once dropped from resistance line.
Price fell to $1.1375 level, where it some time traded between and then continued to decline to $1.1220 level.
When Euro declined to this level, it at once broke this level and fell to support line of a triangle pattern.
Next, price turned around and in a short time rose higher than $1.1220 level, breaking it and continued to grow next.
Euro rose to resistance line and then corrected, after which it made an upward impulse, thereby exiting from triangle.
Now, price traded inside resistance area, near $1.1375 level, and I think EUR can drop to $1.1280
If this post is useful to you, you can support me with like/boost and advice in comments❤️
Disclaimer: As part of ThinkMarkets’ Influencer Program, I am sponsored to share and publish their charts in my analysis.

EUR/USD) Bearish breakout analysis Read The ChaptianSMC trading point update
Technical analysis of EUR/USD on the 1-hour timeframe, likely projecting a short-term downward move. Here’s a breakdown of the technical analysis and the trade idea:
---
Key Elements in the Chart:
1. Bearish Rejection from Resistance:
Price was rejected twice near the 1.14400 resistance zone (highlighted in yellow).
The red arrows mark double rejection at this level, suggesting strong selling pressure.
2. Break of Rising Channel:
Price was previously moving inside a rising channel.
Recent price action shows a clear breakdown below the lower trendline, indicating trend reversal.
3. 200 EMA (Exponential Moving Average):
EMA is around 1.13188 and price is below it, reinforcing bearish momentum.
EMA also acted as dynamic resistance after the channel breakdown.
4. Target Zone – Support Area:
The yellow support zone around 1.10911 is the target point.
This was a previous area of price consolidation and demand.
5. RSI (Relative Strength Index):
RSI is near 51, hovering around the neutral zone.
Not strongly bearish yet, but room remains to drop toward oversold if the downtrend continues.
---
Trade Idea Summary:
Bias: Bearish
Scenario:
Price has broken a key structure and is retesting the breakdown.
Expect continuation toward the 1.10900 support zone.
Entry Zone:
Near current price (~1.13400–1.13500), ideally on a retest of the EMA or broken trendline.
Target:
1.10911 (highlighted support level).
Stop-Loss (Invalidation):
A break and close back above the resistance zone (~1.14000–1.14200).
Mr SMC Trading point
---
Conclusion:
This is a high-probability bearish setup following a structure break, retest, and double top rejection. It targets a move back down toward a previously strong support level, with a favorable risk-to-reward ratio.
Pales support boost 🚀 analysis follow)

How to Secure Prop Firm Funding: Proven Strategies to Pass1️⃣ How to Secure Prop Firm Funding: Proven Strategies to Pass Challenges 📈
Introduction ✨
Securing prop firm funding opens the door to trading substantial capital and achieving financial freedom. However, passing these evaluations requires meticulous strategy, disciplined execution, and smart risk management. This article provides actionable strategies, optimized trading setups, and insights on leveraging AI to ensure you successfully navigate and pass your prop firm challenges.
Understanding Prop Firm Evaluations 📊🔍
Prop firm challenges typically include specific trading objectives:
💰 Profit targets (8–10% within 30 days)
⛔ Daily loss limits (usually 5%)
📉 Maximum drawdown limits (typically 10%)
💡 Tip: Print the rules and display them at your workspace to avoid rule breaches.
Focus on One High-Probability Strategy 📌🎯
Consistently profitable traders use one rigorously tested strategy. For example, a popular setup:
🔄 Liquidity Sweep: Wait for price to clear stops above recent highs or lows.
⚡ Market Structure Break (BOS): Enter after price breaks and confirms a new trend.
📥 Entry: Order block (OB) or Fair Value Gap (FVG).
Example Trade:
🔗 Pair: EUR/USD
🔽 Entry: OB after sweep at 1.0800
🛑 Stop Loss (SL): 1.0820
🎯 Take Profit (TP): 1.0740
📊 Risk-to-Reward Ratio (RRR): 3:1
Start Small, Think Big 🧠🌱
Initially, risk only 0.5% per trade to maintain psychological comfort and buffer against drawdowns. Increase risk gradually once you have a profit cushion.
Leverage AI Insights 🤖📊
Modern traders enhance decision-making using AI-driven tools:
🟢 AI indicators for real-time liquidity detection
🔵 Predictive analytics for entry confirmations
Efficient Risk Management 🛡️⚖️
Set daily and weekly risk limits. For instance:
⏳ Maximum daily risk: 1%
📅 Weekly drawdown cap: 3%
Practical Example:
💵 If trading a $100,000 account, never risk more than $1,000 in a single day.
Journaling for Improvement 📒📝
Record every trade’s rationale, execution details, and outcome. This fosters accountability and improvement.
Conclusion ✅
Securing prop funding isn't about luck but disciplined, strategic execution. Optimize your trading, leverage technology, and strictly manage risk to ensure long-term success. 🏆
