ERUSUD: BookMost of us read books on FX trading, hopefully, we can pick up something new, something useful. All the books I had read to date are not useful. I think common sense tells me to forget about them.
But lucky me, I think one book stands out. Written by a nobody. But the method is quite original. His name is Gabriele Fabris. I bet none of you have heard of him or his method.
If I had applied his method to trading EURUSD, the win rate would not be favourable, but his core argument is to make use of time when it matters the most. This provides the basis to understand price movement better. With a bit of research and refinement, it is indeed very useful. Much better than the usual ABCD.
ABCD tells us WHERE and WHEN. It does not tell us the WHY. Which is why when the price reaches the 'D', we can only hope it bounces instead of pushing through.
WHY is the key - I think knowing the intention of the MARKET is crucial - better to let the market reveal itself, then trade along with it. I think the back testing looks good.
Let's see if this method can correctly 'predict' the WHEN, WHERE, and WHY price will pivot this time. It is a long way down.
Good luck.
USDEUX trade ideas

#AN011: NATO Summit, 5% for Defense
Hello, I am Forex Trader Andrea Russo and after the NATO Summit meeting, I want to analyze the situation a bit. Remember that my opinions are strictly personal and what I say may not reflect your thoughts. I do not write with a political or personal ideology. I analyze the situation objectively.
I thank in advance our Official Partner Broker PEPPERSTONE for the support in creating this article.
🔍 Key points of the NATO Summit
Yesterday's NATO Summit in The Hague attracted global attention, with the 32 member countries committing to a strong increase in defense spending, with the goal of 5% of GDP by 2035, of which 3.5% for basic military spending and 1.5% for broader security measures, such as strengthening cybersecurity and infrastructure.
US President Trump praised the outcome as a "major victory" and stressed that increased spending would likely benefit US defense contractors, while reaffirming NATO's commitment to Article 5.
However, countries such as Spain have expressed concern, indicating that it could include military aid rather than pure budget increases.
📈 Financial Market Reaction
🔹 Defense & Aerospace Stocks
Major defense companies across Europe posted immediate gains:
Babcock (UK) +10.7%,
Rheinmetall (Germany) +3.1%,
Thales (France) +2%+,
Leonardo (Italy) +2.6%
🔹 Bond & Currency Action
According to KBC Bank market commentary:
The bond market steepened bearishly, particularly in Europe, as governments are reassessing their fiscal balances to accommodate defense budgets.
The US dollar remained strong, supported by dovish Fed expectations, countering the spike in bond yields.
🌍 Currency Market Implications
EUR/USD:
The momentum of a dovish Fed and US fiscal pressure could support the dollar. However, divergence in bond yields could support moderate euro strength if the ECB remains cautious.
EUR-linked currencies (e.g. SEK, NOK):
These could come under pressure from rising risk premia and possible increase in government bond issuance.
JPY and CHF:
Likely to benefit from high volatility and safe-haven flows amid geopolitical tensions.
🧭 Strategic Outlook
Theme Market Impact
Increased defense spending Supports government bonds, increases government bond yields.
Fiscal tightening Increases credit risk premia.
US defense dominance Strengthens the USD in the short to medium term.
Geopolitical unity Strengthens investor confidence, mitigates risk-off tendencies.
📝 Conclusion
NATO summit signals a geopolitical shift that extends to currency and credit markets. Forex traders should pay attention to:
Yield changes in the US versus Europe due to increased deficit financing.
Currency inflows into the US dollar on defense and risk themes.
Safe-haven demand if tensions in Russia-Ukraine or the Middle East flare up again.
Thanks a lot for making it this far. Stay tuned for more analysis.
Trading a Significant Divergence on EURUSDI saw a huge bearish divergence in EURUSD as the price moving up without backed up by volume. And also its MACD showing lower high vs the price making a higher high.
I am selling EURUSD for correction or trend reversal, both are possible from this level.

EURUSD LAST LIQUIDITY GRAB BEFORE WE CRUSH :))Take 15m SELL as seen on the chart, with help of DIVENGANCE @ LIQUIDITY AREA give me more reason to take this SELL
I can see all the way to 1.113 but we will take profit along the way till final destination
Monday was horrible but Tuesday can be our start of the week :)
Thats trading for you :))

Euro Falls Soon It is my opinion. EUR is too high. It should to be lesser than now. It needs to go down and wants touch their lovely supports.

EUR/USD Analysis: Rally May Be Under ThreatEUR/USD Analysis: Rally May Be Under Threat
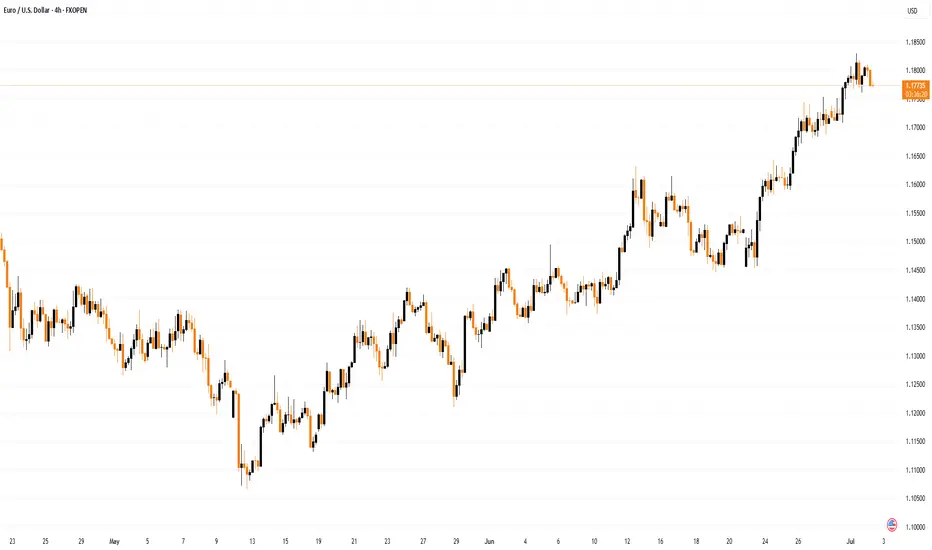
The euro has appreciated by approximately 15% against the US dollar this year, as confidence in the United States continues to wane. As ECB Chief Economist Philip Lane noted in an interview at CNBC: “There is a degree of reorientation by global investors towards the euro.”
At the same time, officials at the European Central Bank have expressed concern that the rapid strengthening of the euro could undermine efforts to stabilise inflation at 2%. They warn that a move above $1.20 may pose risks for inflation and the competitiveness of export-oriented firms — an issue raised during the ECB’s ongoing ECB Forum on Central Banking in Portugal.
Could EUR/USD Reach the $1.20 Level?
From a technical analysis perspective, EUR/USD is showing bearish signals:
→ If the early April rally (coinciding with Trump’s announcement of new tariffs) is taken as the initial impulse wave A→B, and the May low is interpreted as the end of the B→C corrective move, then, according to Fibonacci Extensions, the pair has now risen to a key resistance zone around 1.1850 (as indicated by the arrow on the chart).
→ In addition, the RSI indicator signals strong overbought conditions, while the price is hovering near the upper boundary of the ascending channel — a level that typically acts as resistance.
Given these factors, we could assume that EUR/USD may be in a vulnerable position, potentially facing a short-term correction — possibly towards the lower boundary of the channel, reinforced by support at the 1.1620 level. However, this does not negate the longer-term bullish outlook for the euro amid prevailing fundamental conditions.
This article represents the opinion of the Companies operating under the FXOpen brand only. It is not to be construed as an offer, solicitation, or recommendation with respect to products and services provided by the Companies operating under the FXOpen brand, nor is it to be considered financial advice.
Euro Dollar, institutions are still bullish ($1.20 this summer?)There's one constant on the floating exchange market (Forex) this year, the US dollar is by far the weakest currency. It's the same scenario as the first months of Donald Trump's first term in office in 2017 repeating itself. The US President's stated aim is to give US exporters a competitive exchange rate.
The Euro exchange rate is also being supported higher by a combination of fundamental factors, notably a relative catch-up of European assets against US stock market assets. It is the sum of these fundamentals that is enabling a well-constructed uptrend in the EUR/USD rate on FX this year 2025. A new monthly technical close was recorded on the evening of Monday June 30, and with technical resistances breached, it looks as if the euro-dollar rate is on course to reach $1.20 this summer.
1) A new monthly technical close (June technical close) continues to support the euro-dollar's annual uptrend
The June technical close has been in place for the euro-dollar since the start of the week, providing further bullish chart confirmation. The euro-dollar price has confirmed that it has broken through a descending resistance line in place since the 2008 financial crisis. The price is converging with its momentum (represented here by the RSI and LMACD technical indicators) and the next natural technical target lies at $1.20. This is a technical target for the summer, bearing in mind that in the short term, a move back towards support at $1.15 and $1.17 remains possible.
The chart below shows monthly Japanese candlesticks for the EUR/USD rate, with the Ichimoku, RSI and LMACD technical indicators
2) Institutional traders are still bullish on the euro-dollar rate, according to the CFTC's COT report
What's most interesting about the overall analytical approach is the convergence between technical analysis signals and institutional positioning signals on the EUR/USD rate.
According to the CFTC's COT (Commitment Of Traders) report, institutional traders (hedge funds + asset managers) became net buyers of the euro dollar at the start of 2025, and weekly updates of this positioning data show that their buying exposure is increasing as the EUR/USD price rises. This bullish convergence between chartism and institutional investor positioning lends credibility to a scenario that would see the euro dollar reach resistance at $1.20 this summer. This market view would be invalidated if support at $1.14 were broken.
The two charts below show institutional traders' positions on Euro Dollar futures. Institutional traders were predominantly bullish at the start of the year, and month after month, they are increasing their buying exposure.
DISCLAIMER:
This content is intended for individuals who are familiar with financial markets and instruments and is for information purposes only. The presented idea (including market commentary, market data and observations) is not a work product of any research department of Swissquote or its affiliates. This material is intended to highlight market action and does not constitute investment, legal or tax advice. If you are a retail investor or lack experience in trading complex financial products, it is advisable to seek professional advice from licensed advisor before making any financial decisions.
This content is not intended to manipulate the market or encourage any specific financial behavior.
Swissquote makes no representation or warranty as to the quality, completeness, accuracy, comprehensiveness or non-infringement of such content. The views expressed are those of the consultant and are provided for educational purposes only. Any information provided relating to a product or market should not be construed as recommending an investment strategy or transaction. Past performance is not a guarantee of future results.
Swissquote and its employees and representatives shall in no event be held liable for any damages or losses arising directly or indirectly from decisions made on the basis of this content.
The use of any third-party brands or trademarks is for information only and does not imply endorsement by Swissquote, or that the trademark owner has authorised Swissquote to promote its products or services.
Swissquote is the marketing brand for the activities of Swissquote Bank Ltd (Switzerland) regulated by FINMA, Swissquote Capital Markets Limited regulated by CySEC (Cyprus), Swissquote Bank Europe SA (Luxembourg) regulated by the CSSF, Swissquote Ltd (UK) regulated by the FCA, Swissquote Financial Services (Malta) Ltd regulated by the Malta Financial Services Authority, Swissquote MEA Ltd. (UAE) regulated by the Dubai Financial Services Authority, Swissquote Pte Ltd (Singapore) regulated by the Monetary Authority of Singapore, Swissquote Asia Limited (Hong Kong) licensed by the Hong Kong Securities and Futures Commission (SFC) and Swissquote South Africa (Pty) Ltd supervised by the FSCA.
Products and services of Swissquote are only intended for those permitted to receive them under local law.
All investments carry a degree of risk. The risk of loss in trading or holding financial instruments can be substantial. The value of financial instruments, including but not limited to stocks, bonds, cryptocurrencies, and other assets, can fluctuate both upwards and downwards. There is a significant risk of financial loss when buying, selling, holding, staking, or investing in these instruments. SQBE makes no recommendations regarding any specific investment, transaction, or the use of any particular investment strategy.
CFDs are complex instruments and come with a high risk of losing money rapidly due to leverage. The vast majority of retail client accounts suffer capital losses when trading in CFDs. You should consider whether you understand how CFDs work and whether you can afford to take the high risk of losing your money.
Digital Assets are unregulated in most countries and consumer protection rules may not apply. As highly volatile speculative investments, Digital Assets are not suitable for investors without a high-risk tolerance. Make sure you understand each Digital Asset before you trade.
Cryptocurrencies are not considered legal tender in some jurisdictions and are subject to regulatory uncertainties.
The use of Internet-based systems can involve high risks, including, but not limited to, fraud, cyber-attacks, network and communication failures, as well as identity theft and phishing attacks related to crypto-assets.

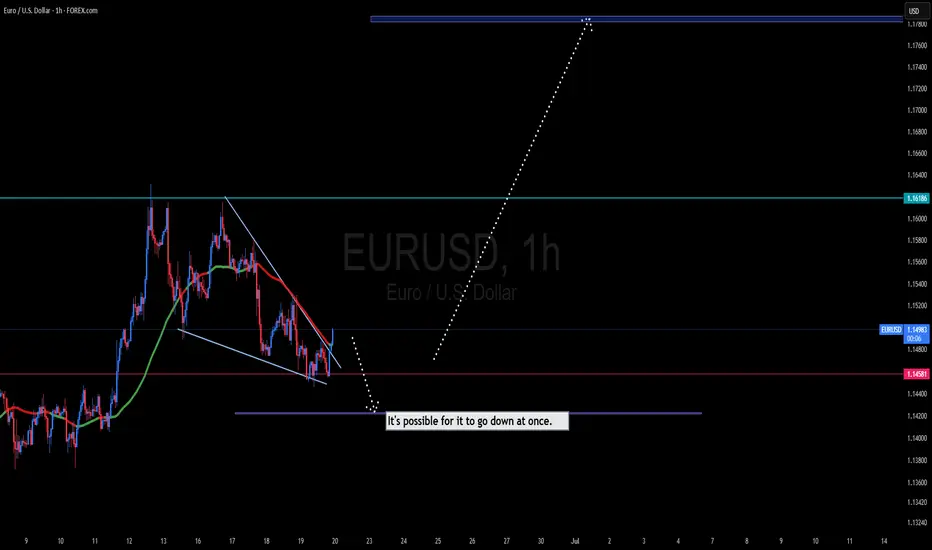
Eurusd 1Hr chart Analaysis EUR/USD is currently in a bullish trend and is expected to reach the 1.17801 – 1.18010 range. A bearish retracement is likely to occur around those levels.
Note: Ongoing tensions in the Middle East could have a significant impact on the market.
EUR/USD at resistanceAs you can see this trend line on the weekly goes back quite a ways, it was supported by and now has become resistance. Unless it closes above on the weekly timeframe, this area is a good short zone

EUR/USD 4H CHART IDEA"EUR/USD is currently trading within a key price range, showing signs of consolidation after recent volatility. The pair is testing support near the 1.0700 level while facing resistance around 1.0800. A breakout from this zone could set the tone for the next directional move. Traders should monitor upcoming economic data from the Eurozone and the US, as it may trigger strong momentum either way. The trend remains neutral in the short term, awaiting a clear confirmation."
This is just an idea not financial advice.

EURUSD Potential UpsidesHey Traders, in the coming week we are monitoring EURUSD for a buying opportunity around 1.14500 zone, EURUSD is trading in an uptrend and currently is in a correction phase in which it is approaching the trend at 1.14500 support and resistance area.
Trade safe, Joe.

Bullish rise?The Fiber (EUR/USD) has broken out of the pivot and could rise to the 1st resistance.
Pivot: 1.1569
1st Support: 1.1530
1st Resistance: 1.1631
Risk Warning:
Trading Forex and CFDs carries a high level of risk to your capital and you should only trade with money you can afford to lose. Trading Forex and CFDs may not be suitable for all investors, so please ensure that you fully understand the risks involved and seek independent advice if necessary.
Disclaimer:
The above opinions given constitute general market commentary, and do not constitute the opinion or advice of IC Markets or any form of personal or investment advice.
Any opinions, news, research, analyses, prices, other information, or links to third-party sites contained on this website are provided on an "as-is" basis, are intended only to be informative, is not an advice nor a recommendation, nor research, or a record of our trading prices, or an offer of, or solicitation for a transaction in any financial instrument and thus should not be treated as such. The information provided does not involve any specific investment objectives, financial situation and needs of any specific person who may receive it. Please be aware, that past performance is not a reliable indicator of future performance and/or results. Past Performance or Forward-looking scenarios based upon the reasonable beliefs of the third-party provider are not a guarantee of future performance. Actual results may differ materially from those anticipated in forward-looking or past performance statements. IC Markets makes no representation or warranty and assumes no liability as to the accuracy or completeness of the information provided, nor any loss arising from any investment based on a recommendation, forecast or any information supplied by any third-party.

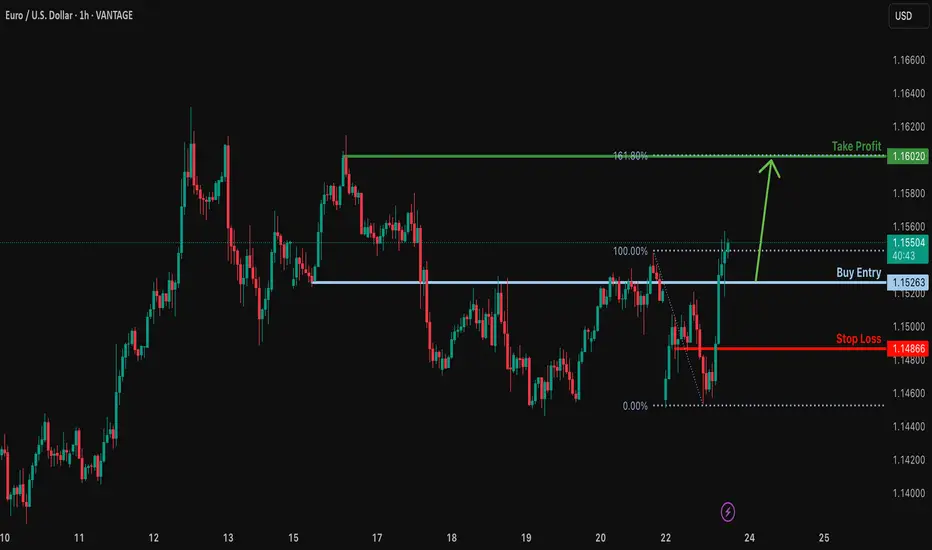
Bullish rise?EUR/USD is falling towards the support level which is an overlap support and could bounce from this level too ur take profit.
Entry: 1.1526
Why we like it:
There is an overlap support level.
Stop loss: 1.1486
Why we like it:
There is a pullback support level.
Take profit: 1.1602
Why we like it:
There is a pullback resistance level that aligns with the 161.8% Fibonacci extension.
Enjoying your TradingView experience? Review us!
Please be advised that the information presented on TradingView is provided to Vantage (‘Vantage Global Limited’, ‘we’) by a third-party provider (‘Everest Fortune Group’). Please be reminded that you are solely responsible for the trading decisions on your account. There is a very high degree of risk involved in trading. Any information and/or content is intended entirely for research, educational and informational purposes only and does not constitute investment or consultation advice or investment strategy. The information is not tailored to the investment needs of any specific person and therefore does not involve a consideration of any of the investment objectives, financial situation or needs of any viewer that may receive it. Kindly also note that past performance is not a reliable indicator of future results. Actual results may differ materially from those anticipated in forward-looking or past performance statements. We assume no liability as to the accuracy or completeness of any of the information and/or content provided herein and the Company cannot be held responsible for any omission, mistake nor for any loss or damage including without limitation to any loss of profit which may arise from reliance on any information supplied by Everest Fortune Group.
23.06.25 Morning ForecastPairs on Watch -
FX:EURAUD
FX:EURNZD
FX:EURUSD
A short overview of the instruments I am looking at for today, multi-timeframe analysis down to what I will be looking at for an entry. Enjoy!

EURUSDased on the information from various financial news and analysis sources, EURUSD appears to be on an upward trend. Here's a summary of the key points:
Overall Sentiment:
Many analyses suggest a bullish outlook for EUR/USD, with the pair holding substantial gains and hinting at higher highs.
EUR/USD 15 MINUTE CHART PATTERN Thanks for sharing your EUR/USD trade setup. Here's a quick breakdown and risk-reward assessment for your 15-minute BUY entry strategy:
---
🟢 Trade Setup (Long)
Pair: EUR/USD
Entry: 1.16025
Stop Loss: 1.15780
Targets:
🎯 Target 1: 1.16361
🎯 Target 2: 1.16700
🎯 Target 3: 1.17090
---
🔍 Risk/Reward Ratios
Let’s calculate approximate Risk-to-Reward (R:R) for each target:
🔻 Risk: 1.16025 - 1.15780 = 24.5 pips
Reward to Target 1:
1.16361 - 1.16025 = 33.6 pips
✅ R:R ≈ 1.37
Reward to Target 2:
1.16700 - 1.16025 = 67.5 pips
✅ R:R ≈ 2.75
Reward to Target 3:
1.17090 - 1.16025 = 106.5 pips
✅ R:R ≈ 4.35
---
⚠ Key Notes:
Your stop loss is tight (24.5 pips), which is good for managing risk, but watch for minor price noise or wicks around support.
Best suited if price has broken out of consolidation or is in a strong uptrend on M15/M30.
Monitor news events (e.g., USD data, ECB statements) that can spike volatility.
Consider scaling out at each target to lock in profits and reduce exposure.

30-06-2025 _ Short Term Bullish Idea _ EURUSD H11- Price is in an uptrend and consolidating at the moment.
2- Potential Bullish Rectangle.
3- Potential Divergence developing on MACD.
4- We can look for a push to the upside towards Daily Resistance Zone.

EURUSDWe are expecting more strength in EURO after small correction towards 1.18 level.
Disclosure: We are part of Trade Nation's Influencer program and receive a monthly fee for using their TradingView charts in our analysis.

EURUSD – 2 Potential Intraday Setups (5-Min Chart)Chart Overview:
This 5-min EURUSD chart shows two example trade setups aligned with the main uptrend. These are shared purely for learning how to recognize and plan structured entries.
(Details are being shown in m5 chart- if this in not working for you please follow to be able to see it- as it is a private idea)
🔹 Example Trade 1 – 3rd Touch of Triangle Support
✅ Context:
Price retested the lower boundary of a broad triangle/wedge for the third time—often a strong area for reactive buys in an uptrend.
✅ Plan Concept:
Entry: Reversal signal on the 3rd touch.
Stop: Below the signal bar low.
Target: Mid to upper wedge area (or TP2).
🔹 Example Trade 2 – Breakout of Descending Flag
✅ Context:
After bouncing off trendline support, price formed a descending flag consolidation.
✅ Plan Concept:
Entry: Break and close above flag resistance.
Stop: Below the strong breakout candle.
Target: Extension toward recent highs (or TP2).
💡 Important:
These examples are not signals and not executed trades—they illustrate a possible planning process for traders studying price action strategies.
💡 Why These Matter:
Both setups align with the primary uptrend, use clear structure for risk placement, and rely on confirmation before entry.
🔹 Note:
These are educational examples only, not trade signals.
💬 Do you study similar setups? Share your charts and thoughts!
Thanks for your attention and your time...
Follow for more setups
#EURUSD #Forex #TradingEducation #PriceAction #IntradayTrading #BreakoutTrading #TechnicalAnalysis #LearnTrading #TradingView


eurusd updateentry price 1.1329
stop loss update 1.133
take profit
1.153
1.165
1.177
1.194
result we hit first two target

EURUSD may uptrend for a few yearThe breakout on monthly timeframe seem almost fully close.
And that continue happen, EURUSD might have a few year of uptrend.

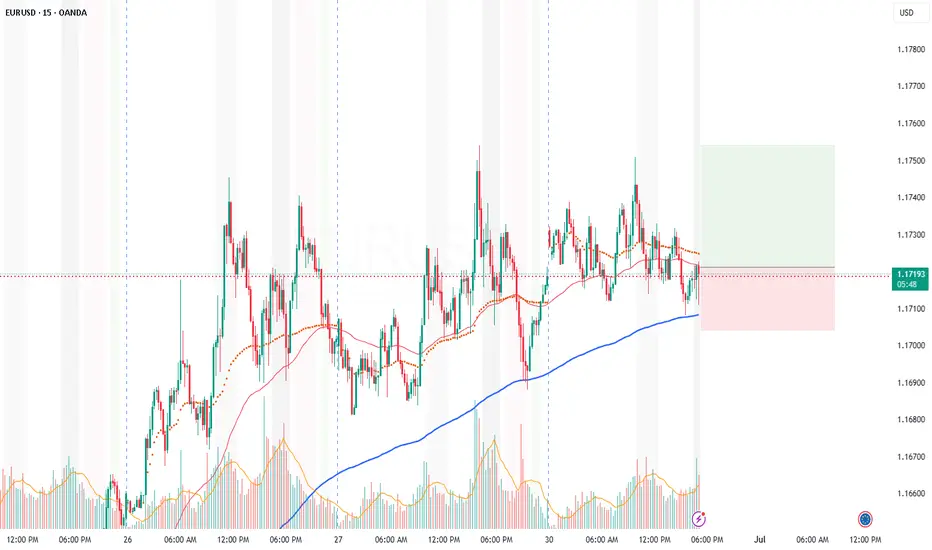
EUR/USD Daily Timeframe Analysis – Bullish OutlookOn the daily chart, the EUR/USD pair shows a clear bullish bias in the long term, backed by strong upward momentum in recent sessions.
🔹 Price Action Overview:
Last week, EUR/USD printed a strong impulsive move to the upside, indicating increased bullish interest and potential trend continuation. This momentum suggests that the bulls are firmly in control, at least for now.
🔹 What to Expect Next:
With the impulsive leg completed, we are now anticipating a short-term retracement. Price is likely to pull back into a key demand zone, previously acting as resistance, and now potentially flipping into support.
I've marked this retracement zone with a green circle on the chart, aligning with the price range:
📍 Key Trade Levels:
Buy Entry Zone: 1.15900 – 1.16100
(Expecting price to react at this former resistance turned support)
Stop Loss: 1.15400
(Below recent swing low to protect against invalidation)
Take Profit: 1.17300
(Targeting the next significant resistance area)
---
🧠 Trade Idea Summary:
This setup follows the classic "impulse–retracement–continuation" structure. As long as price holds above the retracement zone, we maintain a bullish outlook for EUR/USD.
🔔 Watch for bullish price action (e.g., pin bars, engulfing candles) within the buy zone before entering for confirmation.
