USDEUX trade ideas

#EURUSD:Expecting A Strong Bull Move, Two Entries | Two TargetsIn our previous analysis, we clearly stated that the price would remain bullish as the DXY had to plummet, and it did exactly that, rising by 450 pips from our last entry. Currently, we have two areas from which we can see the price reversing. The first one is nearby and has a higher risk compared to our second entry, which may be safer for some traders. We need a strong confirmation before making any significant decisions.
Good luck and trade safely. We wish you the best in your trading journey.
Team Setupsfx_

eurusd updateentry price 1.1329
stop loss update 1.133
take profit
1.153
1.165
1.177
1.194
result we hit first two target

EURUSD may uptrend for a few yearThe breakout on monthly timeframe seem almost fully close.
And that continue happen, EURUSD might have a few year of uptrend.

EUR/USD Daily Timeframe Analysis – Bullish OutlookOn the daily chart, the EUR/USD pair shows a clear bullish bias in the long term, backed by strong upward momentum in recent sessions.
🔹 Price Action Overview:
Last week, EUR/USD printed a strong impulsive move to the upside, indicating increased bullish interest and potential trend continuation. This momentum suggests that the bulls are firmly in control, at least for now.
🔹 What to Expect Next:
With the impulsive leg completed, we are now anticipating a short-term retracement. Price is likely to pull back into a key demand zone, previously acting as resistance, and now potentially flipping into support.
I've marked this retracement zone with a green circle on the chart, aligning with the price range:
📍 Key Trade Levels:
Buy Entry Zone: 1.15900 – 1.16100
(Expecting price to react at this former resistance turned support)
Stop Loss: 1.15400
(Below recent swing low to protect against invalidation)
Take Profit: 1.17300
(Targeting the next significant resistance area)
---
🧠 Trade Idea Summary:
This setup follows the classic "impulse–retracement–continuation" structure. As long as price holds above the retracement zone, we maintain a bullish outlook for EUR/USD.
🔔 Watch for bullish price action (e.g., pin bars, engulfing candles) within the buy zone before entering for confirmation.

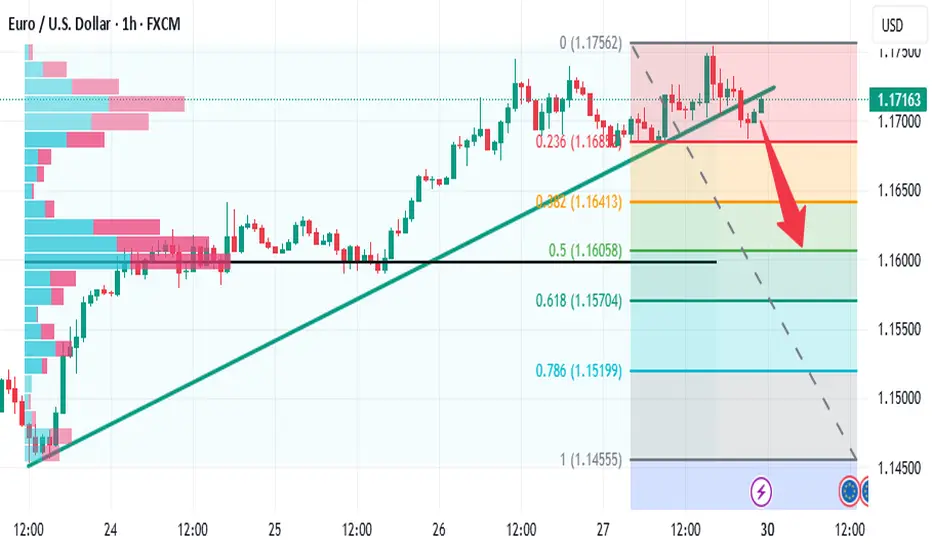
EURUSD next week bearishNext week local bearish correction to area 1.16.
If bears broke that area then next target 1.154 and 1.15
But if bulls push price above 1.175 bullish trend continue to 1.18+
SMC Mechanical Entry Models✅ SMC Checklist:
1. Market Structure
🔹 Identify HTF Trend (H4 or H1): bullish, bearish, or range
🔹 Confirm Break of Structure (BOS) or Change of Character (CHoCH) on M15–M5
🔹 Look for lower highs/lows (downtrend) or higher highs/lows (uptrend)
2. Liquidity Zones
🔹 Look for equal highs/lows (liquidity pools)
🔹 Asian highs/lows — common targets during London/NY session
🔹 Recent internal range liquidity
🔹 Trendline liquidity — fakeouts often occur here
3. Premium & Discount Zones (PD Arrays)
🔹 Use Fibonacci from recent swing high to low
🔹 Look for entries at Discount (Longs) or Premium (Shorts) pricing
🔹 Ideal entries happen between 0.62–0.79 retracement
4. Supply & Demand Zones
🔹 Find fresh OBs (Order Blocks) that caused a break of structure
🔹 Use last bullish candle before strong drop (for short) or last bearish candle before strong rally (for long)
🔹 Confirm zone isn’t mitigated yet
5. Imbalance / Fair Value Gaps (FVG)
🔹 Identify large imbalanced candles (no wick overlap)
🔹 Ideal entries are inside the FVG aligned with direction
🔹 High probability if FVG is within OB or confluence with structure/liquidity
6. Confluences for Entry
🔹 Entry aligns with liquidity sweep or FVG/OB tap
🔹 Volume spike or rejection wick confirms interest
🔹 RSI divergence or exhaustion = bonus confirmation
🔹 Use M1/M5 for entry trigger after setup is formed on M15–H1
7. Entry Trigger
🔹 CHoCH or BOS on lower timeframe (M1-M5)
🔹 Confirmation with engulfing candle, FVG fill, or break/retest
🔹 SL below/above recent swing or OB boundary
8. TP/Exit Zones
🔹 TP1: After BOS/structure shift + partial
🔹 TP2: Next liquidity level (equal high/low or OB)
🔹 TP3: Opposite OB or major FVG
🔹 Adjust SL to breakeven after reaching TP1
9. Session Timing (Important)
🔹 Asian range → look for liquidity setup
🔹 London Open (3PM–6PM PH))→ manipulative move (liquidity grab)
🔹 NY Open (8PM–11PM PH) → continuation or reversal opportunity
🔹 Avoid high-impact news releases unless breakout
🔹 Use Forex Factory / MyFXBook for news calendar
10. Post-Trade Journaling:
🔹Screenshot HTF → LTF Setup (H4 > M15 > M1)
🔹Don’t skip journaling — it’s your #1 improvement tool.


BSL (Buy-side Liquidity):Symbol: EUR/USD
Timeframe: 1 hour
Price Range Displayed: ~1.15300 to ~1.17500
Current Price: 1.16935
🔍
Key Chart Markings
BSL (Buy-side Liquidity):
Marked at the top in the yellow zone (~1.17250–1.17500).
Indicates where buy-side liquidity was likely taken—suggesting liquidity grab or stop hunt.
SSL (Sell-side Liquidity):
Marked at the bottom yellow zone (~1.15700–1.15900).
Indicates a potential drawdown area—price may seek this liquidity next.
Price Action:
The price recently made a higher high into the BSL zone, followed by a bearish rejection.
A projected path is shown: short-term retracement upward, followed by a larger move downward toward the SSL zone.
📉
Potential Outlook (Bearish Bias)
The chart suggests a bearish move is anticipated:
BSL has been swept, signaling a reversal point.
Target: Sell-side liquidity around 1.15800, possibly lower.
⚙️
Technical Implication
This setup follows Smart Money Concepts (SMC) or Liquidity Engineering:
Liquidity is taken from one side of the market (BSL), and price is expected to move to the other (SSL).
Possible setup for a short trade after confirmation of the retracement.

OTEUM EXPERT CALL: EUR/USD – June Finale Setup We’re eyeing the last intramonth swing of June, expected to bleed into early July. Our playbook: let the market cough up one final risk-off spike on the Iran headlines 🌪️📰, then scoop up positions in the value zone (red box) for the next bullish leg 🚀.
Patience first, trigger later 🕰️🎯—wait for price to hit the sweet spot, load up, and ride the firework into summer. Stay nimble; geo-shock headlines can move the board fast ⚠️.

EURUSD Long, 02 JulyAsia Fill Trade
Despite being inside a Daily Bearish OB, this trade is purely an Asia fill setup, so HTF bias is not heavily weighted here.
We had clear 1m BOS and retrace into the 1m OB, right inside a 15m Decisional POI, backed by inverted hammer rejections on both EU and DXY.
📉 Entry: 1m OB after BOS
📊 Confluence: DXY reacting from 15m POI + Asia
🎯 TP: Asia Low (1:3 RR)
🛡️ BE: 1.5RR or LTF BOS continuation
Clean execution based on intraday logic & structure, with correlation as additional confidence.

Bearish ContinuationI am expecting price to continue lower from the area of supply zone formed after the mitigation of extreme supply zone of the MSS bearish range. This is also and indication that we might see a deeper pullback to the daily of 4hr swing demand zone.

EURUSD daily closed with strong bullishDaily candle shows buyer in control.
I'm expecting retracement today towards 1.1707~1.1733 before another bullish movement.
Good Luck.
do your own risk & reward calculation

EURUSD WEEKLY HIGHER TIME FRAME FORECAST Q3 W27 Y25EURUSD WEEKLY HIGHER TIME FRAME FORECAST Q3 W27 Y25
Professional Risk Managers👋
Welcome back to another FRGNT chart update📈
Diving into some Forex setups using predominantly higher time frame order blocks alongside confirmation breaks of structure.
Let’s see what price action is telling us today! 👀
💡Here are some trade confluences📝
✅Weekly Order block identified
✅Daily Order block identified
✅4H Order Block identified
🔑 Remember, to participate in trading comes always with a degree of risk, therefore as professional risk managers it remains vital that we stick to our risk management plan as well as our trading strategies.
📈The rest, we leave to the balance of probabilities.
💡Fail to plan. Plan to fail.
🏆It has always been that simple.
❤️Good luck with your trading journey, I shall see you at the very top.
🎯Trade consistent, FRGNT X

EURUSD Will Keep Growing!
HI,Traders !
#EURUSD is trading in an
Uptrend along the rising
Support and the pair will
Soon retest the support
From where we will be
Expecting a bullish rebound
And a bullish continuation !
Comment and subscribe to help us grow !

Target achievedThe impulsive rise in EURUSD continues.
This morning, it reached 1,1717 — our first projected target.
This is a good level to take profits.
Now, watch for a pullback and the potential for another move up.
Most of the move should already be captured by this point.
Reduce your risk and avoid using large position sizes.
If the price moves higher again, the next target is 1,1778!
EUR/USD 1H – Short Setup from Supply Zone📢 Join Our Free Forex Signal Group on Telegram!
Get daily high-quality signals and analysis for free.
👉 t.me
---
EUR/USD 1H – Short Setup from Supply Zone
EUR/USD is currently retesting a key supply zone between 1.18060 – 1.18350, where price previously faced strong selling pressure. This move appears corrective within a larger bearish structure, presenting a short opportunity upon confirmation.
🔍 Key Highlights:
Supply Zone Rejection: Price is reacting to a previously established resistance zone.
Bearish Market Structure: Lower high formation in progress, suggesting a potential continuation to the downside.
Downside Target: Price is expected to revisit the support area around 1.17519, aligning with recent demand and structure.
📊 Trade Plan:
Sell Entry: 1.18060 – 1.18350
Stop Loss: Above 1.18350
Take Profit: 1.17519
Risk:Reward: ~1:2
🧠 Confirmation Tip:
Look for bearish engulfing or a break of intraday support before execution. If price breaks and holds above 1.18350, the setup is invalidated.

CHECK EURUSD SIGNAL READ CAPTAINeurusd ) sell zone
( trade satup)
entry point (1.17600) to (1.17500) 📊
first tp (1.17200 )📊
2nd target (1.16350) last target (1.16350) 📊
stop loss (1.18000)

Downtrend It is expected that after some fluctuation in the current resistance range, a trend change will take place and we will see the beginning of a downtrend. A break of the green support range will be a confirmation of the downtrend. With a break and consolidation above the resistance range, the alternative scenario will be a continuation of the uptrend.

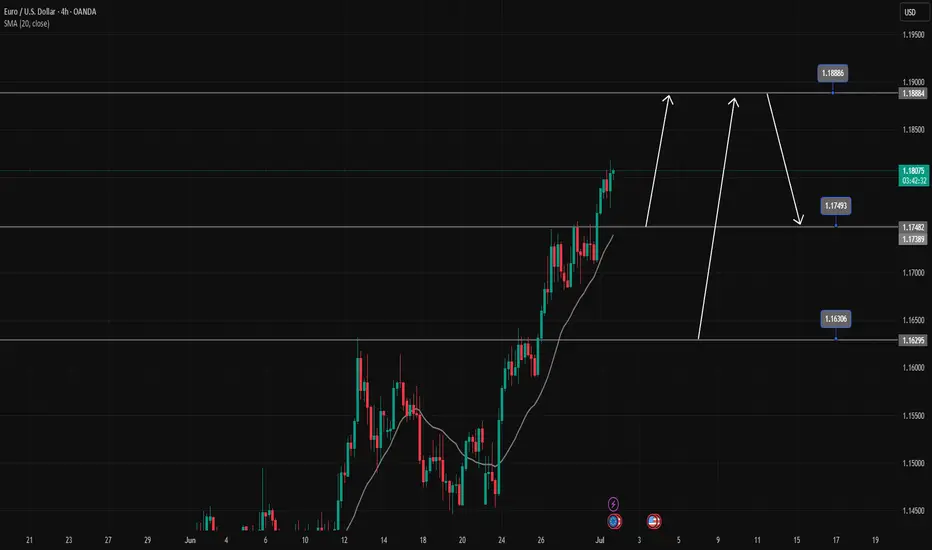
EURUSD is in a strong uptrendEURUSD is in a strong uptrend, Price just broke the resistance zone of 1.175.
All the bullish momentum is heading towards the resistance zone of 1.188.
If there is a close of the h4 candle below the resistance zone of 1.175, there will likely be a Pullback to 1.163 to find more buying momentum towards the target at the resistance zone of 1.188
📈 Key Levels
Support: 1.175-1.163
Resistance: 1.188
📊 Recommended Trade Setups
BUY EURUSD 1.175-1.173 Stoploss 1.170
BUY EURUSD 1.163-1.161 Stoploss 1.158
SELL EURUSD 1.188-1.190 Stoploss 1.1930
01.07.2025 #EURUSDSELL 1.17850 | STOP 1.18350 | TAKE 1.17150 | Drawdown corrective price. Channel movement.

EURUSD: Short Trading Opportunity
EURUSD
- Classic bearish setup
- Our team expects bearish continuation
SUGGESTED TRADE:
Swing Trade
Short EURUSD
Entry Point - 1.1717
Stop Loss - 1.1764
Take Profit - 1.1614
Our Risk - 1%
Start protection of your profits from lower levels
Disclosure: I am part of Trade Nation's Influencer program and receive a monthly fee for using their TradingView charts in my analysis.
❤️ Please, support our work with like & comment! ❤️
