EU trade breakdown 24th June 2x entryBreaking down two of my positions from Tuesday.
First entry was a very aggressive momentum entry on the flip of a M3 imbalance.
Second entry was fantastic and even though it lost - it was a good trade to take. We had HTF alignment as well as a strong London Low to trade away from.
USDEUX trade ideas

EUR/USD 4H – Approaching Major Supply Zone | Potential Mid-Term EUR/USD 4H – Approaching Major Supply Zone | Potential Mid-Term Reversal
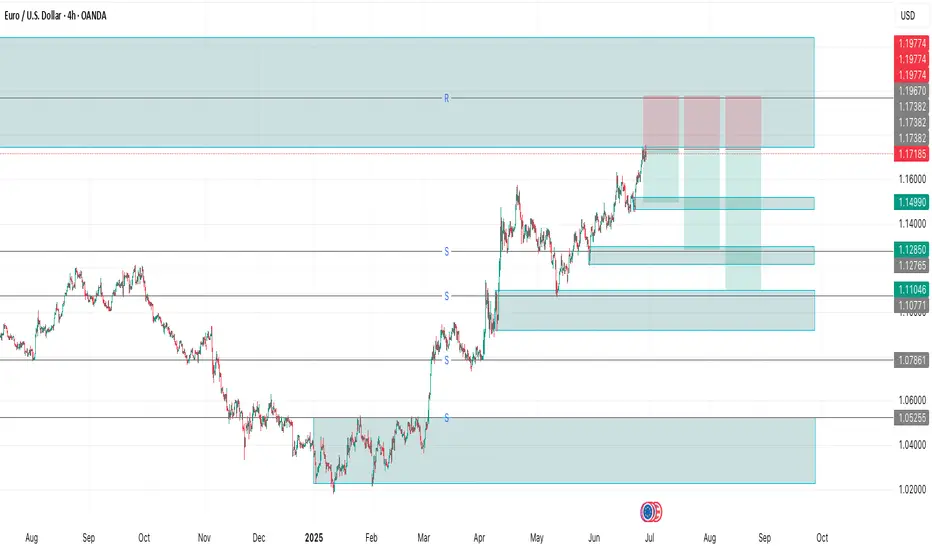
Euro has extended its bullish rally into a historically strong supply/resistance zone around 1.17185 – 1.19774, which aligns with the previous rejection zone from mid-2024. Price is showing signs of slowing down near this upper boundary.
🔍 Key Technical Highlights:
Strong Supply Zone (1.1718 – 1.1977): A major resistance area that previously triggered sharp sell-offs. This zone is now retested after months of bullish recovery.
Momentum Divergence Potential: Price has climbed aggressively, but with signs of exhaustion visible on the lower timeframe candles.
Demand Zones Below:
First support at 1.15998
Followed by deeper demand areas at 1.14990, 1.12850, and 1.11046 – all marking clean reaction zones.
📊 Trade Setup:
Bias: Short (swing position)
Sell Entry Zone: 1.17185 – 1.19774
Stop Loss: Above 1.19800 (above key supply zone)
Take Profit Targets:
TP1: 1.15998
TP2: 1.12850
TP3: 1.11000
🧠 Tactical Note:
Watch for bearish confirmation (engulfing candle / structure break) before executing entries. A clean rejection from the supply zone could provide an attractive swing setup with a favorable risk-reward profile.
EUR/USD | Bullish SMC SETUP EUR/USD | 15min | Bullish SMC Setup 🚀💶
Price swept Asian session lows into a higher timeframe demand zone, followed by a strong bullish BOS (Break of Structure). We’re now anticipating a pullback into the FVG (Fair Value Gap) + LQC (liquidated candle) and demand zone for potential continuation to the upside.
The entry idea is based on:
🔹 Liquidity Grab (sell-side sweep)
🔹 BOS confirmation
🔹 FVG + Demand confluence
🔹 Expecting bullish continuation toward previous high and premium zone.
Waiting for price to tap the zone before riding the wave up! 📈
You can wait for confirmation on 5min TF after tap into POI
Let’s see if it delivers.
#SMC #EURUSD #Liquidity #SmartMoney #FXTradingClub #OrderFlow #Sam_trades_smc

A Classic TGIF trade. Price took sell-side liquidity during the newyork kill zone, traded up creating an order block and price traded back to the bullish order-block. With a position size calculator, that was a great risk to reward trade.

Eurusd technical analysis.Eurusd techinical analysis next move posibale at h1 time frame.not finchinal advice.

DeGRAM | EURUSD reached the supply area📊 Technical Analysis
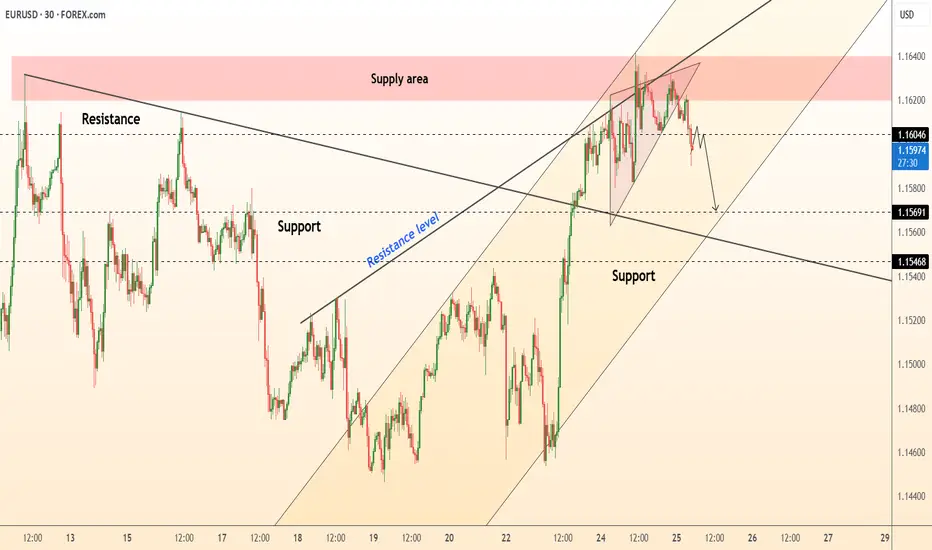
● Price formed an intraday rising wedge right inside the 1.1615-1.1635 supply band; the wedge has broken lower and the last two candles closed back under the long-term trendline retest.
● Bearish follow-through is favoured while price stays below 1.1604; first magnet is the confluence of former breakout base and inner channel support at 1.1569, with 1.1547 (mid-June pivot) the next objective.
💡 Fundamental Analysis
● Fresh Euro-area PMIs dipped below consensus while U.S. consumer-confidence beat, widening the short-rate gap and reviving USD bids.
✨ Summary
Sell rallies ≤1.1600; targets 1.1569 → 1.1547. Bias invalid if 30-min candle closes above 1.1635.
-------------------
Share your opinion in the comments and support the idea with a like. Thanks for your support
Back to low?The EUR/USD has been moving in a tight range around 1.1600 on Tuesday's European session, buoyed by a risk appetite, despite accusations of ceasefire violations in the Middle East. The pair had jumped about 1.30% from the previous day's lows following the announcement of a truce in the Middle East and holds gains with all eyes on the Federal Reserve's (Fed) Chairman Jerome Powell's testimony to Congress.
A confirmation below 1.15798 level would cancel the bullish view and bring the June 19 and June 22 low at 1.1445 back to the focus.

EURUSD Gearing Up for Next Leg Up – DXY Weakens After PPI MissToday, key U.S. economic indexes were released, providing fresh insights into inflationary pressures and the state of the labor market:
Core PPI m/m:
Actual: 0.1% | Forecast: 0.3% | Previous: -0.4%
Lower than expected – suggests weaker underlying producer inflation.
PPI m/m:
Actual: 0.1% | Forecast: 0.2% | Previous: -0.5%
Slight miss – overall inflation at the producer level remains soft.
Unemployment Claims:
Actual: 248K | Forecast: 242K | Previous: 247K
Slightly higher than forecast – signaling some cooling in the labor market.
Market Outlook :
These data releases point toward cooling inflation and softness in job growth, which may strengthen the dovish narrative around the Fed’s next move.
DXY Index ( TVC:DXY ) is under pressure, and EURUSD ( FX:EURUSD ) is showing signs of bullish momentum .
-----------------------------------------------------------
Now let's take a look at the EURUSD chart on the 1-hour time frame .
EURUSD is trading near the Heavy Resistance zone($1.182-$1.160) and Monthly Resistance(2) .
In terms of Elliott Wave theory , EURUSD appears to be completing microwave 4 . Microwave 4 could be completed at one of the Fibonacci levels .
I expect EURUSD to attack the Heavy Resistance zone($1.182-$1.160) at least once more after completing microwave 4 and could even rise to the Potential Reversal Zone(PRZ) .
Note: If EURUSD touches $1.1446 , we can expect more dump.
Please respect each other's ideas and express them politely if you agree or disagree.
Euro/U.S. Dollar Analyze (EURUSD), 1-hour time frame.
Be sure to follow the updated ideas.
Do not forget to put a Stop loss for your positions (For every position you want to open).
Please follow your strategy and updates; this is just my Idea, and I will gladly see your ideas in this post.
Please do not forget the ✅' like '✅ button 🙏😊 & Share it with your friends; thanks, and Trade safe.

HelenP. I Euro will break resistance level and continue to fallHi folks today I'm prepared for you Euro analytics. On this chart, we can see how price initially moved inside a triangle formation, forming higher lows from the trend line and testing the resistance zone multiple times. Eventually, price broke out to the downside, falling sharply and breaking through the lower boundary of the triangle and also the trend line, signaling a shift in market sentiment. After touching the support zone and forming a temporary bottom, the pair started climbing back up, but this movement was more of a correction than a trend reversal. Price respected the trend line from below and followed it upward, but failed to break significantly higher. It managed to push above both support 2 and support 1 levels, which now act as resistance. Currently, EURUSD is trading inside the resistance zone, where previous reactions have led to strong bearish impulses. Given this behavior and the recent false breakout, I expect the price to rebound from this area and break back below support. My goal is set at 1.1350, anticipating further downside movement as the bearish structure remains valid. If you like my analytics you may support me with your like/comment ❤️
Disclaimer: As part of ThinkMarkets’ Influencer Program, I am sponsored to share and publish their charts in my analysis.

EUR_USD RISING SUPPORT AHEAD|LONG|
✅EUR_USD is trading along the rising support
And as the pair will soon retest it
I am expecting the price to go up
To retest the supply levels above at 1.1511
LONG🚀
✅Like and subscribe to never miss a new idea!✅
Disclosure: I am part of Trade Nation's Influencer program and receive a monthly fee for using their TradingView charts in my analysis.

AI Algo Systems vs. Manual Trading: Which Delivers Real Results?AI Algo Systems vs. Manual Trading: Which Delivers Real Results? ⚖️
________________________________________
Introduction
With the explosive rise of artificial intelligence (AI) in financial markets, traders everywhere are asking the million-dollar question:
Should I trust my trades to automation, or keep my hands on the wheel? 🧠🤖
This guide offers a real-world, side-by-side comparison between AI-powered algorithmic trading systems and traditional manual trading. We’ll highlight where each method dominates, when they fail, and how you can combine both to build a system that outperforms the rest. 💡
What Are AI Algo Systems? 🤖
AI trading systems use advanced machine learning models to:
• Analyze huge volumes of historical and real-time data 📈
• Detect patterns and trading opportunities faster than any human
• Automatically execute trades using coded logic, without emotion
🔬 Real-World Examples:
• Neural networks (LSTM, CNN): Predicting EUR/USD direction based on years of tick data
• Reinforcement learning agents: Managing position sizing dynamically in crypto scalping
• Predictive classifiers: Spotting likely trend reversals on S&P 500 based on 20+ indicators
Key Benefits:
• 🔄 Emotionless execution: No fear, no greed, just rules
• ⏱️ Lightning-fast trades: React to price action instantly
• 📊 Pattern recognition: Finds subtle correlations people miss
________________________________________
What Is Manual Trading? 👤
Manual trading is powered by human intelligence and judgment. Traders use:
• Price action and SMC/ICT techniques (e.g., order blocks, BOS)
• Fundamental analysis: News, sentiment, macro reports
• Intuition and experience: Reading between the lines the way only humans can
🧑💼 Real-World Examples:
• A trader spots an untested order block on GBP/JPY and waits for liquidity sweep before entering
• Reading a dovish tone in FOMC minutes and fading the initial spike on DXY
• Using “market structure shifts” after a big news event to catch a reversal
Key Benefits:
• 🔍 Contextual awareness: Understand the full market story
• 🎯 Real-time adaptability: Adjust plans on the fly
• 🧠 Creative edge: Find setups no algorithm can code for
________________________________________
Side-by-Side Comparison Table 📋
Feature AI Algo Trading 🤖 Manual Trading 👤
Execution Speed Instant Slower, can lag
Emotions Involved None Prone to fear/greed
Adaptability Limited (needs retrain) High
Learning Curve High (coding/tech) Medium (market logic)
Strategy Flexibility Pre-coded only Unlimited creativity
Backtesting Automated Manual/semi-auto
Session Monitoring 24/5 via server Human-limited hours
________________________________________
When AI Algo Systems Work Best 💾
AI is unbeatable when you need:
• Scalability: Watching 10, 20, or even 100+ pairs 24/5
• High-frequency execution: Entering/exiting trades within milliseconds
• Repetitive strategies: Like mean reversion, breakout scalps, or arbitrage
📈 Example:
• Strategy: EUR/USD London open breakout
• Process: AI model detects volume and volatility spike, enters trade with 0.3% risk, targets FVG
• Results: 60% win rate, 1.8R average reward over 3 months
________________________________________
When Manual Trading Wins 🧠
Manual skills shine when you need:
• Discretionary entries: Especially with complex SMC/ICT structures
• Adapting to breaking news: Sudden CPI, FOMC shocks, geopolitical headlines
• Making sense of market narrative: When volatility is off the charts and AI gets confused
🗞️ Example:
• News: Surprise ECB rate hike
• Setup: Price sweeps liquidity and forms new order block
• Action: Trader enters based on confluence of structure, sentiment, and news
• Why AI fails: Model trained on normal volatility might get stopped out or miss entry entirely
________________________________________
Hybrid Strategy: The Best of Both Worlds 🌐
Elite traders combine the power of AI with human oversight.
Hybrid Workflow:
1. AI scans markets: Flags setups (order blocks, FVGs, volume spikes)
2. You review: Confirm bias with news, sentiment, or higher time frame
3. Entry:
o Manual (you pull the trigger)
o Semi-automated (AI suggests, you approve)
🔁 You save time, avoid missing setups, but keep critical discretion and control.
________________________________________
Risk Management: Algo vs. Manual 📊
AI:
• Stops, lot size, SL/TP are auto-calculated
• Consistent, never emotional
• Example: EA manages all USD pairs with 0.5% fixed risk per trade
Manual:
• Trader might override risk plan
• Discipline needed—easy to “revenge trade” after a loss
• Example: You up your risk size after a losing streak, breaking your rules
Best Practice:
📌 Let AI calculate risk size. Manually approve or override the entry. Double safety net.
________________________________________
Trader Case Study 👤
Name: Ray – $100K funded prop trader
Style: Hybrid (AI scanner + manual ICT confirmations)
Process:
• Sets HTF bias each morning
• AI scans for OB/BOS setups during NY session
• Manual review before entry
Performance:
• Win rate: 63%
• Avg R: 2.5
• Monthly gain: 9.7%
Ray’s Words:
“AI catches what I can’t see. I catch what it can’t understand.”
________________________________________
Mistakes to Avoid ❌
• 🚫 Blindly trusting black-box AI: Always verify signals
• 🚫 Micromanaging every tick: Let automation work, don’t over-interfere
• 🚫 Running AI during high-impact news: Most bots aren’t built for chaos
• 🚫 Ignoring psychology: Even if AI executes, your mindset impacts risk and management
________________________________________
Conclusion ✅
There’s no one-size-fits-all answer. The best traders in 2025 master both worlds. Here’s the winning formula:
• Harness AI’s speed and pattern recognition
• Lean on manual judgment for narrative and nuance
• Blend them with intention and structure for a trading system that’s fast, flexible, and resilient.
💥 Don’t pick sides. Master both.
That’s how the top 1% trade today—and win. 🚀⚙️📊

Bearish reversal?EUR/USD is rising towards the resistance level which is a pullback resistance that lines up with the 61.8% Fibonacci retracement and could reverse from this level to our take profit.
Entry: 1.1555
Why we like it:
There is a pullback resistance that lines up with the 61.8% Fibonacci retracement.
Stop loss: 1.1608
Why we like it:
There is a pullback resistance.
Take profit: 1.1483
Why we like it:
There is a pullback support level that aligns with the 61.8% Fibonacci retracement.
Enjoying your TradingView experience? Review us!
Please be advised that the information presented on TradingView is provided to Vantage (‘Vantage Global Limited’, ‘we’) by a third-party provider (‘Everest Fortune Group’). Please be reminded that you are solely responsible for the trading decisions on your account. There is a very high degree of risk involved in trading. Any information and/or content is intended entirely for research, educational and informational purposes only and does not constitute investment or consultation advice or investment strategy. The information is not tailored to the investment needs of any specific person and therefore does not involve a consideration of any of the investment objectives, financial situation or needs of any viewer that may receive it. Kindly also note that past performance is not a reliable indicator of future results. Actual results may differ materially from those anticipated in forward-looking or past performance statements. We assume no liability as to the accuracy or completeness of any of the information and/or content provided herein and the Company cannot be held responsible for any omission, mistake nor for any loss or damage including without limitation to any loss of profit which may arise from reliance on any information supplied by Everest Fortune Group.

EURUSDEURUSD have one more down and then go back up if geopolitical situation calms down.
Disclosure: We are part of Trade Nation's Influencer program and receive a monthly fee for using their TradingView charts in our analysis.

EURUSD| Weekly OutlookSame story as last week — still patiently waiting for the major engineered liquidity above to get cleared before considering any meaningful longs.
That said, EU is currently offering a clean structure for short setups into the downside order block. Everything is lining up technically, but it’s important to note this is a counter-trend move — and personally, I’m not taking it.
It’s tempting when structure looks this clean, but I know it’s not my proper approach. For me, the real play is still higher — waiting on that bull-side OB mitigation to align with the bigger picture narrative. Until then, I’ll let others chase while I sit on my hands. Pure discipline only.
Bless Trading!

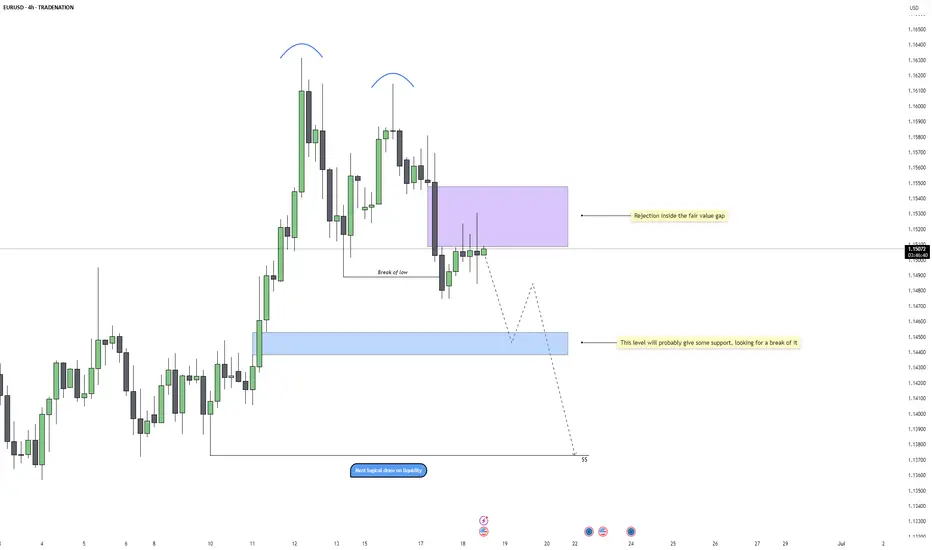
EURUSD - FVG Rejection and Bearish Continuation PlayEURUSD has been showing consistent bearish pressure on the 4H chart, with a clear shift in momentum after forming a double top near 1.162. That marked the beginning of a structural change, which was confirmed once price broke the most recent higher low. Since then, the market has transitioned into a bearish structure, with lower highs forming consecutively. This suggests that the bullish trend is over for now, and the market is more likely to seek liquidity below.
Rejection at Fair Value Gap
After the low was broken, price retraced back into a 4H fair value gap, which has now acted as resistance. This is typical smart money behavior, sweep liquidity, shift structure, then retest an imbalance before continuing lower. The wick rejection inside the purple FVG zone is a strong signal that this area is being respected and that sellers are defending it. The rejection aligns with the overall bearish market flow and suggests that the market has likely completed its retest.
Short-Term Support and Liquidity Target
The light blue FVG around 1.144 could offer temporary support, but the bias remains bearish. That level sits right at the midpoint of the recent bullish leg that was already violated, and while price may pause here, the more logical draw on liquidity sits deeper. Unless there’s a sudden shift in market structure or high-impact fundamental news, this area is expected to eventually give way.
Liquidity Below and Final Target
The cleanest and most obvious liquidity pool rests around the 1.137 zone. This is where price previously consolidated before initiating the impulsive move higher, and it remains unmitigated. If the current bearish structure holds, the market will likely target this area next. The path there might not be linear, we could see a short-term bounce off 1.144, but as long as price remains below the 1.153 FVG rejection, the bearish continuation remains valid.
Trade Expectation and Risk Context
This setup aligns well with typical displacement-retest-continuation behavior. The risk is clearly defined above the FVG rejection, and as long as lower highs continue forming beneath that zone, the bearish thesis remains intact. Key downside targets are 1.144 for partials, and 1.137 as the final draw on liquidity. This setup offers both precision and strong narrative confluence, ideal for swing or intraday positioning.
Conclusion
Price has shifted bearish on the 4H, confirmed by a break of structure and rejection from a clear FVG. As long as we remain below that imbalance, the market should continue hunting liquidity to the downside. 1.144 may act as short-term support, but the real magnet sits at 1.137. Patience and risk control will be key in riding this move effectively.
Disclosure: I am part of Trade Nation's Influencer program and receive a monthly fee for using their TradingView charts in my analysis.
___________________________________
Thanks for your support!
If you found this idea helpful or learned something new, drop a like 👍 and leave a comment, I’d love to hear your thoughts! 🚀
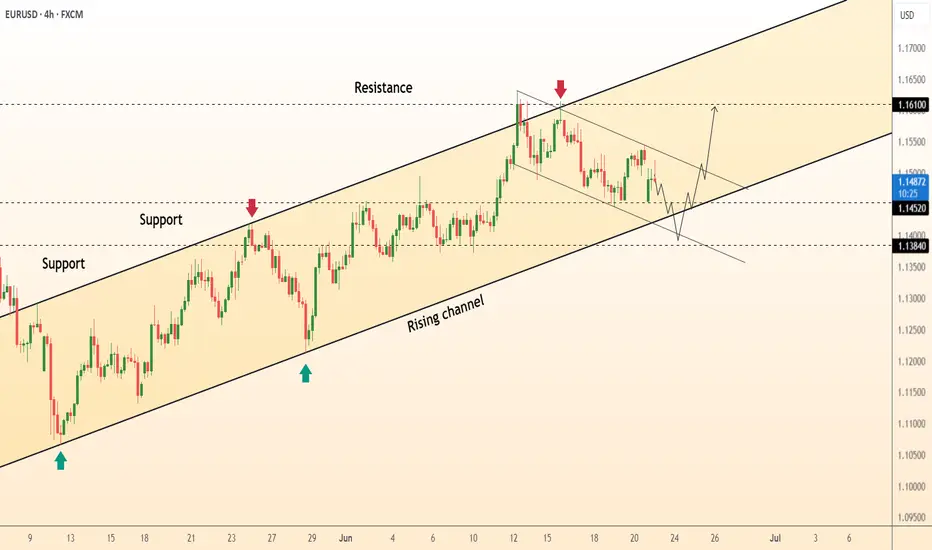
EUR/USD tests 20 EMA, Lower band of channelEUR/USD ran into resistance at 1.1630 before easing back below 1.15. However, EUR/USD continues to trade in its rising channel, holding above its 20 and 50 SMA for now. The RSI is pointing lower, suggesting momentum is losing steam.
Immediate support is at 1.1450, the 20 SMA, and the lower band of the rising channel is being tested following weak EZ PMIs and as the USD is the safe-haven of choice amid Middle East tensions. A break below here could open the door to 1.14 and 1.1280.
Buyers will look to rise back above 1.15 and 1.1580 to bring 1.1630 and fresh multi-year highs into focus.
FC

OTEUM EXPERT CALL: EUR/USD – June Finale Setup We’re eyeing the last intramonth swing of June, expected to bleed into early July. Our playbook: let the market cough up one final risk-off spike on the Iran headlines 🌪️📰, then scoop up positions in the value zone (red box) for the next bullish leg 🚀.
Patience first, trigger later 🕰️🎯—wait for price to hit the sweet spot, load up, and ride the firework into summer. Stay nimble; geo-shock headlines can flip the board fast ⚠️.
#EURUSD #Intramonth #RiskOff #ValueHunt #OTEUM

20.06.25 Morning ForecastPairs on Watch -
FX:EURJPY
FX:EURNZD
FX:EURUSD
A short overview of the instruments I am looking at for today, multi-timeframe analysis down to what I will be looking at for an entry. Enjoy!

DeGRAM | EURUSD growth in the channel📊 Technical Analysis
● The chart for EURUSD, as indicated in the upper right corner, displays a classic descending wedge pattern, which is typically a bullish reversal signal. Price action has respected the wedge’s lower boundary multiple times, forming a series of higher lows while sellers failed to push the pair below the 1.0670 support zone. The most recent candles show a decisive breakout above the wedge’s upper trendline, accompanied by increased volume, suggesting that buyers are regaining control. This breakout is further validated by the RSI indicator, which has moved out of oversold territory and is now trending upward, confirming the shift in momentum.
● The technical setup is reinforced by the presence of a horizontal resistance level at 1.0750, which has acted as a magnet for price in previous attempts. The chart also highlights a bullish engulfing pattern on the daily timeframe, signaling strong demand and a potential continuation toward the next resistance at 1.0820. The moving averages are beginning to converge, with the shorter-term MA crossing above the longer-term MA, a classic bullish crossover that often precedes sustained upward movement. These factors collectively point to a high-probability scenario for further gains in the EURUSD pair.
💡 Fundamental Analysis
● Recent fundamental developments support the bullish technical outlook. Over the past two days, the Federal Reserve has maintained its policy rate, but forward guidance has hinted at a possible rate cut later this year, which has weighed on the US dollar. Meanwhile, the European Central Bank has adopted a more cautious stance, with the probability of a near-term rate cut decreasing as inflation data remains sticky in the eurozone. Additionally, easing geopolitical tensions in the Middle East and stable US retail sales have reduced safe-haven demand for the dollar, further supporting the euro’s advance.
✨ Summary
● A confirmed breakout above the descending wedge and bullish momentum indicators suggest a long entry on EURUSD above 1.0750, targeting 1.0820. The bullish scenario remains valid as long as price holds above the 1.0670 support. A close below this level would invalidate the setup and call for a reassessment of the trend.
-------------------
Share your opinion in the comments and support the idea with a like. Thanks for your support
Bullish bounce off pullback support?The Fiber (EUR/USD) has bounced off the pivot and could rise to the 1st resistance.
Pivot: 1.1444
1st Support: 1.1369
1st Resistance: 1.1587
Risk Warning:
Trading Forex and CFDs carries a high level of risk to your capital and you should only trade with money you can afford to lose. Trading Forex and CFDs may not be suitable for all investors, so please ensure that you fully understand the risks involved and seek independent advice if necessary.
Disclaimer:
The above opinions given constitute general market commentary, and do not constitute the opinion or advice of IC Markets or any form of personal or investment advice.
Any opinions, news, research, analyses, prices, other information, or links to third-party sites contained on this website are provided on an "as-is" basis, are intended only to be informative, is not an advice nor a recommendation, nor research, or a record of our trading prices, or an offer of, or solicitation for a transaction in any financial instrument and thus should not be treated as such. The information provided does not involve any specific investment objectives, financial situation and needs of any specific person who may receive it. Please be aware, that past performance is not a reliable indicator of future performance and/or results. Past Performance or Forward-looking scenarios based upon the reasonable beliefs of the third-party provider are not a guarantee of future performance. Actual results may differ materially from those anticipated in forward-looking or past performance statements. IC Markets makes no representation or warranty and assumes no liability as to the accuracy or completeness of the information provided, nor any loss arising from any investment based on a recommendation, forecast or any information supplied by any third-party.

EURUSD Sell SetupBy: MJTrading:
EUR/USD has rallied into a significant resistance zone, approaching the upper boundary of a rising wedge/channel pattern. The price is now hovering around a key confluence zone, where trendline resistance and horizontal supply intersect ( 1.16300 —1.16500 )
There are to possible scenarios:
1) If the price Rejects directly from previous High
🔹 Position 1: Sell Stop @ 1.15915
🛑 Stop Loss: 1.6375
🎯 Take Profit: 1.5454
R/R:1
isk Level: Medium
2) If price tries to reach the boundary of the wedge or make a Fake breakout:
🔹🔹 Position 2: Sell Limit @ 1.16300
🛑 Stop Loss: 1.6930
🎯 Take Profit: 1.5000
R/R:2
Risk Level: Low
📌 This zone offers a high-probability reversal setup
📉 Why it Matters:
Price action shows signs of exhaustion after a parabolic move.
EMA structure is stretched, hinting at a potential pullback.
Lets ZOOM OUT:
Daily Chart:
ZOOM IN:
Stay disciplined, let price come to you, and manage risk.
—
#EURUSD #ForexSetup #TradingStrategy #TechnicalAnalysis #ChartPattern #FXTrading #ShortTrade #MJTrading #BearishReversal #PriceAction #SwingTrade #ForexIdeas #Trendlines #BreakoutOrFakeout #RiskReward

LT trade: Short EU til the rest of the yearFire may burns to the europe continent. price is reaching a hypothetical resistance, it may shoot up these days and heads down

Forex and Gold Market Highlights June 21 2025Forex & Gold Market Highlights – June 21, 2025
🕒 Key Events This Week:
• 🏦 Fed officials signaling possible rate cuts vs. cautious economic tone
• 🌍 Escalating Israel–Iran tensions boosting safe-haven flows
• 🏭 Mixed U.S. macro data (retail sales, Philly Fed, housing) shaping Fed expectations
________________________________________
💶 EUR/USD Nears 1.1520 on Safe-Haven Flows
EUR/USD edged up to about 1.1520 amid weakness in the U.S. dollar, driven by global risk-off sentiment. Mixed signals from the Fed kept traders cautious.
________________________________________
💷 GBP/USD Hovering Around 1.3500 on USD Strength
GBP/USD remains near 1.3500, slipping slightly off highs after weaker UK retail data. The pair faces resistance in the 1.3550–1.3600 zone.
________________________________________
💴 USD/JPY Eyeballing 146 Resistance
USD/JPY climbed toward 146.00, driven by risk-averse USD demand and dovish BOJ stance. The pair is testing key retracement resistance near 146.76.
________________________________________
🥇 Gold Pulls Back but Holds Ground
Spot gold slid to around $3,334 3,381 this week, under pressure from a stronger dollar and diminished Fed rate-cut hopes. Still, geopolitical jitters kept it from falling hard.
• Weekly drop of ~2.5%, trading in a $3,330–$3,400 range.
________________________________________
📈 DXY Index Rallies on Risk Aversion
The U.S. Dollar Index rose ~0.45%, marking its strongest weekly gain in over a month due to heightened safe-haven flows amid Middle East tensions.
________________________________________
📌 Market Outlook:
• EUR/USD: Mixed bias. May test 1.1550–1.1600 if risk-off continues; downside risk near 1.1400 if U.S. data surprises.
• GBP/USD: Expected to stay in the 1.3450–1.3550 range; UK economic data and USD momentum will be key.
• USD/JPY: Bullish tilt remains toward 146.76, but any BOJ hints of policy tightening could shake it.
• Gold: Pressure from a firm dollar is likely to persist. Watch for geopolitical developments and upcoming Fed signals for reversal clues.
