EUR/USD analysis and pending orderTwo days ago, there was a FED meeting, where it was stated that the benchmark interest rate will be kept at 4.25-4.50% level.
What is important is what they told - the expectations - economicp rojections are lower, and inflation is higher.
Maybe they’ll decrease rates in future?
Right now, it’s not so important. It’s summer already, and by the old “Sell in May, and go aways” mentality, I don’t expect some huge impact on the market.
I know… Iran, Israel, Trump, maybe even Putin? Anybody can do some stupit stuff and everything can go to Hell.
And it’s Friday, not very smart time to open trades, so I’m putting pending order.
I decided for EUR/USD.
Timeframe is 4h.
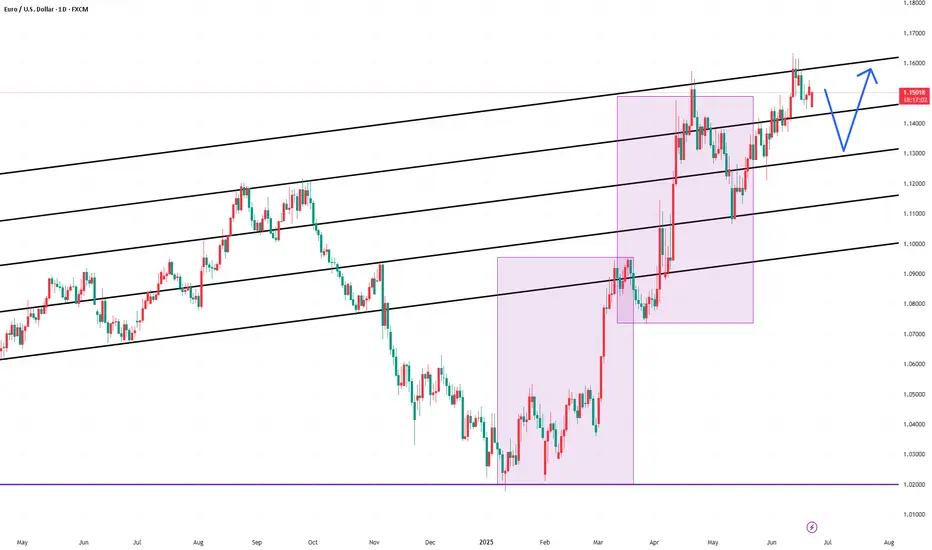
On my chart I can see clear uptrend in the last couple of weeks, especially in the last 3 months.
Also, I see lower highs.
Upward trend is breached… Where it could stop?
Overall, I don’t expect the pair will come near parity, even though ECB lowered rates before FED did.
But some “selloff”, probably.
I used good old Fibonacci, draw it, and the price could potentialy drop to 50% level or even ideal 61…8%-78.6% zone.
Pending entry: 1.15577
TP: 1.12645
SL: 1.1671
If it activates today, I’ll leave it over the weekend.
USDEUX trade ideas

EURUSD LONG FORECAST Q2 W26 D23 Y25EURUSD LONG FORECAST Q2 W26 D23 Y25
Professional Risk Managers👋
Welcome back to another FRGNT chart update📈
Diving into some Forex setups using predominantly higher time frame order blocks alongside confirmation breaks of structure.
Let’s see what price action is telling us today!
💡Here are some trade confluences📝
✅Daily order block
✅15' order block
✅Intraday breaks of structure
✅4H Order block
🔑 Remember, to participate in trading comes always with a degree of risk, therefore as professional risk managers it remains vital that we stick to our risk management plan as well as our trading strategies.
📈The rest, we leave to the balance of probabilities.
💡Fail to plan. Plan to fail.
🏆It has always been that simple.
❤️Good luck with your trading journey, I shall see you at the very top.
🎯Trade consistent, FRGNT X

EURUSD TRADING IN BULLISH TREND EURUSD TRADING IN BULLISH TREND.
Price is currently forming higher high and higher low formation.
Market was trading in secondary trend from lest few sessions.
Recently market shows interest of buyers by bullish engulfing candle.
Market may end this secondary trend and can start moving in primary trend.
Market is expected to remain bullish in upcoming trading sessions.
On lower side, 1.12200 is key support level.
On higher side market may hit the target levels of 1.15600.

EUR/USD Bullish Setup: Long from Fib & Trendline SupportEUR/USD is in a bullish continuation. We’re now looking for a long entry between the 0.618 Fibonacci level and trendline support, with the stop-loss placed below recent lows. Targeting current highs and potential new highs.

FVG (Fair Value Gap) or Imbalance Zones (grey boxes):Key Zones & Markings:
SSL (Sell Side Liquidity) - "True return to support" (bottom horizontal line around 1.13700):
Indicates that price has swept the sell-side liquidity, grabbing stop-losses below previous lows.
This often precedes a reversal if it aligns with a key support zone.
FVG (Fair Value Gap) or Imbalance Zones (grey boxes):
Price is expected to retrace back into these imbalanced zones.
These zones act as magnet areas where price might rebalance before further continuation.
Target Zone (Top Horizontal Line at ~1.16200):
Marked as the bullish target, likely aligning with buy-side liquidity (BSL) or unfilled imbalances.
Potential take profit area for long entries from the support zone.
📈 Market Structure:
Price made a lower low, swept liquidity (SSL), and is now showing potential bullish intent.
Anticipated move:
Reversal from support
A clean bullish move toward FVGs
Final target near 1.16200
🎯 Strategy Idea:
Long Entry Zone: Near 1.137–1.140 (liquidity sweep + support).
Target: 1.15500 (intermediate) and 1.16200 (final).
SL (Stop Loss): Could be below the most recent low (if re-entry needed).
🧠 Concept Used:
Liquidity sweep (SSL)
Return to support
Fair Value Gap (FVG) fill
Smart Money long setup

Euro Prices Falling TodayThe EURUSD has broken to a new high for the month and the year.
The price extended above highs from June between 1.1614 to 1.16297. The high price extended to 1.1641 so far. That represents the highest levels going back to October 2021. With the break, the next key target area comes between 1.1663 and 1.16916. That area corresponds with swing lows and swing highs going back to April 2021 through November 2021 before the pair started a trend-like move to the lows reached in September 2022.

EURUSD Sell/ShortFundamental Analysis
EURUSD rates is being influenced by the current Eurozone's economic performance, driven by key economies like Germany and France, continues to be shaped by industrial output, consumer confidence, and inflation trends. The European Central Bank (ECB) has likely maintained a cautious monetary policy, with interest rates possibly held steady or adjusted slightly to combat inflation while supporting growth. On the U.S. side, the Federal Reserve's stance on interest rates, potentially in a tightening phase to address persistent inflation plays a critical role. Recent U.S. economic data, including GDP growth, employment figures, and consumer spending, may indicate a robust dollar, putting downward pressure on EURUSD. Additionally, geopolitical tensions, energy prices (affecting Eurozone energy imports), and trade balances between the U.S. and EU are likely contributing to volatility. Given the current date, recent ECB and Fed statements or data releases for June 2025 inflation reports.
Technical Analysis:
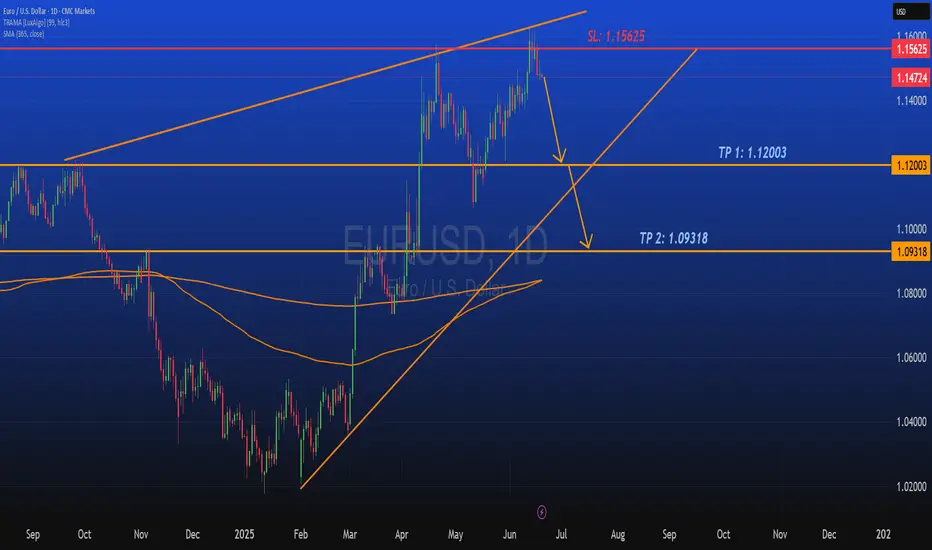
Based on the provided EURUSD 1D chart (covering mid-2024 to mid-2025), the following technical observations can be made:
Trend and Moving Averages:
For EURUSD it shows a descending trend from a peak around 1.48 in mid-2024, with a potential reversal or consolidation forming in mid-2025. The 50-day and 200-day moving averages (depicted as orange lines) are sloping downward, with the price recently testing these levels around 1.12-1.13. A break above the shorter-term moving average could signal bullish momentum, while a failure to hold might confirm a continuation of the downtrend. Looking for key support levels here are identified at 1.09318 (TP 2) and 1.08000, with the current price hovering near 1.12003 (TP 1). Resistance is notable at 1.15625 (SL) and the previous high near 1.4800. The price action suggests a potential bounce from the recent low, with the next target being the resistance zone around 1.15625 if bullish momentum persists. Candlesticks and volume patterns are showing a recent green candlesticks indicate buying pressure, potentially forming a reversal pattern near the 1.12 level. Volume analysis would confirm the strength of this move, with higher volume on upticks supporting a breakout.
Overall Bias:
The technical setup suggests a short-term bullish correction within a broader bearish trend, contingent on breaking and holding above 1.15625. A drop below 1.09318 would invalidate the bullish case and resume the downtrend toward 1.08000 or lower.
Sentiment Analysis
Market sentiment as of June 2025 likely reflects heightened interest in EUR/USD due to recent economic data and central bank policies. Traders and analysts are closely watching for signs of ECB rate cuts or Fed rate hikes, which could sway the pair. On social platforms and financial forums, there may be a mix of caution and optimism looking out for caution due to the Eurozone's economic challenges (energy costs, political uncertainty), and optimism if U.S. data softens, weakening the dollar. The chart's visibility on trading platforms suggests retail and institutional traders are actively monitoring this pair, with a focus on the 1.12-1.16 range as a critical decision point. Sentiment could shift rapidly based on upcoming economic releases or geopolitical developments.
Conclusion
The EUR/USD pair is at a pivotal juncture, with fundamentals pointing to a stronger USD due to Fed policy, while from a technical standpoint suggest a short-term bounce toward 1.15625 if support at 1.12003 holds. Sentiment indicates active trader interest, with eyes on central bank moves. A break above resistance could target 1.4800 (long-term), while a failure might see a decline to 1.08000. Monitor upcoming data for confirmation.
EURUSD SELL expectancy EURUSD approaching a resistance zone and order block which I expect it to sell from that zone to the downside

DeGRAM | EURUSD reached the resistance level📊 Technical Analysis
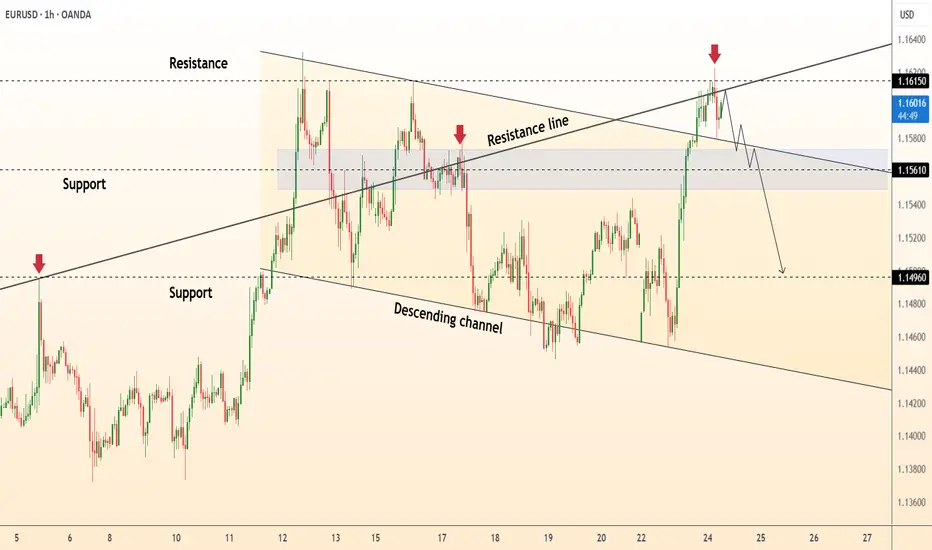
● Price has spiked into the confluence of the long-term channel roof (≈1.1615) and a steeper resistance line, printing a rejection candle and bearish divergence on the 1 h RSI.
● The move leaves a lower high versus 13 Jun and snaps the micro up-sloper; a slide back inside the grey 1.1560-1.1520 supply should accelerate toward the mid-June swing floor at 1.1490.
💡 Fundamental Analysis
● Hotter US S&P-global PMIs rekindled Fed “higher-for-longer” chatter, lifting two-year yields and the DXY, while French election uncertainty widens Bund-Treasury spreads—both pressuring EUR.
✨ Summary
Fade rallies 1.1580-1.1610; sustained trade beneath 1.1560 targets 1.1520 ➜ 1.1490. Bearish view void on an hourly close above 1.1630.
-------------------
Share your opinion in the comments and support the idea with a like. Thanks for your support
EURUSD SHORT FORECAST Q2 W26 D24 Y25EURUSD SHORT FORECAST Q2 W26 D24 Y25
Professional Risk Managers👋
Welcome back to another FRGNT chart update📈
Diving into some Forex setups using predominantly higher time frame order blocks alongside confirmation breaks of structure.
Let’s see what price action is telling us today!
💡Here are some trade confluences📝
✅Daily order block
✅15' order block
✅Intraday breaks of structure
✅4H Order block
🔑 Remember, to participate in trading comes always with a degree of risk, therefore as professional risk managers it remains vital that we stick to our risk management plan as well as our trading strategies.
📈The rest, we leave to the balance of probabilities.
💡Fail to plan. Plan to fail.
🏆It has always been that simple.
❤️Good luck with your trading journey, I shall see you at the very top.
🎯Trade consistent, FRGNT X

EURUSD facing resistance at Triple TopEURUSD facing resistance at Triple Top. With new geo-political situtaion yesterday night, Eith it will retace from this level or from upper channel line.

EUR USD LONG RESULT Price fell inside a closing wedge pattern towards the end of the last trading week and broke out of the wedge pattern with the major resistance Trendline laying above for test.
I look the long setup from the support zone in Confluence with the support Trendline of the falling wedge, and price held and moved better than expected hitting our TP.
We'll see if price would dump again from the current resistance zone and major bearish Trendline or break above and probably create new highs, we'll see.
_THE_KLASSIC_TRADER_.

EURUSD is in a Downside DirectionHello Traders
In This Chart EURUSD HOURLY Forex Forecast By FOREX PLANET
today EURUSD analysis 👆
🟢This Chart includes_ (EURUSD market update)
🟢What is The Next Opportunity on EURUSD Market
🟢how to Enter to the Valid Entry With Assurance Profit
This CHART is For Trader's that Want to Improve Their Technical Analysis Skills and Their Trading By Understanding How To Analyze The Market Using Multiple Timeframes and Understanding The Bigger Picture on the Charts

EURUSD SHORT TRADE IDEAAfter seeing some bearish pressure, we can look to enter a short trade after waiting for confirmation
EURUSD: Bears Will Push Lower
The analysis of the EURUSD chart clearly shows us that the pair is finally about to tank due to the rising pressure from the sellers.
Disclosure: I am part of Trade Nation's Influencer program and receive a monthly fee for using their TradingView charts in my analysis.
❤️ Please, support our work with like & comment! ❤️

EURUSD: Local Bearish Bias! Short!
My dear friends,
Today we will analyse EURUSD together☺️
The in-trend continuation seems likely as the current long-term trend appears to be strong, and price is holding below a key level of 1.15261 So a bearish continuation seems plausible, targeting the next low. We should enter on confirmation, and place a stop-loss beyond the recent swing level.
❤️Sending you lots of Love and Hugs❤️
EURUSD Is Going Down! Sell!
Please, check our technical outlook for EURUSD.
Time Frame: 1h
Current Trend: Bearish
Sentiment: Overbought (based on 7-period RSI)
Forecast: Bearish
The price is testing a key resistance 1.146.
Taking into consideration the current market trend & overbought RSI, chances will be high to see a bearish movement to the downside at least to 1.143 level.
P.S
Overbought describes a period of time where there has been a significant and consistent upward move in price over a period of time without much pullback.
Disclosure: I am part of Trade Nation's Influencer program and receive a monthly fee for using their TradingView charts in my analysis.
Like and subscribe and comment my ideas if you enjoy them!

EURUSD Long As the war escalated over the weekend market gapped during Asia session invalidating our initial forecast. (Linked Idea). Looking for the long on EURUSD.

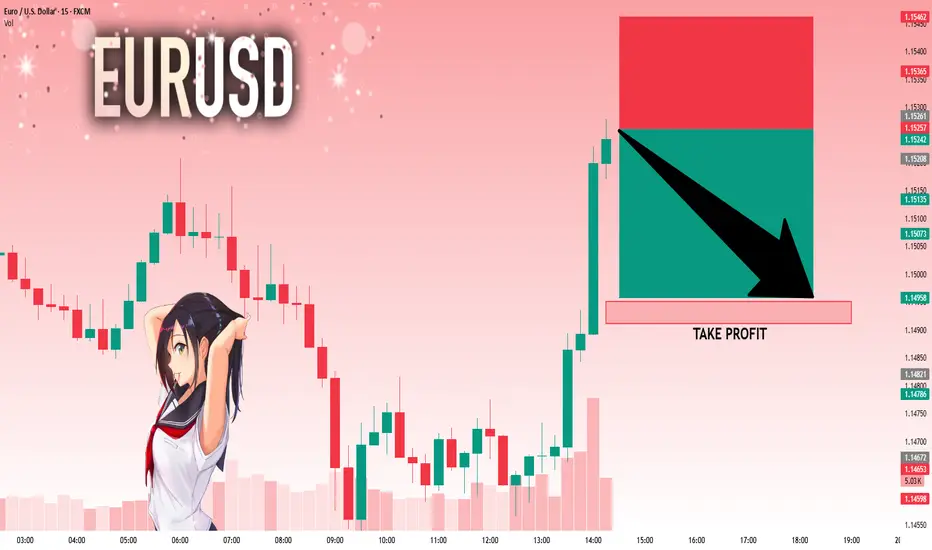
EURUSD | m15 supply playPrice broke structure with a clean CHoCH, then pulled back into a refined M15 supply zone. After rejecting the imbalance area, I executed a short aiming for the next liquidity pool below 1.14250.
🧩 Confluences:
CHoCH + Lower High confirmation 🔁
Supply zone entry + FVG rejection
3-candle mitigation + bearish pressure returning
🎯 Target: 1.14050
❌ SL above: 1.14830
“Structure breaks first, then price tells the story. Patience pays.” 🔥📉

EURUSD Outlook at Risk of Changing in the Short and Medium TermEURUSD is feeling the bearish pressure as geopolitical tensions in the Middle East escalate. These risks are driving traders toward safe havens, particularly the US dollar and US government debt, which still serve as the backbone of global reserves. The sharp decline in the dollar in recent months has added to this dynamic, but it’s not over yet for euro bulls in all the short, medium, and long term.
However, the options market is flashing a rare bearish signal for EURUSD that traders should not ignore. Risk reversals across all maturities from 1 week to 1 year are falling. The 1-week risk reversal dropped sharply from 0.1075 to -1.10 since last Monday, one of the steepest moves seen recently, even though EURUSD itself has remained relatively flat.
The breakout and successful retest of the long-term downtrend from 2008 to 2025 was a key turning point. As long as EURUSD stays above this trendline, dips are likely to be seen as buying opportunities by long-term investors.
For the medium term, however, a bearish signal (for EURUSD) has emerged from the dollar index. The index broke out of the wedge formation (update the post above to see), retested it, and has since resumed its upward move, creating a strong bullish technical setup.
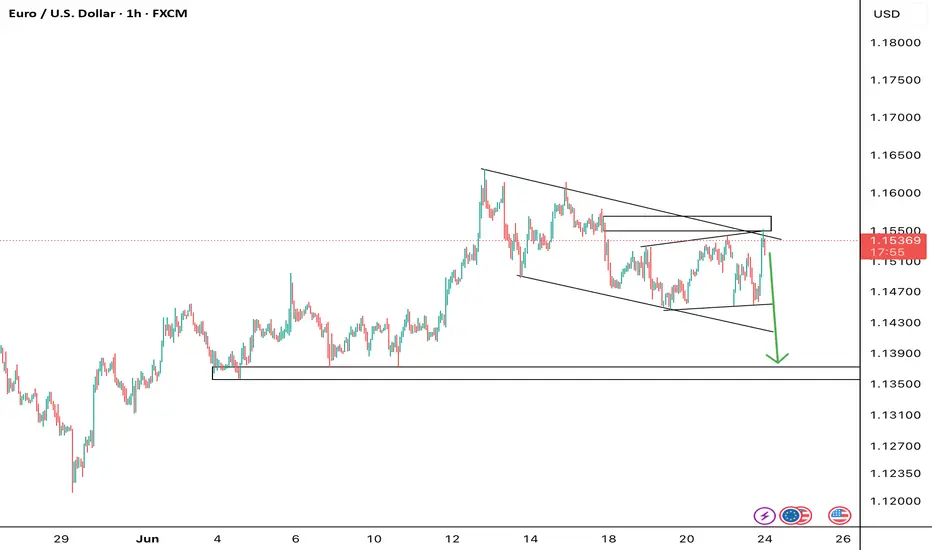
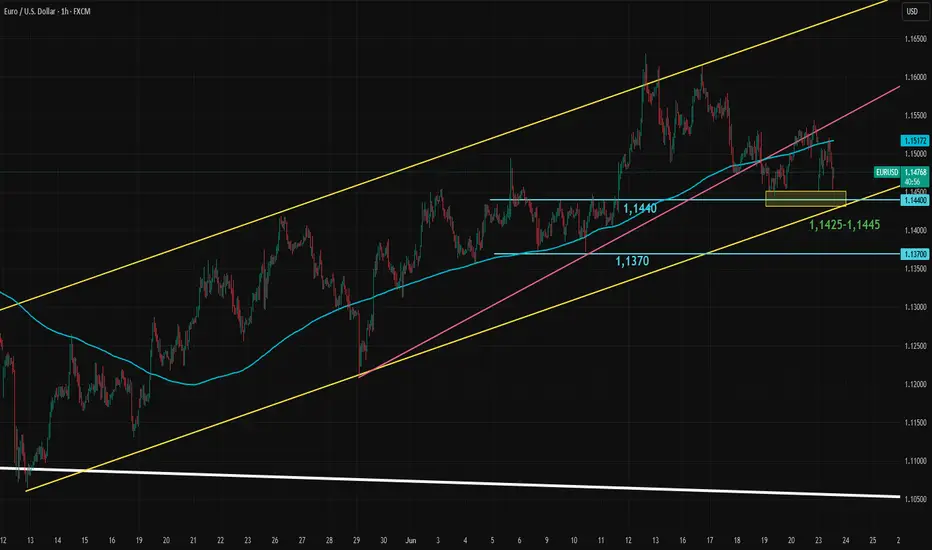
Now, everything comes down to short-term support. EURUSD has been in an upward trend channel since the retest of the long-term trendline and had also formed a shorter-term trend within that channel. This shorter trendline has now broken and been retested. The next critical level is the 1.1425–1.1440 support zone. If this area fails to hold, it could shift both the short- and medium-term direction to the downside.
Note: In this post, "short term" refers to up to one week, "medium term" to one to several weeks, and "long term" to several months to a few years.
EUR/USD Slips Toward Trend SupportEuro plunged nearly 1.6% from the highs with price rebounding this week at former resistance at the 1.618% extension of the May advance. While the risk remains for a deeper correction towards the April uptrend, we’re looking for signs of support / that a low is in.
EUR/USD is trading within the confines of a proposed descending channel with price rebounding off confluent support at the lower parallel yesterday. The immediate focus is on this recovery with initial resistance eyed at the 61.8% retracement of the recent decline / the high-day close (HDC) at 1.1560/85. Ultimately, a breach / close above the 2016 high would be needed to mark uptrend resumption towards the upper parallel (currently near 1.1680s) and the August 2015 high / 78.6% retracement of the 2021 decline at 1.1714/47- both regions of interest for possible top-side exhaustion / price inflection IF reached.
Initial support rests at 1.1455 and is backed by the 38.2% retracement of the May advance at 1.1415. Note that the April trendline converges on this threshold mid-week and a break / close below this slope would be needed to suggest a more significant high weas registered las week / a larger trend correction is underway. Subsequent support rests with the objective monthly open at 1.1347 and the 2023 high / 61.8% retracement at 1.1276/82- look for a larger reaction there IF reached.
Bottom line: The Euro rally remains vulnerable to a test of uptrend support while below 1.1585. From a trading standpoint, losses would need to be limited to the April trendline IF price is heading higher on this stretch with a close above 1.1616 needed to mark uptrend resumption.
-MB

Uptrend in EURUSDEURUSD remains in a clear upward trend.
Last week, key economic events passed, but the pair failed to reach a new high.
This week, we’ll be watching for signs that the current pullback is ending and looking for potential buying opportunities.
The first support levels are the previous low and 1,1443.
The target is to test and break above the previous high!

EURUSD InsightWelcome, everyone!
Please feel free to share your personal thoughts in the comments. Don’t forget to hit the booster and subscribe!
Key Highlights
- Christopher Waller, a Federal Reserve Governor, stated in a CNBC interview that a rate cut in July should be considered.
- The United States has attacked three Iranian nuclear facilities located in Fordow, Natanz, and Isfahan. In response, Iran has hinted at potentially blocking the Strait of Hormuz and has warned of retaliatory action. The U.S. Department of Defense responded by warning that any retaliation would result in a much stronger counterattack.
- According to The Wall Street Journal, the Trump administration has notified that it plans to restrict the supply of U.S.-made semiconductor equipment to Samsung Electronics and SK Hynix’s factories in China.
This Week’s Key Economic Events
+ June 24: Fed Chair Jerome Powell testimony
+ June 25: Fed Chair Jerome Powell testimony
+ June 26: U.S. Q1 GDP release
+ June 27: U.S. May PCE Price Index release
EURUSD Chart Analysis
The EURUSD pair has shown a downward move after facing resistance at a recent trend high. Although it is currently experiencing a slight rebound around the 1.14500 level, the overall trend remains bearish. The next likely support level is around 1.13000, and a recovery may follow once this area is tested.
If, contrary to expectations, the price breaks above the current trend high, a new strategy will be established accordingly.