EURUSD OUTLOOK 1 - 4 JulyStill Bullish on EU. No Fundamental or technical reasons to be short.
We could have a short term pullback within the daily range to then continue long..
If we get that 4H pullback I will only long after getting a 4H technical confirmation.
USDEUX trade ideas

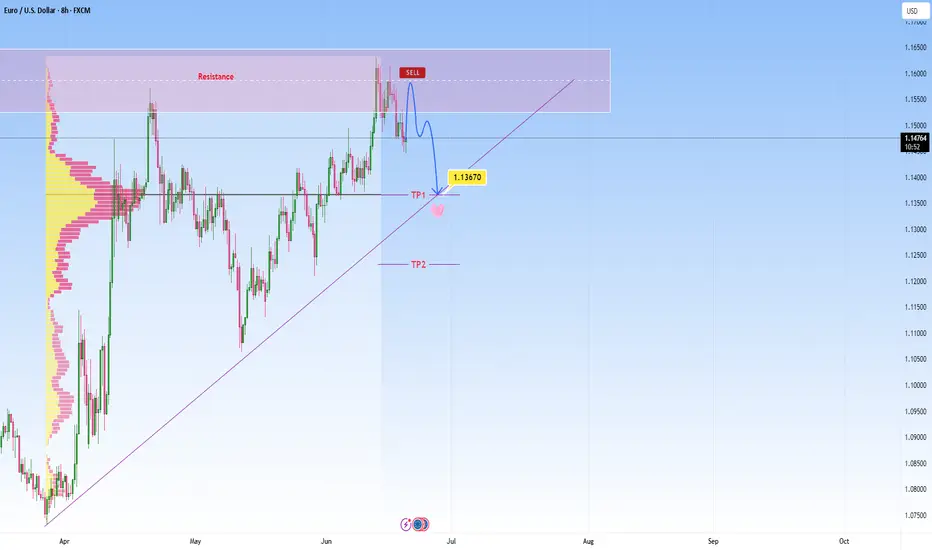
EURUSD heads towards resistance, short-term reversal expectedEURUSD has been in a strong uptrend, and we’re currently observing price action is reaching a notable resistance zone. I am watching for a reversal here as marked on my chart, not expecting a major move, but rather a short-term rejection with a downside target at around 1.13670 , which also aligns with the POC.
This is where it can become a decision point, either price finds support and bounces, or it breaks below, and that’s when we might see the move start to extend lower.
If we get a decisive breakdown through that ascending trendline, my next area of interest is marked as TP2. From there we can expect either potential accumulation or another reaction, depending on broader market sentiment at the time.
That said, we're navigating a complex backdrop currently:
The EU macro environment is under pressure, as weak economic data from Europe is contributing to cautious sentiment around the euro.
Meanwhile, a sustained USD bid continues, supported by stronger U.S. growth expectations, favorable yields, and persistent global demand. This further weighs on EURUSD.
Adding to the uncertainty, escalating tensions between Israel and Iran have rattled markets this week. This geopolitical risk could be pushing oil prices higher:
It’s important to note that if price convincingly rejects here and loses structure, especially with high volume and obvious bullish structure, this setup would become invalid. In that case, I would reassess and adapt
EUR/USD Weekly – Two Long Setups Hello guys!
It is my perspective on eurusd!
Before we even reach the major resistance zone around 1.2050–1.2100, I’ve highlighted two long-term opportunities that may unfold as the price continues to climb.
✔ First Long Position:
It looks like a more conservative entry. The price is already above it. You can set a pending position!
It was likely aiming to catch the momentum as the price broke above the previous structure.
TP is near the descending trendline, around 1.2050–1.2100. a smart place to exit before major resistance hits.
✔ Second Long Position:
Positioned slightly lower. probably in case of a pullback or retest into the broken zone.
This one offers better risk-reward, but requires patience and a cleaner retracement.
Both longs are short-to mid-term swing ideas, aiming to ride the bullish leg into the bigger trendline rejection zone, where I’d personally be more cautious or even look for reversal setups.

EURUSD: Support & Resistance Analysis for Next Week 🇪🇺🇺🇸
Here is my latest structure analysis
and important supports & resistances for EURUSD for next week.
Consider these structures for pullback/breakout trading.
❤️Please, support my work with like, thank you!❤️
I am part of Trade Nation's Influencer program and receive a monthly fee for using their TradingView charts in my analysis.

EUR/USD.4h chart pattern.EUR/USD 4H chart, I can see an ascending trendline with a breakout to the upside, suggesting bullish momentum. You’ve also marked a "TARGET" zone visually on the chart.
Estimated Target:
Based on standard breakout and trend continuation principles:
Current Price: Around 1.1598
Visual Target Zone (as per your chart): Near 1.1700
Potential Target Zone:
1.1700 - 1.1720 (Approximate zone for bullish continuation if breakout holds)
Notes:
✅ Strong bullish structure confirmed by higher highs and trendline support
✅ Breakout already in motion; as long as price stays above the trendline, bullish target remains valid
✅ Watch key support at 1.1535 - 1.1500; price falling below this weakens bullish outlook
Would you like Fibonacci or measured move targets calculated more precisely? Let me know!

EURUSD – Watch for Short-Term Reversal at Key ResistanceHello everyone! What’s your take on EURUSD?
EURUSD is clearly in a strong uptrend, but we should also keep an eye on potential short-term selling opportunities.
I’ve placed an entry near the psychological resistance at 1.175, waiting for signs of a reversal. If strong selling pressure emerges at this zone, EURUSD could pull back with two clear targets: TP1 around 1.1650 and TP2 near the 1.1590 support, an area of previous high-volume accumulation.
Confirmation would come from a bearish reversal candlestick at resistance, ideally with increasing volume. This could be a great opportunity for those waiting for a healthy correction before the uptrend resumes.
What’s your outlook on this pair?

EURUSD BEARISH REVERSAL At the top 1.1745, we see strong rejection wicks and bearish engulfing candles, hinting at exhaustion of buyers, Market entered sideways consolidation between 1.1680 and 1.1740, Price failed to break out of this range multiple times — forming a range-bound or distribution phase.
The current bullish candle indicates a temporary relief rally after recent bearish pressure, Rejection from 1.1720–1.1740 may send price back to test 1.1690 or lower.

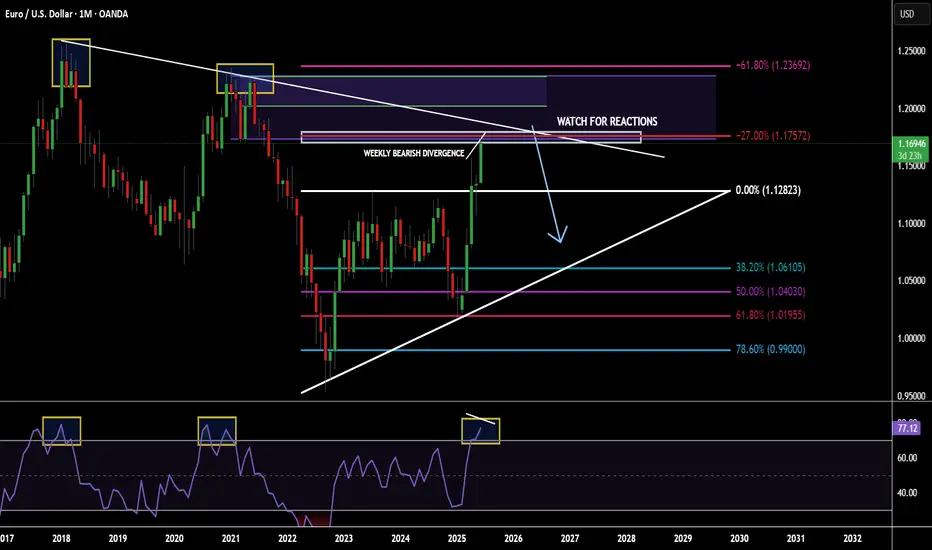
POTENTIAL EURUSD SHORT OPPORTUNITY...POSITION TRADEHello hello TradingView family! Hope you guys are doing amazingly well! Just wanted to come on here and make another post for a potential longer term opportunity I am seeing on the major currency pair EURUSD. So put your seat belts on and let's dive in!!
OK so I'm going to keep this very very simple. Not because I don't want to go in depth but because my trading is very simple and I'm just going to give it to you straight. So here are the points
1. Price is @ monthly supply
2. Price has made new highs & sitting at a monthly fib extension
3. Monthly RSI overbought conditions
4. Weekly has bearish divergence forming
5. Weekly/Daily buyer is slowing down
Make sense? If not..then I know you will figure it out. Watch for price to potentially poke a little higher but nice confluences for a fall in price. Appreciate you all!
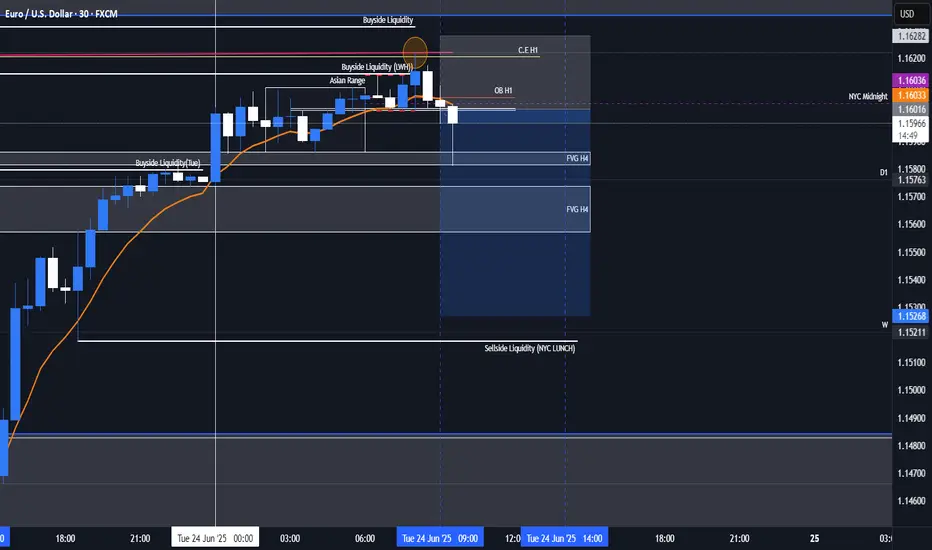
EURUSD Sell, June 27HTF shows reaction from W/D Orderblocks with multiple Daily imbalances below as downside targets. While GBPUSD is also at a valid D OB, EU gives clearer confirmation on LTF.
On LTF, price opened London above Asia highs (ideal for short setups) and showed 15m BOS into a 15m POI.
We've tapped into a 5m Orderblock inside the 15m zone, followed by a clean 1m BOS.
📍Entry: 5m OB with SL above highs (tight 10 pip risk)
🎯 TP1: 1:3 (75% off)
🎯 Final TP: Below Asia low & Daily imbalance
📉 Risk: 0.25% (reduced it for more consistency)
Confident setup — but if price rallies to the upper 5m OB and leaves without us, that’s part of the plan. No chasing.

EURO - After movement up, price will drop to support lineHi guys, this is my overview for EURUSD, feel free to check it and write your feedback in comments👊
Recently price started to grow inside a rising channel, where it some time traded below the support area and soon bounced up.
Price broke $1.1455 level and rose to the resistance line of the channel, after which it turned around and made correction movement.
Next, price some time traded near $1.1455 level and then bounced and continued to move up inside the channel.
In a short time Euro rose to $1.1700 level, which coincided with a support area, and some time trades between this level.
Then the price broke this level and continued to move up, until it almost reached the resistance line of the channel and started to fall.
Now, I think the Euro can rise a little and then continue to fall to $1.1610 support line of the channel, breaking $1.1700 level.
If this post is useful to you, you can support me with like/boost and advice in comments❤️
Disclaimer: As part of ThinkMarkets’ Influencer Program, I am sponsored to share and publish their charts in my analysis.

Euro may start to decline to support line of upward channelHello traders, I want share with you my opinion about Euro. Earlier, the price was trading inside a downward wedge, gradually making lower highs and lower lows. After reaching the bottom of the wedge near the buyer zone (1.1210 - 1.1180), we saw a strong bullish impulse that broke through both the resistance line of the wedge and the support area near 1.1450 - 1.1485. This breakout signaled the beginning of a new phase - a transition into an Upward Channel. Since then, the price has been forming higher highs and higher lows, respecting both the upper and lower boundaries of this new structure. Along the way, it has rebounded from the support line multiple times and recently made a strong move up toward the resistance line of the channel. Currently, the price is approaching that resistance line, which may act as a potential reversal area. Given the previous price behavior and the clearly defined channel, I expect the price to reach the top boundary and then start to decline toward the lower support line. That’s why I’ve set my TP 1 at 1.1555 points, which aligns perfectly with the support line of the upward channel. Based on the recent breakout, the structure of the trend, and the reaction from key zones, I remain short-biased for the upcoming sessions. Please share this idea with your friends and click Boost 🚀
Disclaimer: As part of ThinkMarkets’ Influencer Program, I am sponsored to share and publish their charts in my analysis.


EU on 4HEU on 4H - pretending to be bullish. showing signs to go up but on lower timeframe it shows it can be scalped the way through

Trading Recommendations and Analysis for EUR/USDOn the weekly chart, the price is approaching the upper boundary of the price channel, around the 1.1822 mark, from which a reversal of the entire trend may occur.
A divergence with the Marlin oscillator is ready for immediate formation. If the price breaks above the channel line, it will most likely be a false false breakout, invalidating the channel. Only a weekly candle close above the specified level, accompanied by the oscillator rising above the previous peak, would significantly complicate the technical picture for a trend reversal.
On the daily chart, a possible target in the event of a breakout above 1.1822 is the 1.1905 level - the resistance from 1.1822 is the 1.1905 level - the resistance from July - August 2021. On the four - hour chart, the Marlin oscillator does not support the price's bullish momentum.
For now, the trend remains upward, but we are preparing for a possible shift. The Nonfarm Payrolls, Independence Day, and "Liberation Day" (new tariffs) are just around the corner. Donald Trump may have a surprise in store.

EURUSD – Breakout Confirmed, Now Watching for Retest or 4hr ClosEURUSD has officially broken above the key 1.16020 resistance level on the 4hr chart, but price action has since gone stagnant. No strong bullish momentum has followed the break so far — a sign we may be due for a deeper pullback.
I remain bullish overall, but I'm watching for two potential scenarios:
✅ Safe Buy: Clean 4hr bullish close above 1.16020
🎯 HRHR Buy: Pullback to the former level of interest at 1.14149 if structure holds
Until one of those triggers, I’ll be patient. Let the setup come to you. Overall target remains the 1.18791 zone before reassessing.

Lingrid | EURUSD Short-Term Correction. Counter Trend SetupThe price perfectly fulfilled my previous idea . FX:EURUSD completed a full impulse move from the bottom, touching the upper resistance line while showing clear bearish divergence at recent highs. Price is now hovering near 1.16450, with early signs of weakness below the ascending blue trendline. A breakdown from this zone could confirm a reversal toward the 1.15585 support and potentially deeper if momentum builds.
📉 Key Levels
Sell zone: 1.1630 – 1.1650
Sell trigger: break below 1.1600
Target: 1.15525
Buy trigger: breakout and hold above 1.1650
⚠️ Risks
Divergence may take time to fully play out
Reclaiming 1.1650 would negate bearish setup
Consolidation near highs may trap early sellers
If this idea resonates with you or you have your own opinion, traders, hit the comments. I’m excited to read your thoughts!

EURUSD 30Min Engaged ( Bullish Entry Detected )➕ Objective: Precision Volume Execution
Time Frame: 30-Minute Warfare
Entry Protocol: Only after volume-verified breakout
🩸 Bullish Wave Coming From : 1.17850
➗ Hanzo Protocol: Volume-Tiered Entry Authority
➕ Zone Activated: Dynamic market pressure detected.
The level isn’t just price — it’s a memory of where they moved size.
Volume is rising beneath the surface — not noise, but preparation.
🔥 Tactical Note:
We wait for the energy signature — when volume betrays intention.
The trap gets set. The weak follow. We execute.
EURUSD 30Min Engaged ( Bullish Entry Detected )
EURUSDEURUSD
30m Time Frame Bullish setup, Candle Stick Pattern
Move SL To Entry once reach first target.

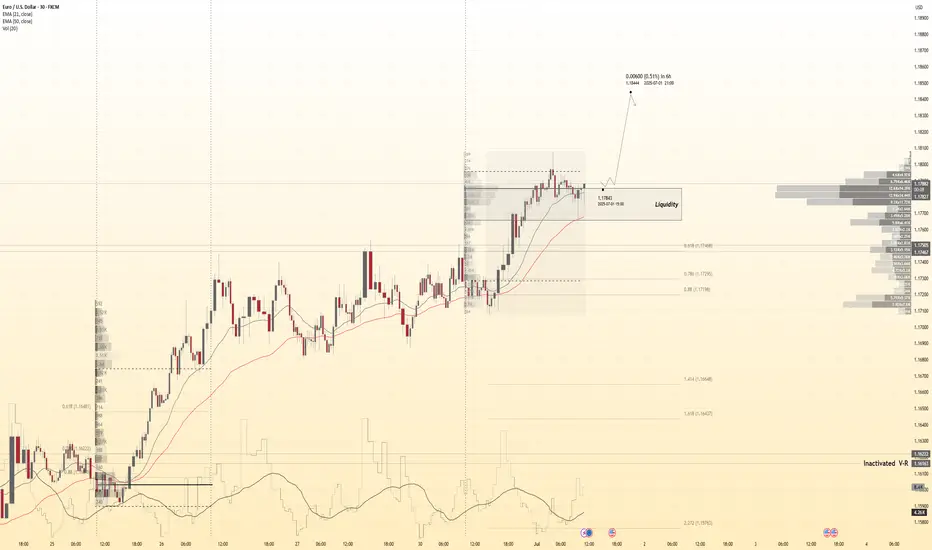
EURUSD Intra-day ShortEURUSD is in a long-term pivot to go short but the market is still in a accumulation phase of collecting orders and so we are still not in the position yet to commit to longer targets. We are looking at short term draw on liquidity like yesterday's NYC session and are accounting for a possible accumulation there after to the upside potentially.
EUR/USD Bullish Continuation Analysis EUR/USD Bullish Continuation Analysis 🚀💶
📊 Chart Summary:
The EUR/USD pair is demonstrating a strong bullish structure with consistent higher highs and higher lows. Recent price action shows a breakout above the 1.16386 resistance level, now acting as support 🛡️. The market is currently retracing and might retest this new support zone before continuing its upward move toward the target.
🔍 Key Observations:
🔸 Bullish Structure:
Multiple bullish impulses have formed a clean staircase pattern (🔼⬆️), indicating sustained buying momentum.
🔸 Support Zone 🟦 (1.13200 - 1.14000):
This zone has been tested multiple times, confirming its strength and the base of this bullish rally.
🔸 Breakout & Retest 🟠:
Price broke above the 1.16386 resistance level, pulled back slightly (highlighted by the orange circle), and now looks ready for a potential continuation to the upside.
🔸 Target 🎯: 1.18010
A clear target has been set based on measured move or resistance projection. If the price respects the current structure, we may see a continuation toward this level.
✅ Trade Outlook:
Bias: Bullish 📈
Entry Zone: Around 1.16386 (upon bullish confirmation)
Target 🎯: 1.18010
Invalidation ❌: Break below 1.1600 with bearish momentum
🧠 Technical Tip:
Always wait for confirmation on the retest before entering. Wick rejections or bullish engulfing candles at the support zone can provide additional entry confidence. 🔍✅

Bullish bounce off pullback support?EUR/USD is falling towards the support level which is a pullback support that aligns with the 38.2% and the 61.8% Fibonacci retracement and could bounce from this level to our take profit.
Entry: 1.1742
Why we like it:
There is a pullback support level that lines up with the 38.2% and the 61.8% Fibonacci retracement.
Stop loss: 1.1698
Why we like it:
There is a pullback support that is slightly below the 50% Fibonacci retracement.
Take profit: 1.1814
Why we like it:
There is a pullback resistance.
Enjoying your TradingView experience? Review us!
Please be advised that the information presented on TradingView is provided to Vantage (‘Vantage Global Limited’, ‘we’) by a third-party provider (‘Everest Fortune Group’). Please be reminded that you are solely responsible for the trading decisions on your account. There is a very high degree of risk involved in trading. Any information and/or content is intended entirely for research, educational and informational purposes only and does not constitute investment or consultation advice or investment strategy. The information is not tailored to the investment needs of any specific person and therefore does not involve a consideration of any of the investment objectives, financial situation or needs of any viewer that may receive it. Kindly also note that past performance is not a reliable indicator of future results. Actual results may differ materially from those anticipated in forward-looking or past performance statements. We assume no liability as to the accuracy or completeness of any of the information and/or content provided herein and the Company cannot be held responsible for any omission, mistake nor for any loss or damage including without limitation to any loss of profit which may arise from reliance on any information supplied by Everest Fortune Group.

EURUSD I Monday CLS I Model 1Hey, Market Warriors, here is another outlook on this instrument
If you’ve been following me, you already know every setup you see is built around a CLS Footprint, a Key Level, Liquidity and a specific execution model.
If you haven't followed me yet, start now.
My trading system is completely mechanical — designed to remove emotions, opinions, and impulsive decisions. No messy diagonal lines. No random drawings. Just clarity, structure, and execution.
🧩 What is CLS?
CLS is real smart money — the combined power of major investment banks and central banks moving over 6.5 trillion dollars a day. Understanding their operations is key to markets.
✅ Understanding the behavior of CLS allows you to position yourself with the giants during the market manipulations — leading to buying lows and selling highs - cleaner entries, clearer exits, and consistent profits.
📍 Model 1
is right after the manipulation of the CLS candle when CIOD occurs, and we are targeting 50% of the CLS range. H4 CLS ranges supported by HTF go straight to the opposing range.
"Adapt what is useful, reject what is useless, and add what is specifically your own."
— David Perk aka Dave FX Hunter ⚔️
👍 Hit like if you find this analysis helpful, and don't hesitate to comment with your opinions, charts or any questions.

EU Weekly28/06 Narrative:
BSL taken out @ 1.16921
Bearish QT SMT has formed
After long push up, price may retrace to 50% (1.14096)
And continue higher to 1.17527 targeting 1.2200 big figure.
