EUR/USD Approaching Key Resistance – Will Bulls Break Through?EUR/USD continues to trade within a strong uptrend, respecting the 50-day SMA while pressing against a key horizontal resistance level around 1.1576. The pair has recently pulled back modestly after testing this level but remains above the short-term moving average, suggesting buyers are still in control.
Technicals provide a mixed, but slightly bullish picture:
Trend Structure: Price action shows a series of higher highs and higher lows since mid-February, confirming a bullish trend.
Moving Averages: The 50-day SMA is above the 200-day SMA (golden cross), and price continues to close above both, reinforcing the bullish bias.
MACD: While flattening, it remains in positive territory – momentum is cooling but not reversing.
RSI: Currently near 59, suggesting bullish momentum without overbought conditions – a healthy zone for a potential continuation higher.
A breakout above the 1.1576 resistance could open the path toward the 78.6% Fibonacci retracement level near 1.1745. However, failure to clear this barrier may invite consolidation or a minor pullback toward the 50-day SMA.
Traders should watch for a daily close above 1.1576 or a bounce from the 50-day SMA to confirm the next directional move.
-MW
USDEUX trade ideas

EURUSD is moving within the 1.14000 - 1.16330 range👀 Possible scenario:
The euro inched up near 1.1500 on June 19, supported by safe-haven flows as Israel-Iran tensions deepened and fears of U.S. involvement grew. Despite slight euro strength, demand for the U.S. dollar remained firm following the Fed’s decision to hold rates and warn of near-term inflation risks driven by Trump’s tariffs. The Fed also forecast slower growth and reaffirmed expectations for two rate cuts in 2025.
Markets now await U.S. data for further rate clues, while attention stays on the Middle East as Trump reportedly issued Iran a final ultimatum to avoid conflict.
✅ Support and Resistance Levels
Now, the support level is located at 1.14000
Resistance level is located at 1.16330

EUR/USD Slips as Fed Stays HawkishEUR/USD hovered near 1.1520 during Friday’s Asian session, extending gains for a third day as the US dollar weakened, likely due to a technical pullback. However, the greenback may rebound as safe-haven demand grows amid rising tensions between the US and Iran.
Citing senior US intelligence, The New York Times reported that Iran hasn’t yet decided to pursue nuclear weapons, despite having enriched uranium reserves. Meanwhile, the Senate Intelligence Committee Chair said President Trump is set to offer Iran one final window to negotiate before considering military action, potentially delaying any decisions for up to two weeks.
Markets are also awaiting Friday’s Monetary Policy Report from the Federal Reserve, which will provide fresh insights into the Fed’s stance. On the Euro side, the ECB’s hawkish outlook offered additional support, with President Christine Lagarde suggesting rate cuts may soon end as the central bank remains “well positioned” to handle persistent risks.
Resistance is located at 1.1530, while support is seen at 1.1450
Long trade
📍 Pair: EURUSD
📅 Date: Tuesday, June 17, 2025
🕒 Time: 3:00 PM (NY Session PM)
⏱ Time Frame: 1 Hour
📈 Direction: Buyside
📊 Trade Breakdown:
Entry Price 1.14816
Profit Level 1.15696 (+0.77%)
Stop Loss 1.14640 (−0.15%)
Risk-Reward
Ratio 5:1
🧠 Context / Trade Notes:
1H Structure Entry:
Trade initiated at a key bullish order block on the 1hr timeframe, following higher-timeframe trend alignment.

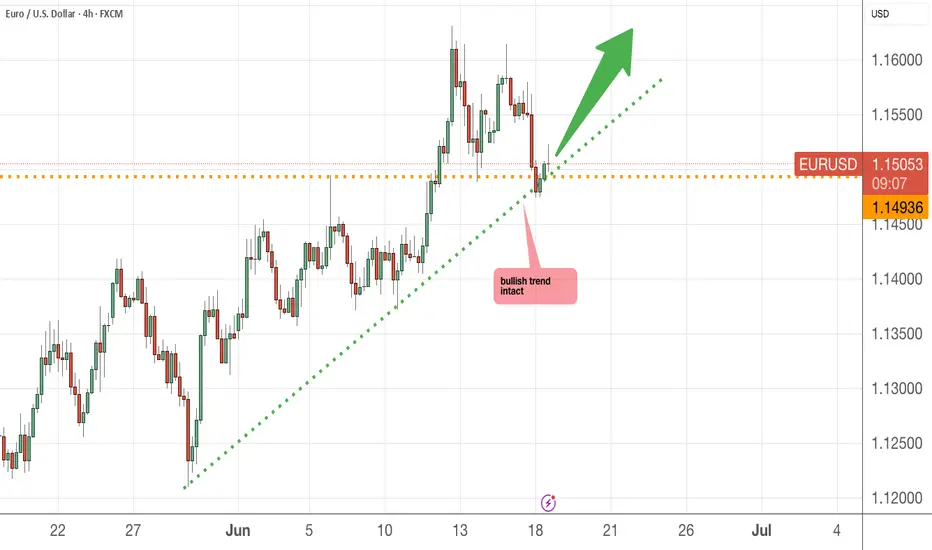
Price action Looks like these trade have changed as I'm looking at eurusd I see trand is still bullish the last break of structure is on upside

EURUSD Sell opportunity I see a sell opportunity on EURUSD
Entry: 1.15300
Sl: 1.15400
TP: 1.14500
Comment your opinion
For fund management. INBOX ME ON X @shajudeakinoba1


EURUSD | BearishEURUSD has broken the higher low level of bullish trend and printed new lower lows and lower lows and lower highs with bearish divergence on RSI.

EUR/USD 2-Hour Chart Analysis2-hour performance of the Euro/U.S. Dollar (EUR/USD) currency pair, showing a recent decline with a change of -0.00134 (-0.12%) to a current value of 1.14676. The chart includes key levels such as a support zone around 1.14012-1.14457 and a resistance zone near 1.15000-1.15509. A breakout above the resistance could indicate a potential upward trend, as suggested by the highlighted area.

EURUSD: Deciding Point for Bearish BiasCurrent Price at Critical Resistance : The price action is currently challenging a significant downward-sloping resistance channel (highlighted in red). This zone has historically acted as a ceiling for price movements, and the current location is explicitly labeled as a "Decider for Breakdown," indicating a pivotal point for future direction.
Implied Bearish Bias : The overall sentiment indicated by the chart's title "At deciding Level, Mostly Bearish" suggests a lean towards downside continuation, although the price is currently pushing against resistance.
Identified Support Confluence : Below the current price, a layered support structure is identified. This includes an upward-sloping "Trend Line Support" channel (green) and a prominent horizontal "POC" (Point of Control), likely derived from volume profile analysis, both residing within a broader "Support Area" (green shaded zone).
Potential Future Pathways : Two immediate potential scenarios: a bearish continuation (red dotted path) if the current resistance holds and lower support levels are broken, or a bullish reversal (green dotted path) if the price successfully breaks above the descending resistance channel.
Swing Structure Visibility : Its kind of Flag and Pole pattern on larger picture, but there is also downward trending line. Purple line indicates the overall market structure interpretation.
Disclaimer:
The information provided in this chart is for educational and informational purposes only and should not be considered as investment advice. Trading and investing involve substantial risk and are not suitable for every investor. You should carefully consider your financial situation and consult with a financial advisor before making any investment decisions. The creator of this chart does not guarantee any specific outcome or profit and is not responsible for any losses incurred as a result of using this information. Past performance is not indicative of future results. Use this information at your own risk. This chart has been created for my own improvement in Trading and Investment Analysis. Please do your own analysis before any investments.

EURUSD H1 I Bearish Reversal Based on the H1 chart, the price is rising toward our sell entry level at 1.1548, a pullback resistance that aligns with the 50% Fib retracement and the 127.25 Fib extension, providing a significant level for a potential bearish reversal.
Our take profit is set at 1.1487, a pullback support.
The stop loss is set at 1.1602, a swing high resistance.
High Risk Investment Warning
Trading Forex/CFDs on margin carries a high level of risk and may not be suitable for all investors. Leverage can work against you.
Stratos Markets Limited (tradu.com ):
CFDs are complex instruments and come with a high risk of losing money rapidly due to leverage. 63% of retail investor accounts lose money when trading CFDs with this provider. You should consider whether you understand how CFDs work and whether you can afford to take the high risk of losing your money.
Stratos Europe Ltd (tradu.com ):
CFDs are complex instruments and come with a high risk of losing money rapidly due to leverage. 63% of retail investor accounts lose money when trading CFDs with this provider. You should consider whether you understand how CFDs work and whether you can afford to take the high risk of losing your money.
Stratos Global LLC (tradu.com ):
Losses can exceed deposits.
Please be advised that the information presented on TradingView is provided to Tradu (‘Company’, ‘we’) by a third-party provider (‘TFA Global Pte Ltd’). Please be reminded that you are solely responsible for the trading decisions on your account. There is a very high degree of risk involved in trading. Any information and/or content is intended entirely for research, educational and informational purposes only and does not constitute investment or consultation advice or investment strategy. The information is not tailored to the investment needs of any specific person and therefore does not involve a consideration of any of the investment objectives, financial situation or needs of any viewer that may receive it. Kindly also note that past performance is not a reliable indicator of future results. Actual results may differ materially from those anticipated in forward-looking or past performance statements. We assume no liability as to the accuracy or completeness of any of the information and/or content provided herein and the Company cannot be held responsible for any omission, mistake nor for any loss or damage including without limitation to any loss of profit which may arise from reliance on any information supplied by TFA Global Pte Ltd.
The speaker(s) is neither an employee, agent nor representative of Tradu and is therefore acting independently. The opinions given are their own, constitute general market commentary, and do not constitute the opinion or advice of Tradu or any form of personal or investment advice. Tradu neither endorses nor guarantees offerings of third-party speakers, nor is Tradu responsible for the content, veracity or opinions of third-party speakers, presenters or participants.

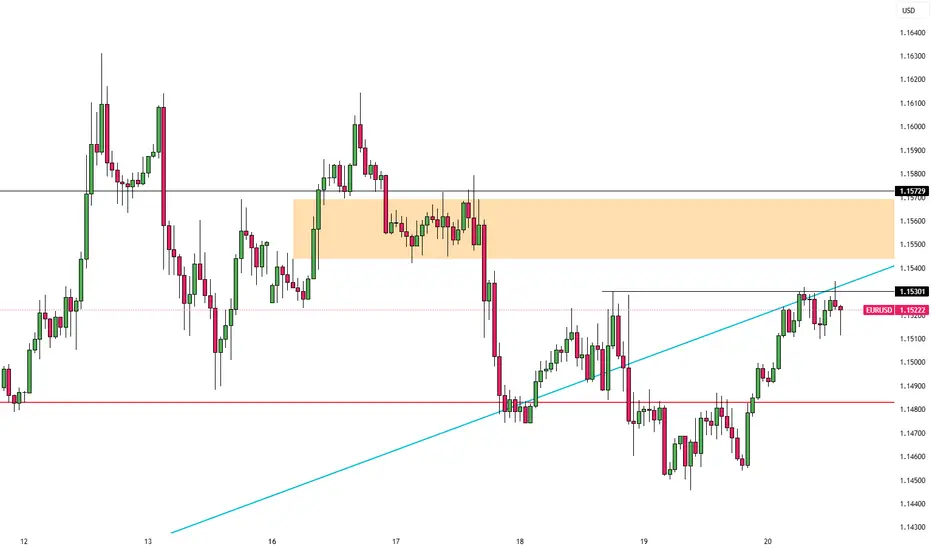
Buying USDBase on the momentum change yesterday on USD.
While EUR is presenting a clear double top with break and on retest
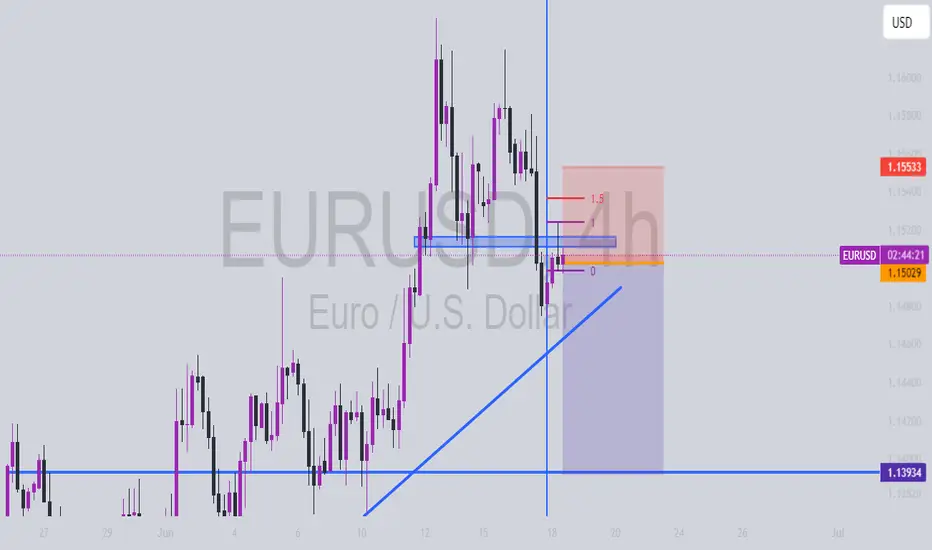
Going to accumulate more Euro dollars Looking at the 4H chart, it has come down to the important support level of 1.1493. If it is able to sustain above this level, then it should have no problem surpassing the previous high of 1.16 price level.
Thereafter, it may form a triple top formation and we see some retracement
EURUSD IDEAueururueruruafadfsdfgsarwfdshgfts4ertsgdfgdf
bearish div on higher timeframe, bearish orderflow and fvgs being respected, but current price is looking like it wants to form a choch after sweeping day fvg and liquidities, so.... idk man

# EURUSD H1 SUPPLY WITH LIQUIDITY # EURUSD H1 Supply with mss with proper Liquidity entry with little pips of sl and big tp

EURUSD: The Market Is Looking Up! Long!
My dear friends,
Today we will analyse EURUSD together☺️
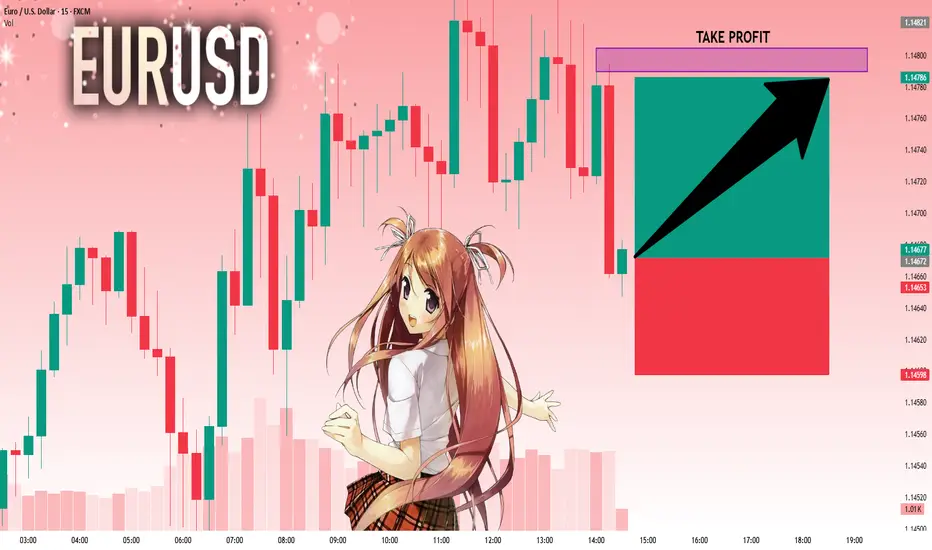
The market is at an inflection zone and price has now reached an area around 1.14672 where previous reversals or breakouts have occurred.And a price reaction that we are seeing on multiple timeframes here could signal the next move up so we can enter on confirmation, and target the next key level of 1.14789.Stop-loss is recommended beyond the inflection zone.
❤️Sending you lots of Love and Hugs❤️
EURUSD SELL OPPORTUNITY Sell opportunity on EURUSD
Entry: 1.14800
Stoploss:1.14900
Takeprofit: 1.14150
Comment your opinion
Need someone to manage your fund. DM on X @shajudeakinoba1

EURUSD Will Go Lower! Sell!
Here is our detailed technical review for EURUSD.
Time Frame: 1h
Current Trend: Bearish
Sentiment: Overbought (based on 7-period RSI)
Forecast: Bearish
The market is trading around a solid horizontal structure 1.148.
Taking into consideration the structure & trend analysis, I believe that the market will reach 1.143 level soon.
P.S
Please, note that an oversold/overbought condition can last for a long time, and therefore being oversold/overbought doesn't mean a price rally will come soon, or at all.
Disclosure: I am part of Trade Nation's Influencer program and receive a monthly fee for using their TradingView charts in my analysis.
Like and subscribe and comment my ideas if you enjoy them!

EUR?USD correctional sellsAfter anticipating the E/U buys with our previous trade market went against us after collecting Liquidity and we are currently looking for seller into our Point of interest on the qhr timeframe... trade is a bit more riskier bcoz of mininum cornfirmation given

EUR/USD TrendlineEUR/USD remains under pressure after breaking its ascending trendline. Price is currently testing resistance between 1.14782 – 1.14985, a zone that could act as a ceiling for a new bearish leg.
If rejection holds, potential targets on the downside are 1.14465 and 1.14311.
A break and hold above 1.14985 would invalidate this bearish idea.

EURUSDLooking to sell the EUR USD on Long Term, the unfolding butterfly is currently almost complete with leg D due, so we selling based on the unfolding leg D and the support that's been broken, however tight with Risk Management on this one as it might make it rain for us if we carefully handle this, observe and decide.

#AN008: Israel, Iran and the price of fear
GEOPOLITICS – Israel, Iran and the price of fear
While the stock markets are trying to hold up, the geopolitical reality is very different. In the last 72 hours, Israel has hit a facility considered strategic in southern Iran. Tehran responded with ballistic warheads targeted at NATO positions, and threatened a military closure of the Strait of Hormuz. In a few hours, Brent has shot above $100, while WTI has touched $94.20, bringing back to life a spectre that seemed archived: energy purchases.
DOLLAR AND FED – Sickles under pressure
The Federal Reserve has kept rates unchanged, but Powell has sent a clear signal: "there will be no cut if the geopolitical context continues to generate upward pressure on prices".
In other words: the FED remains hawkish, the dollar continues to dominate, and global sentiment shifts to risk.
CROSS WATCH – SwipeUP FX Opportunity
EUR/USD
Weak EU macro + sustained US sell-off + war → Realistic target 1.0630 – if it breaks 1.0675 H8.
USD/JPY
Institutionals undecided: if the yen does not strengthen and the BOJ remains neutral, we can return above 158. Target: 158.60-159.2 in case of new USD leg.
CAD/JPY and oil-linked
Canada benefits from the oil increase, but be careful: risk-off can penalize. Assess only with cyclical confirmation and real volumes.
📌 WHAT TO WATCH NOW – SwipeUP Checklist
📆 Friday, June 21: US PMI data + Powell speech
⚠️ VIX above 20: signals real tension
📉 JPY and CHF in divergence? → watch out for manipulative breakouts
🗓️ Earnings Season: can divert flows in the short term, but remains in the background

EUR/USD Slips as Fed Stays HawkishEUR/USD fell toward 1.1465 in Thursday’s Asian session, pressured by a risk-off mood as Middle East tensions rise. The focus shifts to speeches from ECB officials Lagarde, Nagel, and de Guindos for further guidance.
On Wednesday, the Fed held rates at 4.25%–4.50% and signaled a slower pace of cuts, citing inflation risks from Trump’s new tariffs. The FOMC still projects two cuts in 2025
Bloomberg reported the US may strike Iran in the coming days, raising safe-haven demand for the dollar and adding pressure on the euro. ECB’s Lagarde said rate cuts are nearly done and that the ECB is well-positioned to manage current uncertainties.
Resistance is located at 1.1475, while support is seen at 1.1415
