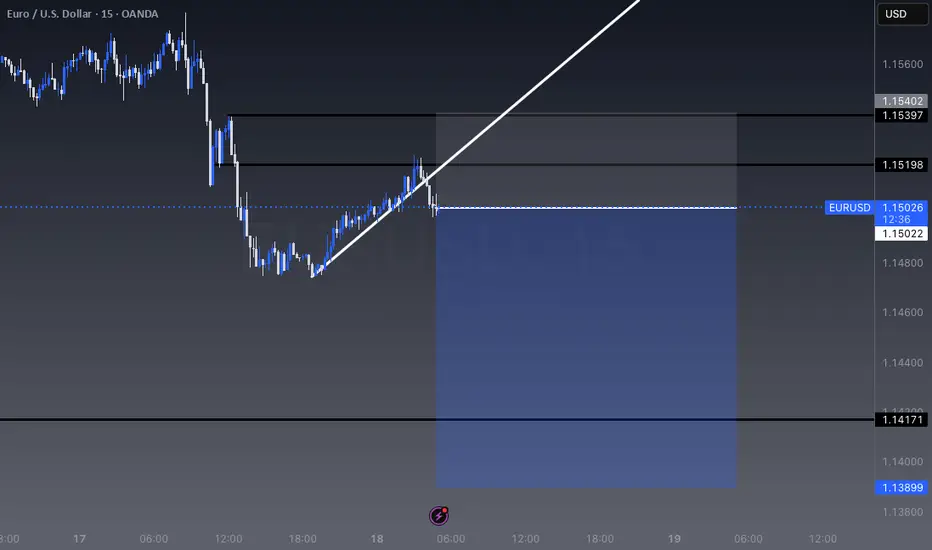
EUR/USD Slides Below Trendline The EUR/USD pair is trending lower and forming a short-term downtrend beneath a descending trendline, as the U.S. Dollar (USD) remains supported by its safe-haven appeal amid escalating tensions in the Middle East between Israel and Iran.
At the time of writing, the pair is trading around 1.1500, with bearish momentum still dominating. As long as the trendline holds, sellers maintain the upper hand — making trend-following short positions worth considering.
Wishing you all successful and smooth trading!
USDEUX trade ideas

SELL before BUY Planning to short EURUSD before entering a buy position to capitalize on potential market movements FX:EURUSD

This is my views on EURUSD so far.I have not yet taken a single position on this pair because price has not yet met my execution requirements. Overall views on the pair are short term bullish to the Weekly/Monthly POI's then I will be looking for a long term bearish structure.

EU SELL IDEAWe identified our daily high & low. We also see price creating lower highs & lower lows, found our key levels of support & previous resistance . Now we ride the wave down to the previous daily low. We also see double engulfing & a break of our counter trend on the 15 min!

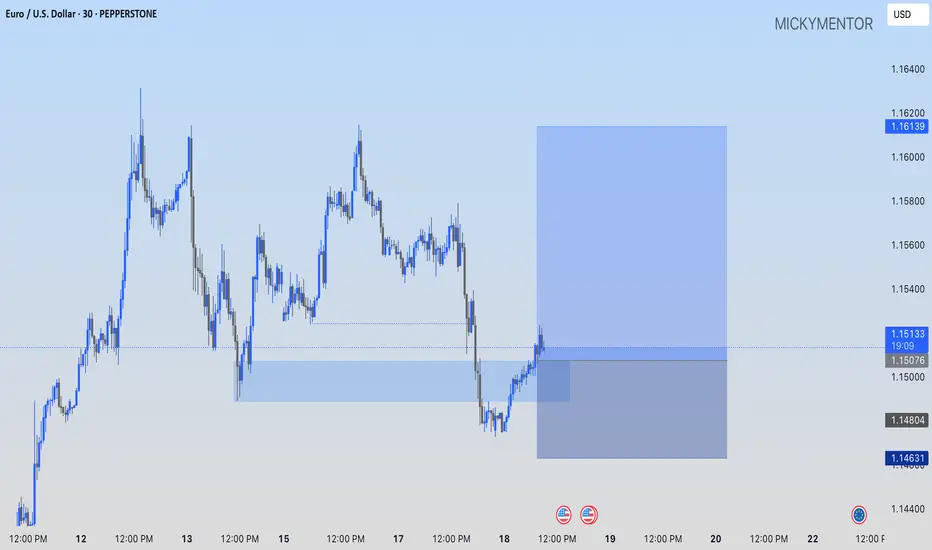
EURUSD: AN OPPORTUNITY TO BUY!! PEPPERSTONE:EURUSD I'm buying at current market price, I'll target the 1.16147 as my profit target.
I'm selling EURUSD, sliding down as we planned!Per my previous post, EURUSD is now bearish, and we are anticipating a continuation from here.
Apply proper risk management.
Follow me and turn on notification so you'll see my trades on time and enter them on time

EURUSD sellsI'm currently bearish for EU targeting Asia lows. Lots of trendline liquidity to target. And we're currently trading with a lot of sellers' momentum.

EUR/USD Pressured by Safe-Haven Dollar DemandEUR/USD traded near 1.15 on Wednesday, under pressure from safe-haven demand for the U.S. dollar as Middle East tensions escalated. Fears of broader conflict involving the U.S. kept the dollar firm. Markets await the Federal Reserve’s policy decision, with rates expected to stay unchanged, though guidance may shape future expectations. The euro remained weak, burdened by Europe’s energy import exposure amid rising oil prices.
Resistance is located at 1.1580, while support is seen at 1.1460.

Fundamental Market Analysis for June 18, 2025 EURUSDEvent to pay attention to today:
12:00 EET. EUR - Consumer Price Index
15:30 EET. USD - Unemployment Claims
21:00 EET. USD - FOMC Rate Decision
Declining confidence in the US economy amid trade policy is undermining the US Dollar (USD) against the Euro (EUR). Data released by the US Census Bureau on Tuesday showed that US retail sales fell 0.9% m/m in May, compared to a 0.1% decline (revised from +0.1%) recorded in April. The figure was weaker than estimates of -0.7%. Meanwhile, US industrial production in May declined 0.2% m/m vs. 0.1% previously (revised from 0%), worse than expectations of 0.1%.
Traders expect the US Federal Reserve to leave borrowing costs unchanged at its June meeting on Wednesday. Markets now estimate a nearly 80% chance that the Fed will cut rates in September and then another in October, according to Reuters.
The mood of European Central Bank (ECB) policymakers is supportive of the common currency. ECB President Christine Lagarde said that rate cuts are coming to an end as the central bank is now in a “good position” to deal with the current uncertainty.
Meanwhile, investors will keep an eye on geopolitical risks. Israel is set to step up strikes on Tehran, while the US is considering expanding its role amid rising tensions between Israel and Iran.
Trade recommendation: SELL 1.1460, SL 1.1560, TP 1.1260

DeGRAM | EURUSD rebound from the lower boundary of the channel📊 Technical Analysis
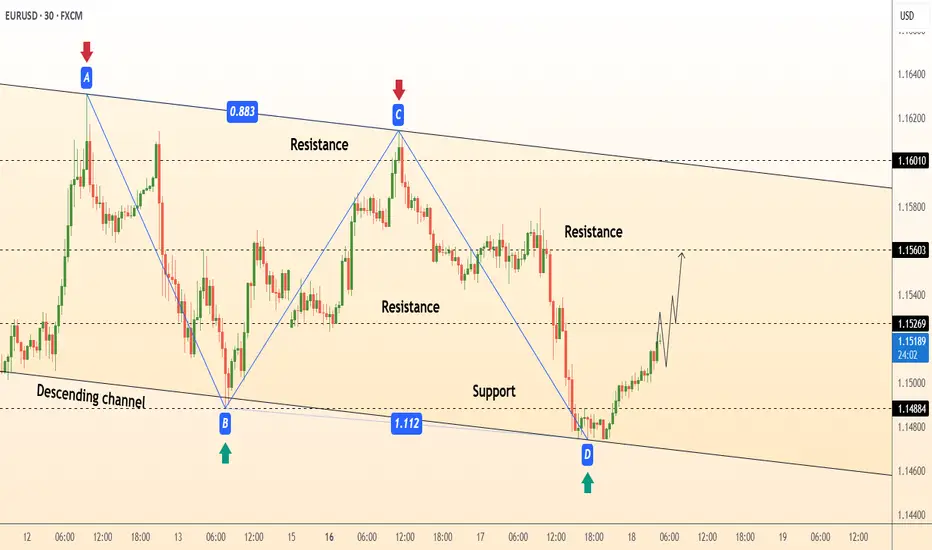
● A completed AB=CD (0.883 / 1.112) pattern at the channel floor (1.1488) produced a hammer, signalling exhaustion of bears at the measured PRZ.
● Price is now reclaiming the micro structure high 1.1526; that flips the inner range to support and opens the next intra-channel pivot 1.1560, with room to the upper wall near 1.1600.
💡 Fundamental Analysis
● EZ May trade balance swung back to a €4 bn surplus while weak US housing starts shaved another 4 bp off 2-yr yields, compressing the short-rate gap and underpinning EUR bids.
✨ Summary
Buy 1.1500-1.1530; break >1.1560 targets 1.1600, stretch 1.1650. Bull bias void on 30 min close below 1.1480.
-------------------
Share your opinion in the comments and support the idea with like. Thanks for your support!
EURUSD – Bullish momentum fades, downside pressure intensifiesEURUSD formed a lower high near 1.1613, signaling weakening bullish momentum. Price is now testing a key trendline, and a break below 1.1473 could confirm a bearish move toward 1.1350.
Market sentiment is currently dominated by the Fed’s hawkish stance following the latest FOMC meeting, where the central bank kept rates unchanged but expressed readiness to hike further if necessary. Meanwhile, although tensions in the Middle East are escalating, they have yet to deliver a significant blow to the USD.
Given the current backdrop, EURUSD is under considerable pressure and may soon break its bullish structure unless strong buying interest re-emerges.

EURUSD Eyes Potential Bullish BatOn the daily chart, EURUSD is currently oscillating at a high level. In the short term, we can pay attention to the area around 1.1402 below. This position is a potential buying position for a bullish bat pattern, and this position is also within the previous demand area.

EURUSD LONGPrice swept below support around 1.1473, grabbing liquidity and quickly bouncing back — this is a classic Wyckoff spring setup.
📌 Key Levels
Entry: Around 1.1500
Stop Loss: Below 1.1424 (spring low)
Target 1: 1.1567 (range high)
Target 2: 1.1614 (measured move)
🔍 Why I like this setup:
Fake breakdown (spring) and quick recovery
Buyers showed up right after the sweep
Expecting price to return to the top of the range and possibly break higher . This a trade we hold
💡 A spring is where smart money steps in after trapping sellers — I'm following them.
“I always say that you could publish my rules in the newspaper and no one would follow them. The key is consistency and discipline.”

EURUSD Sell trade I sell further Sell opportunity on EURUSD
ENTRY: 1.15250
STOPLOSS: 1.15400
TAKE PROFIT: 1.14200
Comment your opinion
For fund management. DM on X @shajudeakinoba1

EURUSD Has breakout the ascending channel bullish strong now EURUSD Breakout Alert!
EURUSD has broken out of the descending channel with strong bullish momentum from the key support level at 1.15100.
📈 Technical Outlook (4H Time Frame):
🔹 Key Support: 1.15100 (confirmed bounce)
🔹 1st Resistance Target: 1.16300
🔹 Bullish Order Block: 1.12900 – strong demand zone below
This breakout signals potential continuation to the upside. Stay tuned as price action develops! 🔥
📌 Like, Follow, Comment & Join us for more real-time updates!
Trade smart, stay informed 😜
— Posted by Livia

EURUSD trades turn their eyes towards upcoming Fed Interest rateEUR/USD has been trading sideways after peaking above 1.1600 last week, as traders adopt a wait and see approach ahead of the Fed's interest rate decision due tomorrow morning (AEST). The pair is consolidating within a tight range, with the top end of the recent rally now being questioned amid growing uncertainty.
While the Fed is widely expected to leave its benchmark interest rate unchanged at 4.25%-4.50%, market participants will be closely watching for any revisions to the dot plot, as well as updates to the central bank's growth and inflation forecasts. The current projections suggest two rate cuts in 2025, but any deviation from that could trigger significant dollar volatility.
On the technical side, multi-year support near 1.1215 remains a critical level to watch on the downside. A break below could signal deeper bearish momentum.
Adding complexity to the EUR side of the equation are two key factors:
The ECB’s rate path, with the central bank seen approaching the end of its monetary easing cycle. Elevated geopolitical tensions, especially as Israel prepares further action against Tehran and the US weighs deeper involvement.
Any escalation in Middle East tensions could boost demand for safe-haven assets like the US dollar, potentially pressuring the euro further.
In the near term, EUR/USD remains in a holding pattern, with the Fed's tone and geopolitical developments likely to determine the next directional move.
"The forecasts provided herein are intended for informational purposes only and should not be construed as guarantees of future performance. This is an example only to enhance a consumer's understanding of the strategy being described above and is not to be taken as Blueberry Markets providing personal advice."

EURUSD: Price Action + Elliott Wave + SMC Analysis
"Hello traders!
Today, we're diving deep into EURUSD with a comprehensive analysis combining Price Action, Elliott Wave principles, and Smart Money Concepts (SMC).
On the chart, we observe key price action elements including:
* A 'Psychological FVG' (Fair Value Gap) around the 1.15100 - 1.15261 area, which could act as a potential resistance or reversal poin
* A target or support level identified around 1.14494 and further down at 1.14502.
Looking ahead, the diagram on the right illustrates a potential Elliott Wave structure integrated with SMC concepts:
* We see proposed waves leading to a 'BOS' (Break of Structure) indicating a shift in market control.
* An 'Imbalance' zone is highlighted, suggesting an area where price might seek to rebalance before continuing its move.
* The overall structure points towards a continued bearish momentum after potential retracements.
Key Takeaways:
* Watch the identified FVG for potential reactions.
* Monitor for further BOS confirmations to validate the bearish outlook.
* The 'Imbalance' zone could offer shorting opportunities if price retests it.
This analysis provides a multi-faceted approach to understanding potential future price movements in EURUSD. Always remember to manage your risk effectively.
What are your thoughts on this analysis? Share your insights in the comments below!
#EURUSD #Forex #PriceAction #ElliottWave #SMC #TradingAnalysis #TechnicalAnalysis #MarketOutlook #ForexTrading"

EUR/USD – Bearish Setup Activated
Price rejected key resistance and broke below the trendline, confirming a sell bias. Entered short after confirmation candle.
Targeting next support zone with strong RR.
Structure: Lower Highs & Lower Lows
Tools Used: Elliott Wave, SMC, Parallel Channel
Timeframe: ., 30m]
#ForexTrading #EURUSD #SmartMoney #PriceAction #SellSetup #TradingViewAnalysis"

CHECK EURUSD SIGNAL READ CAPTAINTrade Setup Details:
Entry Price: 1.15040 (marked in grey)
Current Price (as per screenshot): 1.15046
Stop Loss: 1.14870 🔻
Take Profit Levels:
TP1: Around 1.15260
TP2: Around 1.15440
Last Target: 1.15730🎯

Bullish bounce?The Fiber (EUR/USD) is falling towards the pivot and could bounce to the 1st resistance.
Pivot: 1.1451
1st Support: 1.1342
1st Resistance: 1.1614
Risk Warning:
Trading Forex and CFDs carries a high level of risk to your capital and you should only trade with money you can afford to lose. Trading Forex and CFDs may not be suitable for all investors, so please ensure that you fully understand the risks involved and seek independent advice if necessary.
Disclaimer:
The above opinions given constitute general market commentary, and do not constitute the opinion or advice of IC Markets or any form of personal or investment advice.
Any opinions, news, research, analyses, prices, other information, or links to third-party sites contained on this website are provided on an "as-is" basis, are intended only to be informative, is not an advice nor a recommendation, nor research, or a record of our trading prices, or an offer of, or solicitation for a transaction in any financial instrument and thus should not be treated as such. The information provided does not involve any specific investment objectives, financial situation and needs of any specific person who may receive it. Please be aware, that past performance is not a reliable indicator of future performance and/or results. Past Performance or Forward-looking scenarios based upon the reasonable beliefs of the third-party provider are not a guarantee of future performance. Actual results may differ materially from those anticipated in forward-looking or past performance statements. IC Markets makes no representation or warranty and assumes no liability as to the accuracy or completeness of the information provided, nor any loss arising from any investment based on a recommendation, forecast or any information supplied by any third-party.

EURUSD H1 I Bearish Reversal Based on the H1 chart, the price is rising toward our sell entry level at 1.1538, a pullback resistance that aligns with the 50% Fib retracement.
Our take profit is set at 1.1454, a pullback support that aligns with the 127.2 Fib extension.
The stop loss is set at 1.1570, an overlap resistance.
High Risk Investment Warning
Trading Forex/CFDs on margin carries a high level of risk and may not be suitable for all investors. Leverage can work against you.
Stratos Markets Limited (tradu.com ):
CFDs are complex instruments and come with a high risk of losing money rapidly due to leverage. 63% of retail investor accounts lose money when trading CFDs with this provider. You should consider whether you understand how CFDs work and whether you can afford to take the high risk of losing your money.
Stratos Europe Ltd (tradu.com ):
CFDs are complex instruments and come with a high risk of losing money rapidly due to leverage. 63% of retail investor accounts lose money when trading CFDs with this provider. You should consider whether you understand how CFDs work and whether you can afford to take the high risk of losing your money.
Stratos Global LLC (tradu.com ):
Losses can exceed deposits.
Please be advised that the information presented on TradingView is provided to Tradu (‘Company’, ‘we’) by a third-party provider (‘TFA Global Pte Ltd’). Please be reminded that you are solely responsible for the trading decisions on your account. There is a very high degree of risk involved in trading. Any information and/or content is intended entirely for research, educational and informational purposes only and does not constitute investment or consultation advice or investment strategy. The information is not tailored to the investment needs of any specific person and therefore does not involve a consideration of any of the investment objectives, financial situation or needs of any viewer that may receive it. Kindly also note that past performance is not a reliable indicator of future results. Actual results may differ materially from those anticipated in forward-looking or past performance statements. We assume no liability as to the accuracy or completeness of any of the information and/or content provided herein and the Company cannot be held responsible for any omission, mistake nor for any loss or damage including without limitation to any loss of profit which may arise from reliance on any information supplied by TFA Global Pte Ltd.
The speaker(s) is neither an employee, agent nor representative of Tradu and is therefore acting independently. The opinions given are their own, constitute general market commentary, and do not constitute the opinion or advice of Tradu or any form of personal or investment advice. Tradu neither endorses nor guarantees offerings of third-party speakers, nor is Tradu responsible for the content, veracity or opinions of third-party speakers, presenters or participants.

EURUSD before the FEDThe escalating conflict in the Middle East between Israel and Iran, which appears to be intensifying, is driving investors toward safer assets, leading to a stronger USD.
Today, all eyes are on the FED’s interest rate decision.
Watch for potential reactions at key support levels and a possible continuation of the current trend.
However, ahead of the announcement, it's advisable to reduce risk exposure and hold off on opening new positions.
