USDEUX trade ideas


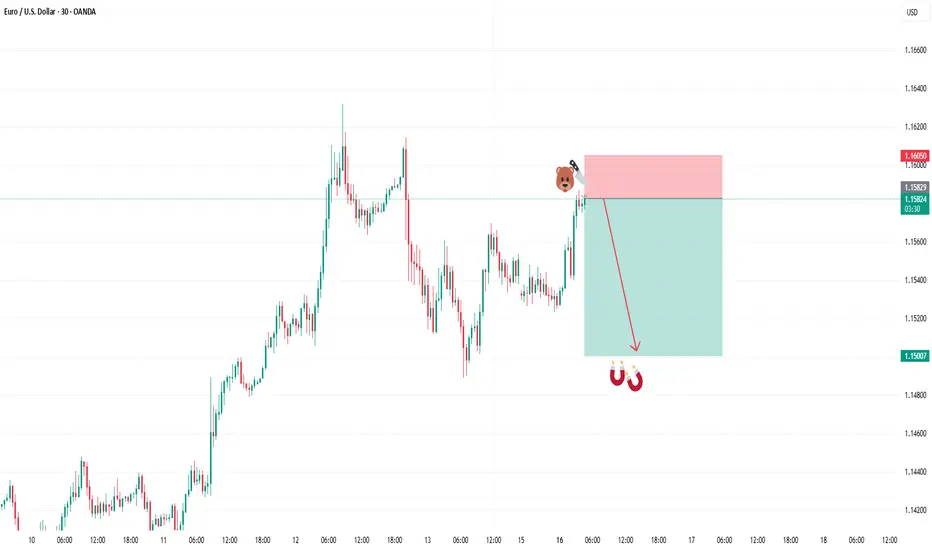
Try a RR1 🔻 Sell Setup 1
Entry: 1.15600
SL: 1.16160
TP: 1.15050
R:R ≈ 1
Rejected from 1.160; Signal bar key bar detected.
Please manage your risk.

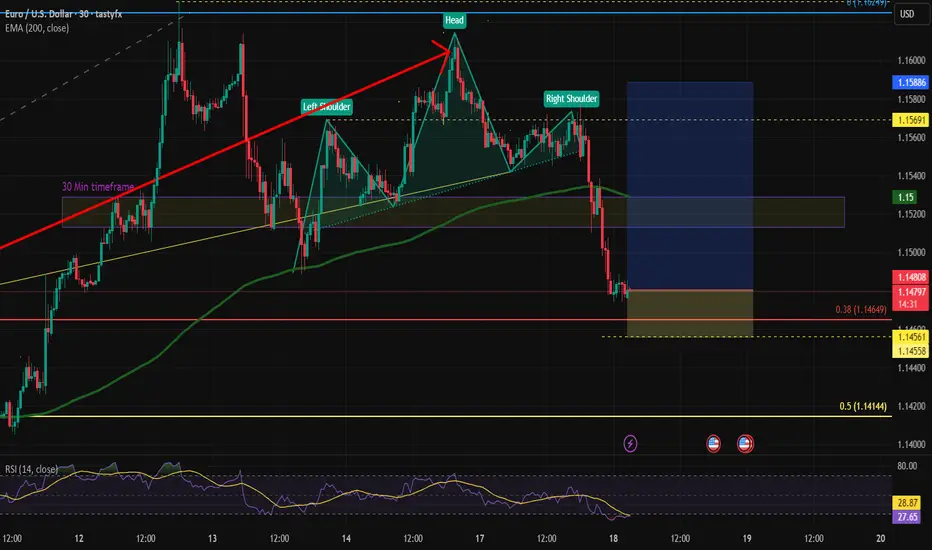
going long on EURUSD based on my analysis I'm thinking that the Head and Shoulders pattern is a fake-out and the trend is going to continue up
Double TopDivergency double top on the daily chart. This could play out nicely but it will take time.

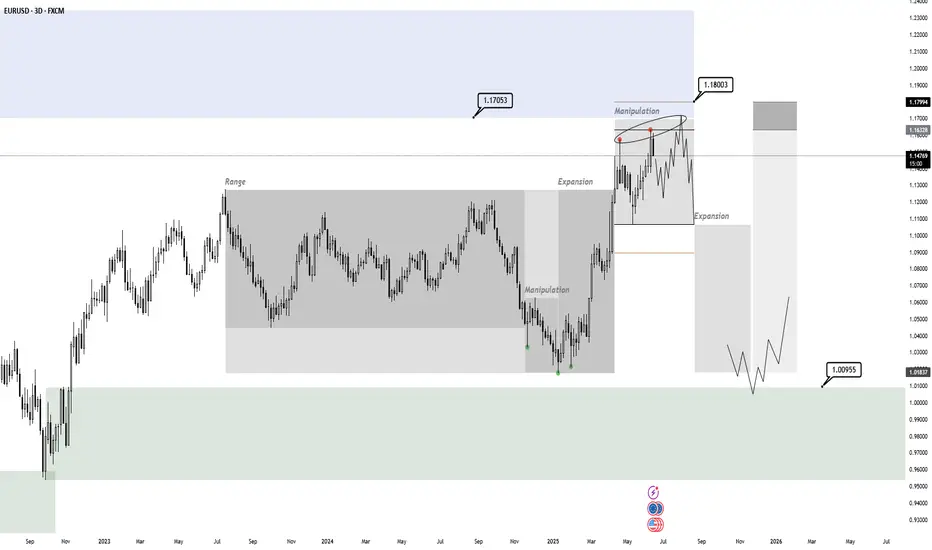
EURUSD PO3If a range forms in this area with distribution into HTF supply, there is a chance of a bearish PO3. One target for this could be the range demand starting in 2022. It is too early to predict this local distribution, as this has only been the first deviation. However, if it does not exceed the deviation limit and the supply, I will continue to monitor it. Starting in January 2025, there was a bullish PO3 that has already reached its technical target. However, it could expand further, invalidate this setup, and keep this demand for later. I will either discard or update this idea depending on developments.
Goldman and BofA agree: The dollar is losing its edgeGoldman Sachs now expects the EUR/USD to hit 1.20 by the end of the year. While this prediction draws comparisons to the 2017 rally in the pair, Goldman notes a key difference. This time, the pricing reflects pessimism in the US dollar, rather than optimism in the euro.
Bank of America seemingly agrees and warns that even a “hawkish” dot plot at this week’s FOMC meeting, where Fed officials signal fewer rate cuts, may only cause a brief bout of euro weakness against the dollar.
EUR/USD has recently broken out of a long-term descending triangle pattern, which capped price action from mid-April through early June, aligning with Goldman Sachs’ and BofA’s view of a broad EUR strength/ USD weakness.
This recent pullback to the 1.1480 area is a retest of former resistance turned support, suggesting a potential continuation pattern if buyers defend this level.

Opportunity for buying EURUSDEURUSD touched strong support, so I think it will rise further, as shown.

SELL EURUSDIn todays session we are monitoring EURUSD for selling opportunity. Our entry is at 1.15814 and stops are above 1.16050. Our target is 1.15000. Use proper risk management and stay safe fam.
euro/usdtrade 5 as u can see from our last trade 5 its where we want it and the entry level is where my take profit is once it hits this mark asre be looking for a reaction agaist the red daily surport/resitance line and let it be used as a surport line to retrace and possibly make a new high but are aim would be just to test the highest high on the charts

EUR USD Price has previously rejected from the resistance zone in DTF, and Also traded in an ascending triangle and also formed a double top pattern and held d bearish Trendline, which are all indications of a Bearish trend and movement as seen.
And priced moved perfectly in our Direction 🔥
_THE_KLASSIC_TRADER_.

EUR/USD Set to Soar or Crash? Forecast for next weekEverything is simple, if price will drop i will be looking for longs in daily FVG
if price goes up till PWH i will expect move towards daily FVG
If you like this type of content follow and like
I am trying to make my analysis short and simple)

Opportunity for selling EURUSDI see that EURUSD has confirmed strong resistance, so I took a sell trade with it.

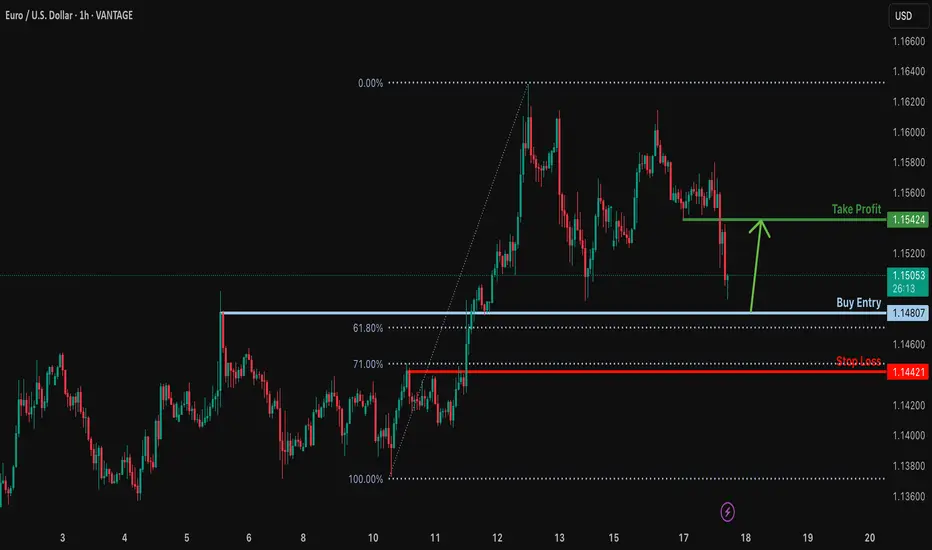
Bullish bounce?EUR/USD is falling towards the support level which is an overlap support that is slightly above the 61.8% Fibonacci retracement and could bounce from this level to our take profit.
Entry: 1.1480
Why we like it:
There is an overlap support that is slightly above the 61.8% Fibonacci retracement.
Stop loss: 1.1438
Why we like it:
There is a pullback support level that lines up with the 71% Fibonacci retracement.
Take profit: 1.1542
Why we like it:
There is a pullback resistance.
njoying your TradingView experience? Review us!
Please be advised that the information presented on TradingView is provided to Vantage (‘Vantage Global Limited’, ‘we’) by a third-party provider (‘Everest Fortune Group’). Please be reminded that you are solely responsible for the trading decisions on your account. There is a very high degree of risk involved in trading. Any information and/or content is intended entirely for research, educational and informational purposes only and does not constitute investment or consultation advice or investment strategy. The information is not tailored to the investment needs of any specific person and therefore does not involve a consideration of any of the investment objectives, financial situation or needs of any viewer that may receive it. Kindly also note that past performance is not a reliable indicator of future results. Actual results may differ materially from those anticipated in forward-looking or past performance statements. We assume no liability as to the accuracy or completeness of any of the information and/or content provided herein and the Company cannot be held responsible for any omission, mistake nor for any loss or damage including without limitation to any loss of profit which may arise from reliance on any information supplied by Everest Fortune Group.
Lingrid | EURUSD continuation Following Key Level BreakoutOANDA:EURUSD has completed a bullish breakout above the triangle pattern and is now consolidating above the key 1.14990 support level. The price structure shows a series of higher lows, with recent action forming a tight range just above trendline support. If bulls defend this area, a move toward the 1.17000 resistance becomes increasingly likely.
📈 Key Levels
Buy zone: 1.14990–1.15200
Sell trigger: break below 1.14800
Target: 1.17000
Buy trigger: break above 1.16000 with bullish volume
💡 Risks
Failure to hold 1.14990 could trigger a move toward 1.12100
DXY strength could suppress EUR upside
ECB or Fed policy shocks could increase volatility
Traders, if you liked this idea or if you have your own opinion about it, write in the comments. I will be glad 👩💻

EURUSD I Monday CLS I Model 1 I High risk I FOMC TomorowHey, Market Warriors, here is another outlook on this instrument
If you’ve been following me, you already know every setup you see is built around a CLS Footprint, a Key Level, Liquidity and a specific execution model.
If you haven't followed me yet, start now.
My trading system is completely mechanical — designed to remove emotions, opinions, and impulsive decisions. No messy diagonal lines. No random drawings. Just clarity, structure, and execution.
🧩 What is CLS?
CLS is real smart money — the combined power of major investment banks and central banks moving over 6.5 trillion dollars a day. Understanding their operations is key to markets.
✅ Understanding the behavior of CLS allows you to position yourself with the giants during the market manipulations — leading to buying lows and selling highs - cleaner entries, clearer exits, and consistent profits.
📍 Model 1
is right after the manipulation of the CLS candle when CIOD occurs, and we are targeting 50% of the CLS range. H4 CLS ranges supported by HTF go straight to the opposing range.
"Adapt what is useful, reject what is useless, and add what is specifically your own."
— David Perk aka Dave FX Hunter ⚔️
👍 Hit like if you find this analysis helpful, and don't hesitate to comment with your opinions, charts or any questions.

17.06.25 Morning ForecastPairs on Watch -
FX:EURUSD
FX:CADCHF
OANDA:XAUUSD
A short overview of the instruments I am looking at for today, multi-timeframe analysis down to what I will be looking at for an entry. Enjoy!

Euro / U.S. Dollar (EUR/USD) 4-Hour Chart - OANDA4-hour candlestick chart from OANDA displays the EUR/USD exchange rate trend from May 19 to June 26, 2025. The current rate is 1.15324, reflecting a 0.25% decrease (-0.00285) as of the latest update. The chart includes a technical analysis section with a green upward trend and a red downward trend, indicating potential price movements between 1.14264 and 1.15500. Key dates and price levels are marked along the x-axis and y-axis, respectively.

#EURUSD: Nothing to expect from DXY| View Changed Swing Trading|Hey there! So, we were previously thinking EURUSD was going to be bearish, but things have turned around and it’s looking bullish for now.
The extreme bearish pressure on USD has caused all the major USD pairs to be in a range. As the week goes on and we get the NFP data, the market will probably focus more on these economic indicators. So, it’s not surprising to see some market ranges during this time.
We’ll keep a close eye on the market, as there might be some manipulation going on this week.
We recommend waiting until Monday’s daily candle closes to see if the bullish trend is strong enough. Then, based on the price momentum, you can make your decisions.
We hope you have a great week and safe trading! If you like our work and analysis, please consider liking, commenting, and sharing our content.
Cheers,
Team Setupsfx
❤️🚀

EUR/USD Daily AnalysisBuyers are in charge of the market on the daily timeframe, however the MACD has printed a lower high when price has printed a higher high.
This is a potential sign of the buyers losing their strength and we may see some selling come in.
If you agree with the analysis, look for opportunities to trade that meet your own strategy rules and always use good risk management.

EURUSD: Weak Market & Bearish Forecast
Our strategy, polished by years of trial and error has helped us identify what seems to be a great trading opportunity and we are here to share it with you as the time is ripe for us to sell EURUSD.
Disclosure: I am part of Trade Nation's Influencer program and receive a monthly fee for using their TradingView charts in my analysis.
❤️ Please, support our work with like & comment! ❤️

EURUSDEUR/USD recently swept liquidity from the daily resistance zone near 1.1580, trapping buyers above the key psychological level of 1.1600. However, price action has shown a clear rejection from the supply area, indicating strong selling pressure.

Euro can turn around and start to fall to support areaHello traders, I want share with you my opinion about Euro. Observing this chart, we can see how the price earlier dropped toward the 1.1360 support level and successfully broke it. Then we saw a short recovery move, but the price once again returned to the downside and retested the support line from below. After that, the market created a strong upward impulse, broke back above the 1.1360 level, and entered a phase of consolidation inside a range. This range held for some time, with price respecting both its upper and lower boundaries. Eventually, we saw a breakout from this consolidation, followed by another strong bullish impulse and a steady climb above the 1.1530 zone, where price is currently trading. However, the price has now approached a critical structure and is showing signs of weakening momentum. In my mind, the Euro may attempt one more small move up but then turn around and start declining toward the 1.1530 support level, breaking the ascending support line as well. That's why my TP is this support level, which coincides with the support area. Please share this idea with your friends and click Boost 🚀
Disclaimer: As part of ThinkMarkets’ Influencer Program, I am sponsored to share and publish their charts in my analysis.
