EUR/USD CRAZZYY BULLISH BIAS (SMC Perspective) | 1H Outlook🔍 Analysis Summary:
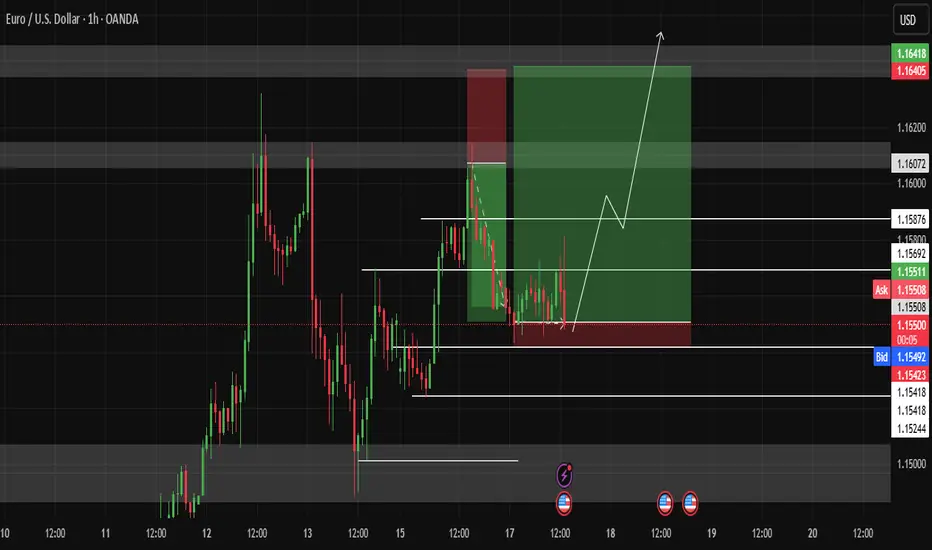
Price is consolidating above a clear demand zone after breaking previous structure to the upside.
We’ve seen liquidity engineered above the swing high (marked X), followed by internal structure developing.
I’m watching for a sweep into demand (grey zone) between 1.1520 – 1.1540, followed by a bullish reaction.
Expecting a bullish BOS (Break of Structure) on the lower timeframe to confirm continuation to 1.16340.
📌 Key Levels:
Demand Zone: 1.1520 – 1.1540
Liquidity Sweep: Above recent highs (1.1596)
Target Zone: 1.16340
Invalidation: Clean break below 1.1500
🗓️ Fundamental Drivers to Watch:
USD Weakness – Driven by:
Recent soft CPI & PPI data (cooling inflation)
Increased chances of Fed rate cuts (starting September 2025)
Risk-on market sentiment pushing money out of the USD
Upcoming News Events:
Wed 19 June – Fed Chair Powell Speaks 🗣️
→ Any dovish tone supports the bullish EUR/USD case
Thu 20 June – Initial Jobless Claims 📉
→ A higher-than-expected print could confirm labor market weakness = USD bearish
Fri 21 June – Flash Manufacturing/Services PMI (EUR & USD)
→ EUR strength + weak US data can fuel upside
🧠 My Plan:
Watch for a liquidity sweep into demand
Wait for bullish confirmation on M15 or M5
Target previous high & continuation toward 1.16340
💬 Follow for more SMC-based breakdowns. Let’s stay sharp and react, not predict.
#EURUSD #SMC #SmartMoney #LiquiditySweep #ForexTrading #OrderBlocks #sam_trades_smc #PriceAction #FOMC #Fed #USD
USDEUX trade ideas

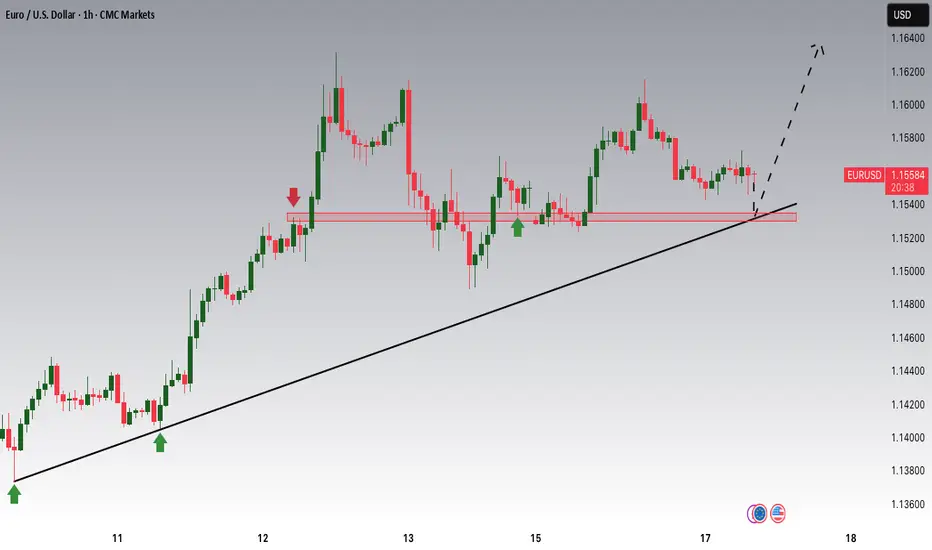
EURUSD: Awaiting Confirmation to Continue the UptrendThe EUR/USD pair closed yesterday at 1.1550, moving within the 1.1526–1.1558 range. The euro continues its bullish trend, driven by U.S. inflation data coming in lower than expected, which increases expectations of an upcoming rate cut by the Fed. In addition, geopolitical tensions in the Middle East—particularly between Israel and Iran—have slightly weakened the U.S. dollar, providing additional support to the euro.
From a technical perspective, the price is currently correcting toward the 1.1480 area, where the ascending trendline converges with the exponential moving average. This is a key support zone. If it holds and a clear bullish signal emerges, EURUSD could rebound and move toward the 1.1610 resistance level.
Main scenario: look for buying opportunities around 1.1480 if a bullish confirmation appears, targeting 1.1610.
Alternative scenario: if the 1.1480 level is broken, the short-term uptrend could be at risk.

EU buysI'm going for buys now on EU TARGETING 1.15818. Im bullish from an intraday perspective due to the liquidity resting to the upside and the overall trend.

Short trade on EURUSD. 17/06/2025Sell on EURUSD after confirmation of multiple touch at the DXY support level.

buying EURUSD (update) 1:10 RREURUSD touched strong support, so I think it will rise further, as shown.
EURUSD: Will Go Up! Long!
My dear friends,
Today we will analyse EURUSD together☺️
The market is at an inflection zone and price has now reached an area around 1.15524 where previous reversals or breakouts have occurred.And a price reaction that we are seeing on multiple timeframes here could signal the next move up so we can enter on confirmation, and target the next key level of 1.15663.Stop-loss is recommended beyond the inflection zone.
❤️Sending you lots of Love and Hugs❤️

EURUSD MARKERT ANAKYSIS AND PRICE PREDICTIONRenegotiation Resistance is the target!
stop loss 1.5449
Take profit 1.16299
Please manage your risk . Any analysis can fail due to market uncertainties1
GOODLUCK GUYS

EUR/USD SHORT FROM RESISTANCE
Hello, Friends!
We are now examining the EUR/USD pair and we can see that the pair is going up locally while also being in a uptrend on the 1W TF. But there is also a powerful signal from the BB upper band being nearby, indicating that the pair is overbought so we can go short from the resistance line above and a target at 1.143 level.
Disclosure: I am part of Trade Nation's Influencer program and receive a monthly fee for using their TradingView charts in my analysis.
✅LIKE AND COMMENT MY IDEAS✅

EURUSD Coiling pattern, energy build up support at 1.1520EUR/USD Technical Analysis
Trend Overview:
EUR/USD continues to exhibit bullish price action, supported by a rising trend structure. The recent intraday movement shows signs of sideways consolidation, suggesting a potential continuation pattern rather than reversal.
Key Support Level:
1.1520 – Marks the lower boundary of the previous consolidation range and serves as a critical pivot for directional bias.
Bullish Scenario (Primary Bias):
A corrective pullback into the 1.1520 zone followed by a bullish reversal would confirm continued upward momentum.
Upside targets include:
1.1664 – Near-term resistance.
1.1723 – Mid-term target.
1.1780 – Long-term resistance aligned with prior highs.
Bearish Scenario (Invalidation):
A decisive break and daily close below 1.1520 would invalidate the current bullish outlook.
This would signal a shift toward a deeper correction, targeting:
1.1460 – Initial retracement level.
1.1345 – Major support zone on a broader timeframe.
Conclusion:
The broader trend in EUR/USD remains bullish, with the 1.1520 level acting as a key support threshold. A bounce from this level would support continued upside movement toward 1.1780. However, a confirmed break below 1.1520 would shift momentum to the downside and expose the pair to a deeper retracement.
This communication is for informational purposes only and should not be viewed as any form of recommendation as to a particular course of action or as investment advice. It is not intended as an offer or solicitation for the purchase or sale of any financial instrument or as an official confirmation of any transaction. Opinions, estimates and assumptions expressed herein are made as of the date of this communication and are subject to change without notice. This communication has been prepared based upon information, including market prices, data and other information, believed to be reliable; however, Trade Nation does not warrant its completeness or accuracy. All market prices and market data contained in or attached to this communication are indicative and subject to change without notice.

The Day Ahead Tuesday, June 17 – Market Summary (Key Data & Events)
U.S. Focus:
Retail Sales (May) – Key consumer demand gauge; strong data may lift USD and yields.
Industrial Production, Capacity Utilization (May) – Insight into manufacturing health; impacts USD, rates.
Import/Export Price Index (May) – Inflation clues; affects Fed expectations.
NAHB Housing Index (June) – Early read on housing sentiment.
NY Fed Services Index, Business Inventories (April) – Lower-tier data.
5-Year TIPS Auction – Watch for inflation expectations via demand.
Global Data:
Germany & Eurozone ZEW Surveys (June) – Investor sentiment; EUR-sensitive.
Canada International Securities Transactions (April) – Tracks foreign capital flows; affects CAD.
Central Banks:
BoJ Decision – High impact for JPY, JGBs, and Nikkei; watch policy tone.
ECB Speakers (Villeroy, Centeno) – May guide rate expectations and EUR.
Trading Relevance:
FX: USD, JPY, EUR in focus.
Equities: Retail data, BoJ stance may drive risk appetite.
Rates: Data-heavy day for yields; TIPS auction key for inflation outlook.
Commodities: Industrial activity and prices affect demand/inflation views.
This communication is for informational purposes only and should not be viewed as any form of recommendation as to a particular course of action or as investment advice. It is not intended as an offer or solicitation for the purchase or sale of any financial instrument or as an official confirmation of any transaction. Opinions, estimates and assumptions expressed herein are made as of the date of this communication and are subject to change without notice. This communication has been prepared based upon information, including market prices, data and other information, believed to be reliable; however, Trade Nation does not warrant its completeness or accuracy. All market prices and market data contained in or attached to this communication are indicative and subject to change without notice.

EUR/USD Poised for a Breakout? Watch 1.1510 CloselyEUR/USD is currently consolidating around the 1.1510 support zone after a mild pullback from the descending trendline. Price structure remains bullish, with a wedge pattern forming — signaling that a breakout could be imminent.
On the news front, expectations that the Fed may soon begin cutting rates — following a series of weak U.S. economic data — are weighing on the U.S. dollar. At the same time, easing geopolitical tensions are shifting market sentiment back toward risk assets.
If the 1.1510 support level holds firm, EUR/USD may stage a strong rebound to resume its upward momentum.

EUR/USD) back to bearish Trand Read The captionSMC trading point update
Technical analysis of EUR/USD pair on the 2-hour timeframe. Here's a breakdown of the idea behind the analysis:
---
Trading Idea Summary: EUR/USD Bearish Reversal Setup
1. Rejection at Resistance Zone
Resistance Level (~1.1600): Price has tested this level twice (red arrows) and faced strong rejection, suggesting it’s a firm supply zone.
This double top near resistance signals potential downside pressure.
2. Bearish Market Structure
Price action shows a break in short-term bullish momentum.
Bearish trend arrows and structure indicate expected continuation to the downside.
3. EMA Resistance
The 200 EMA (blue line) at 1.14356 is above the key support zone, acting as dynamic resistance, reinforcing the bearish outlook.
4. Target Levels
First Target: 1.13694 (Key Support Level)
Previous structure zone with strong historical price reaction.
Final Target: 1.12025 (Major Support Zone)
Larger demand area where buyers previously stepped in.
Mr SMC Trading point
---
Conclusion
This analysis suggests a potential short setup with confirmations from:
Repeated resistance rejection
Bearish price structure and trend arrows
EMA as added confluence
Clear downside targets: 1.13694, then 1.12025
> Bearish bias remains valid unless price reclaims and closes above the resistance zone (~1.1600).
pelas support boost 🚀 this analysis)

EURUSD Potential UpsidesHey Traders, in today's trading session we are monitoring EURUSD for a buying opportunity around 1.15300 zone, EURUSD is trading in an uptrend and currently is in a correction phase in which it is approaching the trend at 1.15300 support and resistance area.
Trade safe, Joe.
EURUSD Downtrend SignalI am looking at a downtrend on EURUSD after the double top on the 4hr.
the Monthly Core Retail sales will give continual strength to USD, perfecting the down slide as expected throughout the week.
Follow, Like and Share for more trade signals

EURUSD – Healthy pullback within a strong uptrendEURUSD is undergoing a temporary correction after a strong bullish move, but the pair remains above key technical support levels such as the EMA34 and the ascending trendline. The 1.15070 zone now acts as a potential buy area—where demand may return if confirmation signals appear.
Market sentiment is leaning toward the expectation that the Fed may cut interest rates soon due to weaker-than-expected U.S. retail sales data, which has weighed on the USD and indirectly supported the euro. Meanwhile, the ECB continues to maintain a stable policy stance, further reinforcing the current bullish trend.
If the price holds above the green support zone, the next target could be around 1.15940. If this support breaks, traders should watch price behavior at the trendline before making the next trading decision.

EUR/USD - Potential Targets ( Correction ? )Dear Friends in Trading,
How I see it,
Key Confluence - NOW SUPPORT @ 1.15700
Potential correction below key support
"SHORT" Targets:
1] 1.15130
2] 1.14900
3] 1.14700
I sincerely hope my point of view offers a valued insight.
Thank you for taking the time to study my analysis.

EUR/USD – 30m | Smart Money long SetupPair: EUR/USD
🔹 Timeframe: 30-Minutes
🔹 Confluence Strategy: Elliott Wave + Smart Money Concepts (SMC)
🔹 Pattern: Ending Triangle (Wave e) + CHoCH + BOS
🔹 Published on: June 17, 2025
---
🧠 Analysis Summary:
1. Wave (e) of triangle nearly complete — signs of liquidity grab at the low.
2. CHoCH formed after internal structure break – a bullish signal.
3. Demand zone successfully mitigated, showing buyer reaction.
4. BOS confirms intent to shift bullish structure.
5. Clear imbalance/fair value gap filled before move.
---
🎯 Next Move Projection:
Entry Zone: 1.1562–1.1565 (Demand Area)
Target: 1.1596–1.1600 (Supply Zone Resistance)
Invalidation: Clean break below 1.1555 low (demand fails)
---
📌 Trade Bias:
✔️ Bullish — Expecting price to tap into supply zone and potentially reverse.
⚠️ Monitor lower timeframes (5m–15m) for rejection signs near 1.1600.

EUR/USD Triangle Pattern – 1H Timeframe
📊 EUR/USD Triangle Pattern – 1H Timeframe
🕐 Date: 17 June 2025
📌 Chart by: GreenfireForex
🔷 Pattern: Contracting Triangle (ABCDE)
🔍 Context: Forming inside Wave (4) – possible breakout before Wave (5)
📈 Upside Potential: Break above triangle → target near 1.16500+
📉 Downside Risk: If fails to break up → revisit demand zone around 1.15000
---
🔮 Possible Scenarios:
✅ Bullish Breakout:
Breaks above wave (e)
Clean rally toward target zone
Ideal for a long setup with tight SL
❌ Bearish Fakeout:
Rejection from triangle resistance
Falls back into demand zone
Look for reversal or retest opportunities
---
🎯 Strategy Tips:
Wait for a breakout candle
Use SL outside triangle zone
Entry based on confirmation – avoid early trades
💬 Let’s discuss live market reaction as price nears triangle edge. Stay ready .

EURUSD SHORT FORECAST Q2 W25 D17 Y25EURUSD SHORT FORECAST Q2 W25 D17 Y25
Professional Risk Managers👋
Welcome back to another FRGNT chart update📈
Diving into some Forex setups using predominantly higher time frame order blocks alongside confirmation breaks of structure.
Let’s see what price action is telling us today!
💡Here are some trade confluences📝
✅Weekly order block rejection
✅15' order block
✅4 hour order block identified
✅Tokyo ranges to be filled
🔑 Remember, to participate in trading comes always with a degree of risk, therefore as professional risk managers it remains vital that we stick to our risk management plan as well as our trading strategies.
📈The rest, we leave to the balance of probabilities.
💡Fail to plan. Plan to fail.
🏆It has always been that simple.
❤️Good luck with your trading journey, I shall see you at the very top.
🎯Trade consistent, FRGNT X

Market Review ( DXY & GOLD & EQUITIES & CURRENCIES ) 2025-06-17DXY:
Prediction: Continued bearish pressure, targeting your swing target of 95.00. The fundamental backdrop of potential Fed rate cuts and ongoing geopolitical uncertainty weighing on safe-haven demand for the dollar supports this outlook.
Recommendation: SELL on rallies. Traders should look for opportunities to short the DXY, utilizing resistance levels around 98.50-99.00 for entry. Long-term investors should consider reducing USD exposure in their portfolios.
GOLD:
Prediction: Strong bullish momentum to continue, with a high probability of reaching and exceeding your swing target of 3600. The confluence of safe-haven demand and a weakening dollar provides a powerful tailwind.
Recommendation: BUY on dips. Swing traders can look for pullbacks to key support levels for entry, while long-term investors should consider accumulating gold as a hedge against market volatility and currency depreciation.

EURUSD - Price actionPrice action on the EURUSD
A is impulsive
B is corrective
C is impulsive
Start and end with impulsive action, and then the next leg should be impulsive down

EURUSD longAfter a fundamental analysis of the dollar. The EURUSD market is in an uptrend and the market respected a support level further confirming the move to the upside

EURUSD awaits upcoming newsYesterday, EURUSD climbed back above 1,1600, testing the previous high.
Tomorrow, the market is anticipating the FED’s interest rate decision.
For now, the trend remains clear, with expectations of increased volatility.
Keep an eye out for a higher low and a breakout above the previous high.
