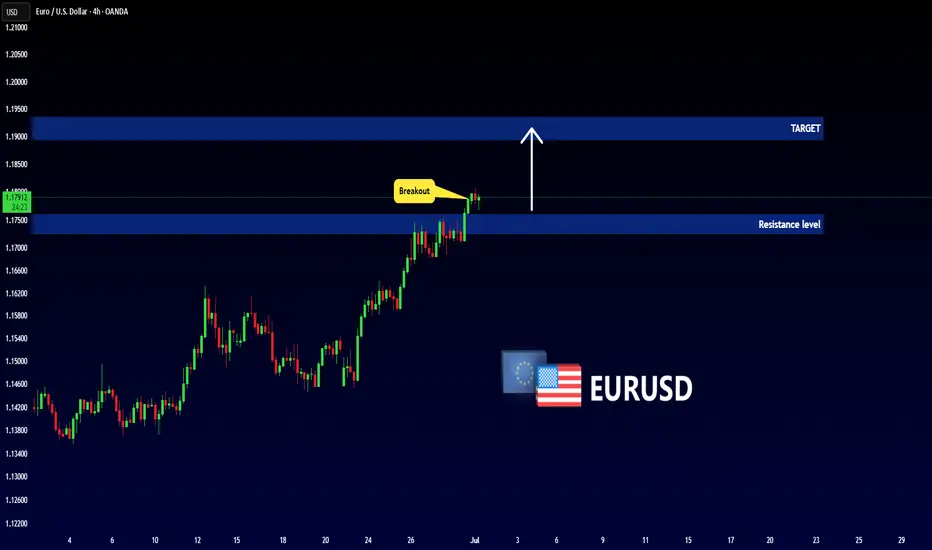
EURUSD - Important Breakout !Hello Traders !
The EURUSD price broke the resistance level (1.17255 - 1.17602).
This key level becomes new support!
So, I expect a bullish move🚀
________________
TARGET: 1.18950🎯
USDEUX trade ideas
RSI Flashes Warning on EURUSD: Critical Level Under Watch!Good morning traders,
If the EURUSD pair breaks below the 1.16729 level due to an RSI divergence, the next potential target could be around 1.16093.
Keep in mind that a break below 1.16729 may also signal a potential trend reversal.
I've marked the pivot points for you on the chart for better clarity.
Additionally, it's crucial to keep an eye on current economic data and news releases as part of your fundamental analysis.
I meticulously prepare these analyses for you, and I sincerely appreciate your support through likes. Every like from you is my biggest motivation to continue sharing my analyses.
I’m truly grateful for each of you—love to all my followers💙💙💙

Eurusd Reaching physiological level of 1.17200 clear break and retest on the 2hr and 1hr , entering a counter trade to 1.16190

EUR/USD Short Idea Analysis EUR/USD exhibits bearish potential on the daily timeframe, with the 1.17160–1.18070 zone acting as a key resistance area for a short setup.
Technical Analysis:
Price Action: Price is testing the 1.17160–1.18070 resistance zone, which aligns with prior highs and a rejection area. A bearish reversal pattern (e.g., shooting star or engulfing) could confirm the short.
Support/Target: Initial support at 1.1600, with a deeper target at 1.1500 if selling pressure accelerates.
Indicators: RSI is nearing overbought levels (above 65), suggesting a potential reversal. MACD shows weakening bullish momentum, supporting a bearish bias.
Fibonacci: The 1.17160–1.18070 zone aligns with the 78.6% Fibonacci retracement of the prior downmove, reinforcing resistance.
Risks: A break above 1.1820 could invalidate the setup. Watch for ECB policy updates or unexpected US data shifts.
Conclusion: The 1.17160–1.18070 resistance zone offers a compelling short opportunity for EUR/USD, backed by technical and fundamental factors. Use tight risk management due to potential volatility.

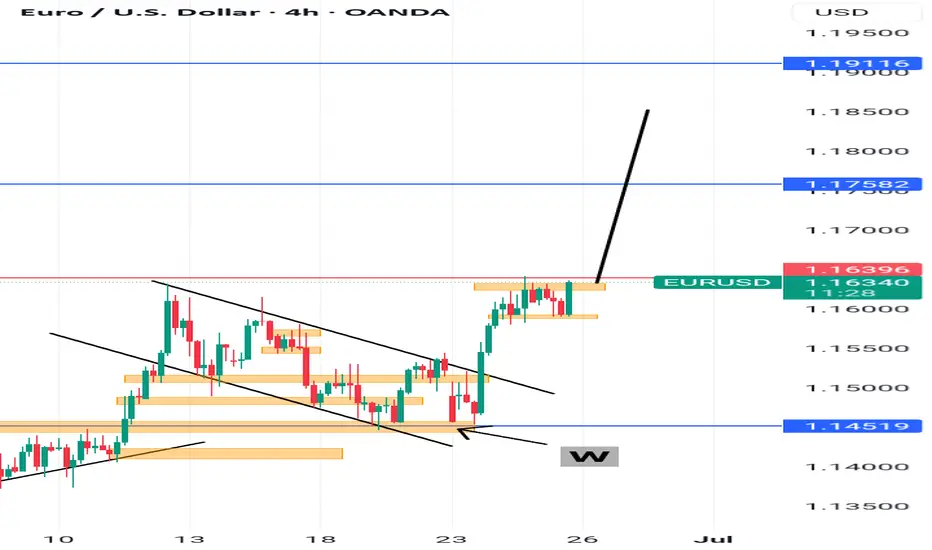
EUR/USD Holds Above Support – Watching 1.17400 and BeyondHi Everyone,
As highlighted, a successful bounce from the near-term support at 1.16680 provided a retest of the 1.17400 zone. Looking ahead, we expect price action to revisit this level in the coming week.
A confirmed break above this resistance could open the path toward 1.18000, where we anticipate encountering dynamic resistance.
As outlined in our analysis last week, we anticipated a continued move higher toward the 1.16564 and 1.18325 levels, provided price held above 1.14483.
Price respected this level, and EUR/USD extended its rally, reaching our first key target at 1.16564 and pushing above 1.17400 — marking the highest level since February 2022.
We will provide further updates on the projected path for EUR/USD should price reach this level.
The longer-term outlook remains bullish, with expectations for the rally to extend toward the 1.2000 level, provided the price holds above the key support at 1.10649.
We will continue to update you throughout the week with how we’re managing our active ideas and positions. Thanks again for all the likes/boosts, comments and follows — we appreciate the support!
All the best for a good end to the week. Trade safe.
BluetonaFX

EURUSD SHORT TERM SELLOn the M15 price has given a CHOCH
Waiting patiently for a BOS to occur to ride price down to demand.
Proper risk management is advised
Keep an eye on TVC:DXY
Happy trading week.

Elliott Wave Analysis for EUR/USD - Bullish OutlookPEPPERSTONE:EURUSD
This analysis is based on the application of Elliott Wave principles for the EUR/USD market on a weekly timeframe.
💡 Wave Identification:
Corrective Cycle (ABC): After a peak marked by wave B, the market completed a 5-wave downward structure (waves 1 to 5), forming wave C, signaling a possible end of the correction.
Potential Reversal Zone (2/B): The current point is a strategic level where a bullish rebound is anticipated.
📊 Projection:
A bullish impulse is expected from point C. The initial target lies in the 1.1140 - 1.1217 zone, corresponding to key resistance levels and Fibonacci projections.
🧠 Conclusion:
A breakout above 1.0440 could confirm a significant bullish impulse, suggesting buyers are regaining control.
⚠️ Disclaimer : This analysis is not financial advice. Always conduct your own research before investing.

EURUSD..BUYAnalysis complete — scenarios outlined. The zone could be a decision point for . Price reaction here may define the next move.
If price breaks and pulls back to retest, a reversal setup might emerge.

EurUsd Scenario.This how i see eurusd for now .. Indeed Dxy is going Uppp !! While E/U is heading down .
I will see how it goes .
Hapii Trade'ing

EURUSD: Next Move Is Down! Short!
My dear friends,
Today we will analyse EURUSD together☺️
The in-trend continuation seems likely as the current long-term trend appears to be strong, and price is holding below a key level of 1.17021 So a bearish continuation seems plausible, targeting the next low. We should enter on confirmation, and place a stop-loss beyond the recent swing level.
❤️Sending you lots of Love and Hugs❤️

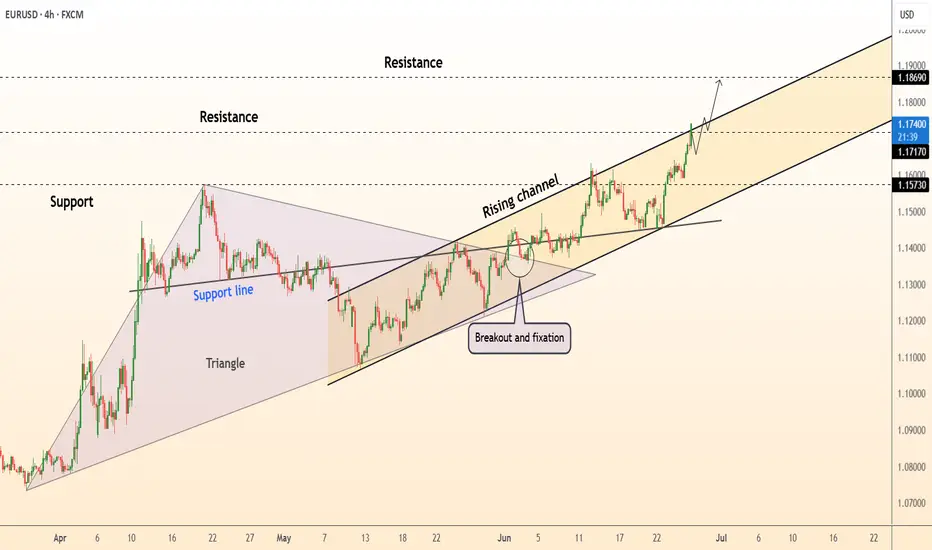
DeGRAM | EURUSD will continue to grow rapidly📊 Technical Analysis
● Euro keeps hugging the upper rail of the 3-month rising channel after re-testing the broken April triangle top as support, confirming fresh trend acceleration.
● Momentum is unbroken – every 4 h pullback since 17 Jun has held above the inner trend-line (now 1.1717); measured channel height points to the next fib / horizontal cluster at 1.1869.
💡 Fundamental Analysis
● Softer US durable-goods orders and slowing housing data cooled 2-yr yields, while ECB speakers signalled no rush to ease again; the short-rate gap narrowed for a third session, underpinning EUR strength.
✨ Summary
Buy dips ≥1.1717; upside targets 1.1800 then 1.1869. Bull view void on a 4 h close below 1.1600.
-------------------
Share your opinion in the comments and support the idea with a like. Thanks for your support
EUR_USD BULLISH BREAKOUT|LONG|
✅EUR_USD is going up
Now and the pair made a bullish
Breakout of the key horizontal
Level of 1.1630 and the breakout
Is confirmed so we are bullish
Biased and we will be expecting
A further bullish move up
LONG🚀
✅Like and subscribe to never miss a new idea!✅
Disclosure: I am part of Trade Nation's Influencer program and receive a monthly fee for using their TradingView charts in my analysis.

EURUSDShorting EUR/USD means you expect the euro to weaken against the U.S. dollar. In other words, you believe the dollar will gain strength or the euro will lose value — or both.
Reasons traders might short EUR/USD:
• The U.S. economy is performing better than the eurozone.
• Interest rates are rising faster in the U.S. than in Europe.
• Political or economic instability in the eurozone.
• Investors seeking safety in the dollar during global uncertainty.
How it works:
You sell the pair (EUR/USD) first, aiming to buy it back later at a lower price — profiting from the drop in the euro’s value versus the dollar.


EURUSD Jun 26 The information and publications are not meant to be, and do not constitute, financial, investment, trading, or other types of advice or recommendations.
Have a nice day ahead.

Bullish moveEurusd had a consolidation phase or a bullish flag and there is already a breakout to the upside.
You can be aggressive and enter or wait for a retest and then enter
EUR/USD Weekly Technical Analysis – Testing Major Resistance📊 EUR/USD Weekly Technical Analysis – Testing Major Resistance 🔥📈
The EUR/USD pair is exhibiting a strong bullish momentum on the weekly timeframe, currently trading at 1.16562, and fast approaching a key resistance zone.
🔵 Key Observations:
📌 Resistance Zone:
Blue shaded area between ~1.16500 - 1.19000 is a major resistance level, historically tested in mid-2021.
A breakout above this zone could trigger a long-term bullish reversal toward 1.22793 (next major resistance marked by red arrow 🔴).
📌 Support Levels (Yellow Lines):
1.12821 🟡 – Previous minor resistance, could act as immediate support.
1.10543 🟡 – Key support from consolidation zone.
1.06775 & 1.04733 🟡 – Strong support levels during 2023-2024.
1.02063 & 0.96960 🟡 – Long-term base zones (2022 lows), showing double bottom formation (green arrows 🟢).
📌 Structure:
Formation of higher lows and higher highs, indicating bullish structure.
Recent breakout above consolidation range confirms momentum strength.
📌 Indicators (Bottom Right):
Suggest volatility and possible impact of economic or geopolitical events. ⚠️📅📌
⚠️ What to Watch For:
Rejection from Resistance could trigger a correction toward 1.12821 or lower.
Breakout above Resistance would expose 1.19000 → then 1.22793 (major target 🎯).
Weekly Close Above Resistance will be crucial to confirm the breakout.
📈 Bias: Bullish (Short to Mid-Term)
🧠 Strategy Tip: Traders may look for bullish continuation on breakout and retest above resistance, or short-term pullback entries around support if rejection occurs.

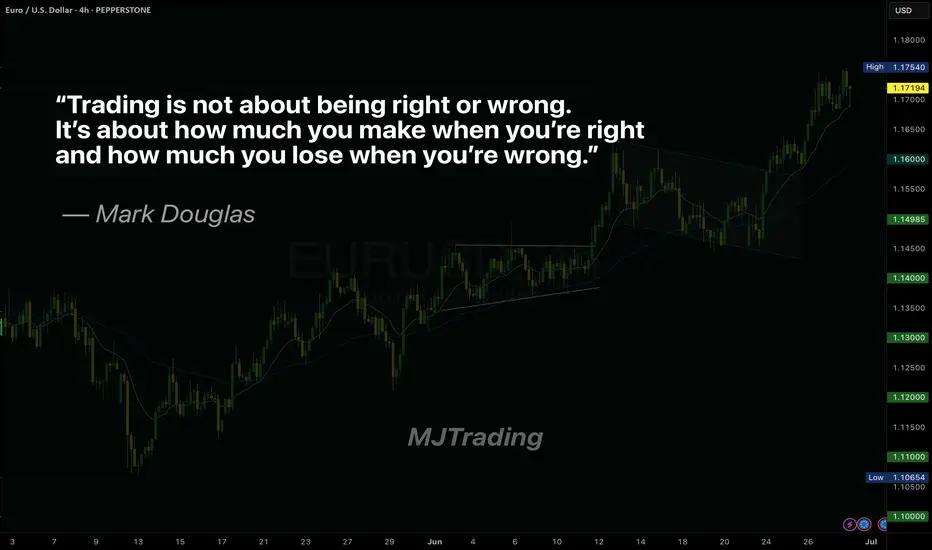
Master Your Edge: It’s Not About Just Being Right
Most traders obsess over being right on every trade. But the truth is, consistent profitability doesn’t come from perfect predictions—it comes from disciplined risk management.
Mark Douglas reminds us:
“Trading is not about being right or wrong. It’s about how much you make when you’re right and how much you lose when you’re wrong.”
Focus less on proving yourself right, and more on protecting your capital when you’re wrong. That’s how professionals thrive in uncertain markets.
#MJTrading
#TradingPsychology #MarkDouglas #ForexMindset #TraderMindset #EURUSD #TradingQuotes #ForexLife #RiskManagement #TradingDiscipline #ForexEducation #ChartOfTheDay #PriceAction #MindOverMarkets
EURUSD Bullish continuation supported at 1.1640The EURUSD currency pair continues to exhibit a bullish price action bias, supported by a sustained rising trend. Recent intraday movement reflects a sideways consolidation breakout, suggesting potential continuation of the broader uptrend.
Key Technical Level: 1.1640
This level marks the prior consolidation range and now acts as pivotal support. A corrective pullback toward 1.1640 followed by a bullish rejection would reinforce the bullish trend, targeting the next resistance levels at:
1.1830 – Near-term resistance
1.1900 – Minor swing high
1.1940 – Longer-term bullish objective
On the other hand, a decisive daily close below 1.1640 would invalidate the bullish setup, shifting the outlook to bearish in the short term. This could trigger a deeper retracement toward:
1.1590 – Initial support
1.1530 – Key downside target
Conclusion:
As long as 1.1640 holds as support, the technical outlook remains bullish, favoring long positions on dips. A confirmed break below this level would signal a shift in sentiment and open the door to a corrective pullback phase.
This communication is for informational purposes only and should not be viewed as any form of recommendation as to a particular course of action or as investment advice. It is not intended as an offer or solicitation for the purchase or sale of any financial instrument or as an official confirmation of any transaction. Opinions, estimates and assumptions expressed herein are made as of the date of this communication and are subject to change without notice. This communication has been prepared based upon information, including market prices, data and other information, believed to be reliable; however, Trade Nation does not warrant its completeness or accuracy. All market prices and market data contained in or attached to this communication are indicative and subject to change without notice.

More upside for EUHi traders,
Last week EU started with a gap down. After the fill it swept the lows and after that it made the next impulsive wave up.
So next week after the finish of the correction down we could see more upside.
Let's see what the market does and react.
Trade idea: Wait for the finish of the correction down and a change in orderflow to bullish on a lower time frame. After a small correction down you could trade longs again.
If you want to learn more about trading with FVG's, liquidity sweeps and Wave analysis, then make sure to follow me.
This shared post is only my point of view on what could be the next move in this pair based on my technical analysis.
Don't be emotional, just trade your plan!
Eduwave

Do you think ill hit my TP?What do you guys think will I hit my TP at 1.17544. I set up a buy for 1.17389 but not sure if ill keep it there, just depends.

EURUSD ( AB Algorithm Setup) 30.06.2025 - 04.07.2025 While everyone is waiting for a pullback or a downward correction, or expecting this aggressive trend to break and lead to a sharp drop, the market will continue to rise. Because a trend is sustained by those who don't believe in it

SMC Entry Models Cheatsheet✅ Smart Money Concepts & Liquidity Checklist
1. Market Structure
🔹 Identify HTF Trend (H4 or H1): bullish, bearish, or range
🔹 Confirm Break of Structure (BOS) or Change of Character (CHoCH) on M15–M5
🔹 Look for lower highs/lows (downtrend) or higher highs/lows (uptrend)
2. Liquidity Zones
🔹 Look for equal highs/lows (liquidity pools)
🔹 Asian highs/lows — common targets during London/NY session
🔹 Recent internal range liquidity
🔹 Trendline liquidity — fakeouts often occur here
3. Premium & Discount Zones (PD Arrays)
🔹 Use Fibonacci from recent swing high to low
🔹 Look for entries at Discount (Longs) or Premium (Shorts) pricing
🔹 Ideal entries happen between 0.62–0.79 retracement
4. Supply & Demand Zones
🔹 Find fresh OBs (Order Blocks) that caused a break of structure
🔹 Use last bullish candle before strong drop (for short) or last bearish candle before strong rally (for long)
🔹 Confirm zone isn’t mitigated yet
5. Imbalance / Fair Value Gaps (FVG)
🔹 Identify large imbalanced candles (no wick overlap)
🔹 Ideal entries are inside the FVG aligned with direction
🔹 High probability if FVG is within OB or confluence with structure/liquidity
6. Confluences for Entry
🔹 Entry aligns with liquidity sweep or FVG/OB tap
🔹 Volume spike or rejection wick confirms interest
🔹 RSI divergence or exhaustion = bonus confirmation
🔹 Use M1/M5 for entry trigger after setup is formed on M15–H1
7. Entry Trigger
🔹 CHoCH or BOS on lower timeframe (M1-M5)
🔹 Confirmation with engulfing candle, FVG fill, or break/retest
🔹 SL below/above recent swing or OB boundary
8. TP/Exit Zones
🔹 TP1: After BOS/structure shift + partial
🔹 TP2: Next liquidity level (equal high/low or OB)
🔹 TP3: Opposite OB or major FVG
🔹 Adjust SL to breakeven after reaching TP1
9. Session Timing (Important)
🔹 Asian range → look for liquidity setup
🔹 London Open (3PM–6PM PH))→ manipulative move (liquidity grab)
🔹 NY Open (8PM–11PM PH) → continuation or reversal opportunity
🔹 Avoid high-impact news releases unless breakout
🔹 Use Forex Factory / MyFXBook for news calendar
10. Post-Trade Journaling:
🔹Screenshot HTF → LTF Setup (H4 > M15 > M1)
🔹Don’t skip journaling — it’s your #1 improvement tool.
