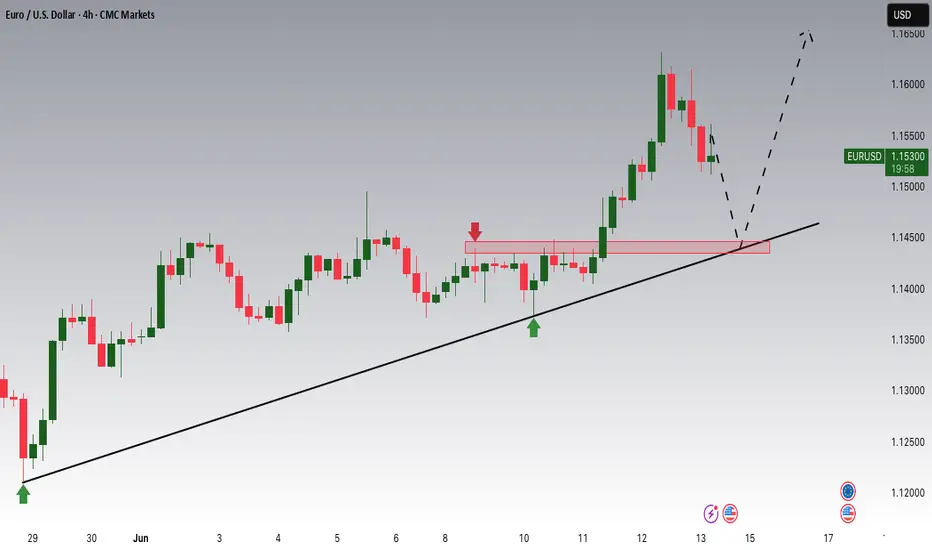
Bullish Trend Continuation I’m expecting a bullish continuation after price mitigates the newly formed 4H demand zone. The zone was created after a strong impulsive move, and I’ll be looking for LTF confirmation to go long, targeting the recent 4H high and daily liquidity above. Invalidation is a clean break below the zone.
USDEUX trade ideas

London Session - Sell Idea on EUWe see price entering a 4hr & 1hr engulfing candle stick. Price is also beginning to downtrend on the 1hr time frame. I've adjusted my trading time to early morning on the east coast. I'm noticing I'm more productive. My original wakeup time is 3:33am but I woke up at 4:44am this Am. I felt rushed to keep going but I'm not trying to hard, I will set alerts as price enters our zone, I'm expecting price to trigger before 7am. Then break our CTL. Easily 1:3 risk to reward.
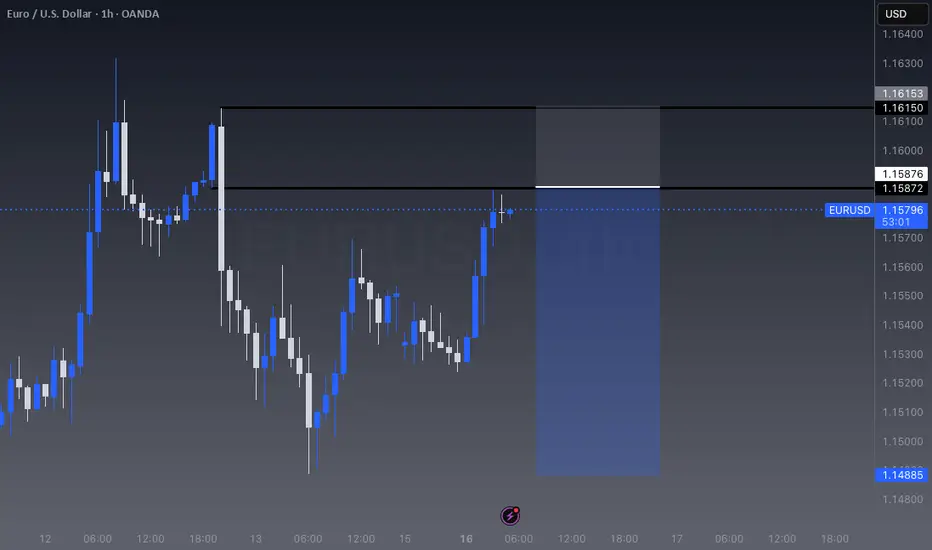
EURUSD June 16 Trade ExecutedEURUSD
June 16 Trade Executed
Parent Bias Bull
Fridays delivery to build a narrative for Monday
*Asia to London price expanded to seek lowwr prices take sell side liquidity in London
*Note Friday was a reversal of Thursday
*Prices expansion wicks to equilibrium
*Reversed to take minor buy side in NY AM
*NY PM Retraced AM rally
*NY closes in a FVG-Note bodies staying above the CE of the FVG
June 16 Framework for suspected buy day
*Asia opened in a premium previous session
*I was expecting a long consolidation after Sundays delivery
*
*Equal lows as a target to trigger a expansion coming into mid night opening
*22:00 price wicks to create a wall of equal lows
*23:15 Price takes minor buy side liquidity
*20:00 price immediately expanded
*20:09 entered
*First target buy stops 1.15693
*Second target 1.15848
Took partials here and now letting it ride.
Patience waiting for clues to the bias I was suspecting. Buying the mid night opening price with the bias is allowing me to get in when I suspect a expansion cycle is in play.
Asia expansion trade for the win.

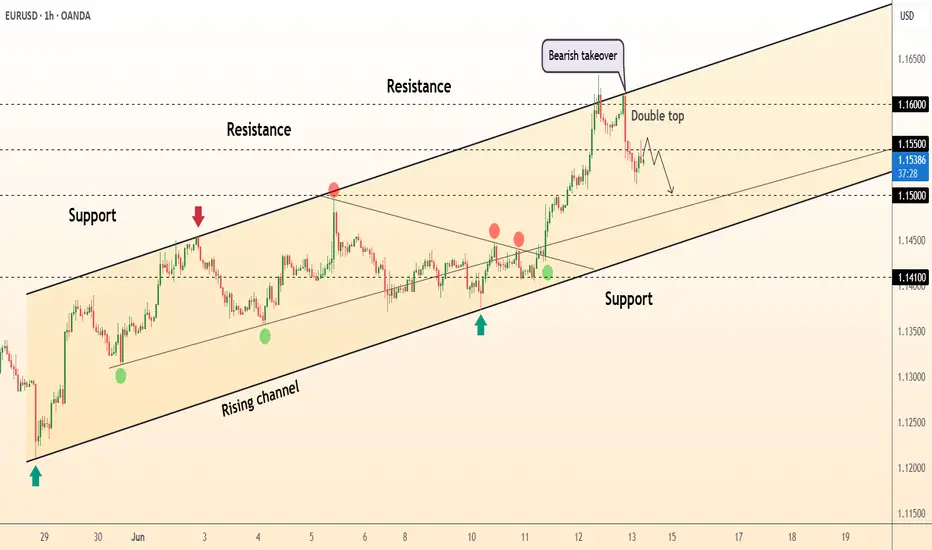
DeGRAM | EURUSD formed the double top📊 Technical Analysis
● A double-top printed at the channel roof (≈ 1.1600) and a bearish engulfing candle signal exhaustion; price is slipping back inside last week’s inner trend-median, turning 1.1550 into fresh resistance.
● Hourly RSI diverged lower and the grey return line from 1 June has broken; pattern depth points to 1.1500 support, with the channel mid-band / former triangle apex near 1.1470 as the next magnet.
💡 Fundamental Analysis
● Post-CPI profit-taking meets cautious ECB rhetoric: Lagarde reiterated “no preset easing path,” yet money-markets still price two Fed cuts by year-end, inviting near-term dollar reprieve.
✨ Summary
Short 1.1540-1.1560; break below 1.1520 targets 1.1500 → 1.1470. Bear view void on an H1 close above 1.1600.
-------------------
Share your opinion in the comments and support the idea with like. Thanks for your support!
EURUSD-SELL strategy 3D chart GANNThe pressure is still upwards, but overall we are close to a reversal considering the ascending triangle, the Hammer Top and overbought RSI. We may still see 1.1650-1.1700 area before the correction, but feel we slowly should scale into a SELL mode.
Strategy SELL @ 1.1625-1.1675 and take profit near 1.1250 area.

EURUSD - ShortLooking at shorts on EURUSD. Big chance that we'll take out the daily high before entering lower.

The best indicator //@version=5
strategy("EMA-RSI-Bollinger Strategy", overlay=true, default_qty_type=strategy.percent_of_equity, default_qty_value=10)
// === Indicatori ===
ema20 = ta.ema(close, 20)
ema50 = ta.ema(close, 50)
rsi = ta.rsi(close, 14)
basis = ta.sma(close, 20)
dev = 2 * ta.stdev(close, 20)
upperBB = basis + dev
lowerBB = basis - dev
// === Condiții pentru Buy ===
longTrend = ema20 > ema50
longPullback = close <= ema20 and close <= lowerBB
longRSI = rsi < 50 and rsi > 30
longSignal = longTrend and longPullback and longRSI
// === Condiții pentru Sell ===
shortTrend = ema20 < ema50
shortPullback = close >= ema20 and close >= upperBB
shortRSI = rsi > 50 and rsi < 70
shortSignal = shortTrend and shortPullback and shortRSI
// === Semnale & Tranzacții ===
if (longSignal)
strategy.entry("Buy", strategy.long)
if (shortSignal)
strategy.entry("Sell", strat

EURUSD SHORT FORECAST Q2 W25 D16 Y25EURUSD SHORT FORECAST Q2 W25 D16 Y25
Professional Risk Managers👋
Welcome back to another FRGNT chart update📈
Diving into some Forex setups using predominantly higher time frame order blocks alongside confirmation breaks of structure.
Let’s see what price action is telling us today!
💡Here are some trade confluences📝
✅Weekly order block
✅15' order block
✅1 hour order block
✅Tokyo ranges to be filled
🔑 Remember, to participate in trading comes always with a degree of risk, therefore as professional risk managers it remains vital that we stick to our risk management plan as well as our trading strategies.
📈The rest, we leave to the balance of probabilities.
💡Fail to plan. Plan to fail.
🏆It has always been that simple.
❤️Good luck with your trading journey, I shall see you at the very top.
🎯Trade consistent, FRGNT X

Bullish continuation?The Fiber (EUR/USD) is falling towards the pivot which acts as a pullback support and could bounce to the 1st resistance that lines up with the 127.2% Fibonacci resistance.
Pivot: 1.1447
1st Support: 1.1210
1st Resistance: 1.1712
Risk Warning:
Trading Forex and CFDs carries a high level of risk to your capital and you should only trade with money you can afford to lose. Trading Forex and CFDs may not be suitable for all investors, so please ensure that you fully understand the risks involved and seek independent advice if necessary.
Disclaimer:
The above opinions given constitute general market commentary, and do not constitute the opinion or advice of IC Markets or any form of personal or investment advice.
Any opinions, news, research, analyses, prices, other information, or links to third-party sites contained on this website are provided on an "as-is" basis, are intended only to be informative, is not an advice nor a recommendation, nor research, or a record of our trading prices, or an offer of, or solicitation for a transaction in any financial instrument and thus should not be treated as such. The information provided does not involve any specific investment objectives, financial situation and needs of any specific person who may receive it. Please be aware, that past performance is not a reliable indicator of future performance and/or results. Past Performance or Forward-looking scenarios based upon the reasonable beliefs of the third-party provider are not a guarantee of future performance. Actual results may differ materially from those anticipated in forward-looking or past performance statements. IC Markets makes no representation or warranty and assumes no liability as to the accuracy or completeness of the information provided, nor any loss arising from any investment based on a recommendation, forecast or any information supplied by any third-party.

eurusd short idea m15short eurusd
this block makes lowerlow then we can start short eurusd next attempt

Important Week for EURUSDOn Friday, EURUSD reached a support level and bounced off it.
This week, the market is waiting for the Fed’s decision on interest rates.
The trend remains bullish for now, and the upcoming news will likely determine the next major move.
Today and tomorrow, we might see some sideways movement ahead of the key announcement.
Don't rush into new trades and avoid using large position sizes!

EURUSD InsightWelcome, subscribers!
Please share your personal opinions in the comments. Don’t forget to hit the booster and subscribe!
Key Points
- On the 13th, Israel highlighted the risk of a broader conflict across the Middle East following Iran's retaliatory attacks in response to Israeli preemptive strikes on Iran’s nuclear facilities and key military targets.
- The Bank of Japan (BOJ) is expected to announce a plan to slow the pace of government bond purchase reductions at its upcoming monetary policy meeting.
- Political risk in the U.S. has intensified as protests condemning the Trump administration have erupted across the country. Combined with tax-related issues, the "Sell USA" sentiment is gaining momentum.
Key Economic Events This Week
+ June 17: BOJ interest rate decision, U.S. May retail sales
+ June 18: U.K. May Consumer Price Index (CPI), Eurozone May CPI, FOMC meeting outcome
+ June 19: BOE interest rate decision
EURUSD Chart Analysis
The recent rally has extended up to the 1.16000 resistance level, which marks the trend high. It currently appears to be pulling back due to resistance at this level, and there's a strong possibility of a short-term decline toward the 1.13000 level. However, if the pair breaks above the current resistance, the short-term trend may shift bullish, potentially targeting the 1.17500 level. A new strategy should be established promptly to account for this scenario.

EURUSDEURUSD needs a correction, we are expecting this correction to start in this week.
Disclosure: We are part of Trade Nation's Influencer program and receive a monthly fee for using their TradingView charts in our analysis.

I'm selling EURUSD, you should too!!!War is always bullish Dxy and bearish Eur. Technically too, a high has been taken and expecting retracement.
TP1 @ 1.147
TP2 @ 1 137
Follow me as most of my trades are market orders, so you'll see them on time and enter the trades on time. I want you to recover the money you lost to the market and make so much more
Ya gazie

Opportunity for buying EURUSDEURUSD touched strong support, so I think it will rise further, as shown.

Still keeping a close eye on a potential USD pop...Although the EUR/USD and GBP/USD popped higher late last week, I'm still keeping a close eye to stay short on the EUR/USD considering the bearish rising broadening pattern coupled with a yearly pivot point inter-median level and negative divergence on the MACD. This is all based on the daily chart.
Many factors are in play right now with what's going on between Israel and Iran along with FOMC this week and Tariffs still in play.
On a purely technical analysis point of view, I potentially expect a bullish retracement in the USD while remaining long term bearish across the board.
we'll see how this one develops.
Good Luck & Trade Safe.

EUR/USD Retesting Broken Resistance
EUR/USD has recently broken above the ascending channel and is now retesting the previous breakout zone between 1.15205 and 1.15325. This area may act as new support.
If the level holds, we may see continuation toward 1.15701, with potential extension to 1.16309 if bullish momentum continues.
A confirmed break back below 1.1520 would invalidate the bullish idea and suggest a false breakout.
🔹 Support zone (retest): 1.15205 – 1.15325
🔹 Target 1: 1.15701
🔹 Target 2: 1.16309
🔹 Timeframe: 1H
🔹 Structure: Retest of breakout level

Week of 6/15/25: EU AnalysisEU continues to have clean market structure and has all time frames aligned for bullish movement. Looking for price to retrace to the prime 1h POI for an A+ setup.
Major News:
FOMC - Wednesday

EUR/USD – Bullish Continuation Setup Ahead of Retest Zone
As of today, I’m maintaining a bullish stance on EUR/USD going into mid-2025. Back on May 22, I marked the support zone around 1.10649, and since then price action has respected that zone beautifully, forming higher lows and gaining steady upside momentum.
Looking at current structure across the 11H, 20H, and 16D timeframes, I do not see any strong bearish momentum. If anything, the most recent pullback seems like a natural setup for continuation rather than reversal.
🟡 Key zones to watch:
Support: 1.13636 (20HR Support)
Demand reaction zone: 1.14443 – 1.15407
Resistance/Next target zone: 1.15729 – 1.16311 (Previous swing high)
Upper target potential: 1.16921
We’ve already cleared the minor consolidation and are now holding above the support band. If we get a proper retest of the 1.14948 zone and hold, I expect continuation toward 1.16311, and potentially a breakout above 1.16921 if momentum follows through.
✅ Momentum Outlook: Bullish
📍 Bias: Long
🕰️ Trend: Mid-Term Swing (Higher Time Frame Confluence)
If no macro news disrupts momentum, the technicals point toward a healthy continuation. Let's see if the retest confirms the move. 📊

Potential long setup EURUSDTook almost two months for us to take April high well done for those who caught the move. This analysis will probably take a lot less time to play out.
Friday closed with an inside bar which means you would have to go onto lower timeframes to see which direction makes more sense to go.
I have not been given any reason fundamentally or technically to be bearish on the pair just yet so I will be targeting the high.
The daily FVG is a key area to look at and if it fails and we start making bearish FVGs that could be a sign that we will start getting a weekly or even a monthly pullback.
That's all I can say for now stay safe and flow with the markets.

EURUSD Potential UpsidesHey Traders, in today's trading session we are monitoring EURUSD for a buying opportunity around 1.14500 zone, EURUSD is trading in an uptrend and currently is in a correction phase in which it is approaching the trend at 1.14500 support and resistance area.
Trade safe, Joe.
Eurusd Will Drop Its PricesEUR/USD continues to recover ground lost and now extends the rebound to the 1.1550 zone on Friday. Meanwhile, the US Dollar maintain its bullish bias intact in response to a significant flight to safety amid increasing geopolitical concerns, while positive consumer sentiment data also contribute to the daily uptick.

EURUSD TRADE SETUPWait for retest the entry level and bullish momentum candle then take a trade for Buy otherwise skip this setup
