EURUSD Sell around 1.1600The Euro has seen a large rise in 2025 due to US policy uncertainty, but yield curve differentials favor the USD. I expect the USD to strengthen as EU and other countries aka SNB go towards NIRP and EU investors lose interest in EUR as a safer haven currency.
- ERAZ
USDEUX trade ideas

EURUSD broke the Resistance level 1.14960 👀 Possible scenario:
The euro rose 0.56% against the dollar on June 11 after President Trump signaled flexibility in trade talks, suggesting a possible delay to the July 8 tariff deadline. This eased market fears of escalating tensions.
Meanwhile, growing expectations of a Fed rate cut, driven by soft data and dovish comments, added pressure on the dollar and boosted demand for alternative currencies. Markets now eye the June 12 U.S. PPI report (expected +0.1% core). A surprise uptick could push EUR/USD toward the 1.15780 level.
✅ Support and Resistance Levels
Now, the support level is located at 1.13640
Resistance level is located at 1.16440

The surge in the euro was expected
💡Message Strategy
Since the beginning of this trading week, a number of economic data released by the United States have been weak. Following the decline in the manufacturing PMI, the ISM service PMI for May released on Wednesday fell to 49.9, the first contraction in nearly a year. In addition, the ADP employment data was also far below expectations, with only 37,000 new jobs, far below the expected 115,000, which strengthened the market's concerns about the risk of a US recession, thereby dragging down the US dollar.
At the same time, risk aversion and uncertainty in the United States have not improved significantly, and trade tensions, debt prospects and weak US bond yields have put pressure on the US dollar. Obviously, in the game between eurozone monetary policy and US economic data, the euro wins.
📊Technical aspects
From the daily chart, the exchange rate has maintained a strong oscillation pattern since mid-April, and has generally been running between the middle and upper tracks of the Bollinger Bands. The upper track of the Bollinger Bands is currently at 1.1471, and the lower track is at 1.1118. The Bollinger Bands are slightly open, indicating a rebound in volatility.
The MACD indicator shows that the double lines form a golden cross, and the bar chart turns from green to red, suggesting that the downward momentum is weakening; the RSI indicator remains near 57, slightly in the neutral to bullish area, and has not yet reached the overbought level. The overall technical pattern tends to fluctuate upward. If it breaks through the 1.1500 area, it will continue to rise.
At present, the main idea is still to do more on the callback, and do not blindly chase the short.
Long Position: 1.14450-1.14650

Short signal Sell signal in these zones, targeting the initial move points and liquidity levels at
1.13821 and 1.13275.
Waiting for a great profit opportunity.

EUR/USD long (Daily chart) - Trend line indicating an uptrend
- Fib tool: Buy zone aligns with my fib tool
- Demand zone: The demand zone is lining up with previous rejections. I believe a retracement will happen
- Market structure - Clear as day on the daily timeframe

EUR/USD: Euro Pops Above $1.16 in Four-Year High. What’s Next?The dollar wobbles, Trump talks tariffs, and the euro’s got its dancing shoes on.
The Euro Wakes Up, Stretching Its Legs at $1.16
Look who just rolled out of bed and decided to make a scene.
For the first time in four years, the euro has finally leapt out of its slumber and sprinted to $1.16 — all at the expense of the US dollar, which continues to shed value.
The FX:EURUSD isn’t just crawling higher. It’s flexing, fueled by dollar fatigue, political drama, and some very European stubbornness.
So what’s behind the move? Why is the euro soaring while the European Central Bank is actually cutting rates? And what’s the dollar doing? Let's unpack it all — one central bank, one tweet, and one inflation print at a time.
Trump’s Tariff Ping-Pong: Back On, Back Off
Let’s start with the one thing that never quite leaves the headlines: Trump’s trade policy.
Just when traders were catching their breath after some tariff reprieve on China, the market got pulled back into the mess. “WE ARE GETTING A TOTAL OF 55% TARIFFS, CHINA IS GETTING 10%. RELATIONSHIP IS EXCELLENT,” Trump posted on Truth Social late on Wednesday, reigniting fears that the trade war is getting heated up again. Especially after a US squad of negotiators touched down in London and walked away with some promising news .
Markets don’t love confusion. Investors especially don’t love a US trade policy that changes faster than the Nasdaq NASDAQ:IXIC during CPI week. This kind of noise erodes confidence in US economic leadership and — more importantly — in the dollar.
The world’s most important currency is starting to feel… less important, less relevant, and less reliable. And while it’s not collapsing, it’s definitely catching fewer friends at the FX party.
On the other side of the pond, the euro isn’t rising because Europe is crushing it (even though it’s doing pretty well against rival currencies, just check the forex heatmap ) — it’s rising because the dollar is slipping off its pedestal. So yes, the euro’s up. But this isn’t a standing ovation for Europe — it’s more of a polite shrug away from America.
US Inflation Creeps Higher — And That Means a Cut?
US inflation picked up to 2.4% in May but still left the door open for a cut by the Federal Reserve.
So what does the market do? It prices in a cut.
Lower rates mean lower yields on Treasuries, which means less incentive for global investors to hold dollars. And when the yield game turns dull, guess what gets more attention? Gold OANDA:XAUUSD — because if your asset doesn’t yield anything, at least let it be shiny.
ECB Cuts Again, and the Euro Still Rises?
Now here’s the riddle. The ECB last week cut its benchmark rate to 2% , hitting a two-year low. By all textbook logic, a rate cut should weaken the local currency.
Here’s why it’s rising instead:
Markets are forward-looking . The rate cut was expected and already priced in. What matters now is whether more cuts are coming (spoiler: not too many). Traders are betting the ECB is nearing the end of its easing cycle — and may turn neutral soon.
The Fed looks more dovish . Rate differentials still matter. Even if the ECB is cutting, the Fed is expected to cut more over the next 12 months. That narrows the gap between euro and dollar yields, making the euro more attractive in relative terms.
Eurozone data isn’t great — but it’s not falling apart either. While growth in the eurozone isn’t setting any records, it’s been just OK to support the currency. Inflation is cooling in line with ECB targets, unemployment remains low, and key sectors like manufacturing are showing signs of life.
Put it all together and you get a euro that’s rising despite rate cuts — a phenomenon that would make FX professors tear their hair out, but makes perfect sense when you zoom out.
Technicals: This Isn’t a Flash in the Pan
From a chartist’s perspective, the FX:EURUSD breakout above $1.16 was a big deal. That level had acted as resistance since November 2021. Now cleared, a flurry of algo buys and retail FOMO might fuel the next leg in either direction.
From the bulls’ perspective, momentum is picking up, and the euro looks poised to test $1.17–$1.18 if the dollar stays fragile (that said, keep your eye on any hot news coming out of the economic calendar ). RSI is not yet flashing overbought, and MACD is still screaming “more grounds to cover.”
Question is: How long can the euro dance before the music changes? And we’re asking you — share your thoughts on the euro-dollar pair and let’s see who gets it right!

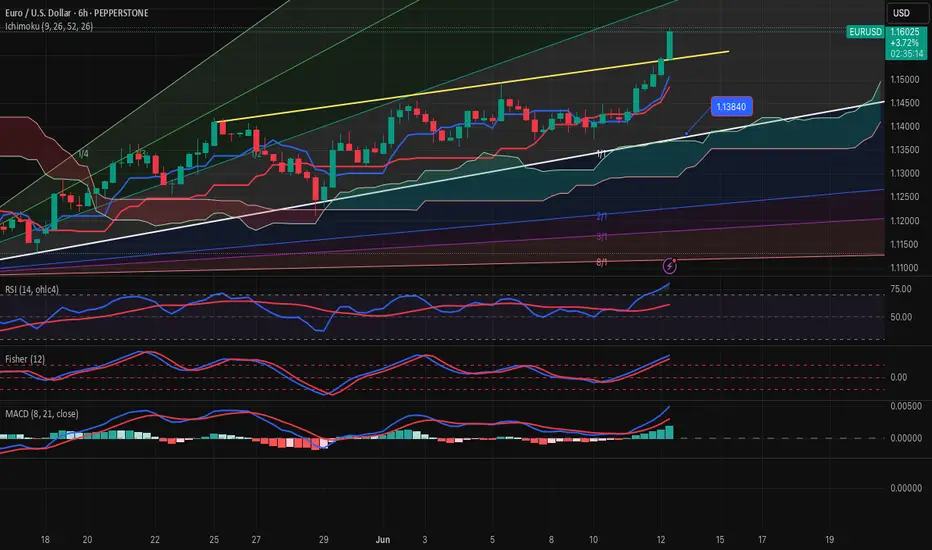
EURUSD-SELL strategy 6 Hourly chart GANNThe pair is on a positive note, i.e. weakness USDX but is starting to become very overbought. We may see slightly higher levels near 1.1650 area before we start our corrective action.
Strategy SELL @ 1.1645-1.1675 and take profit near 1.1427 for now.
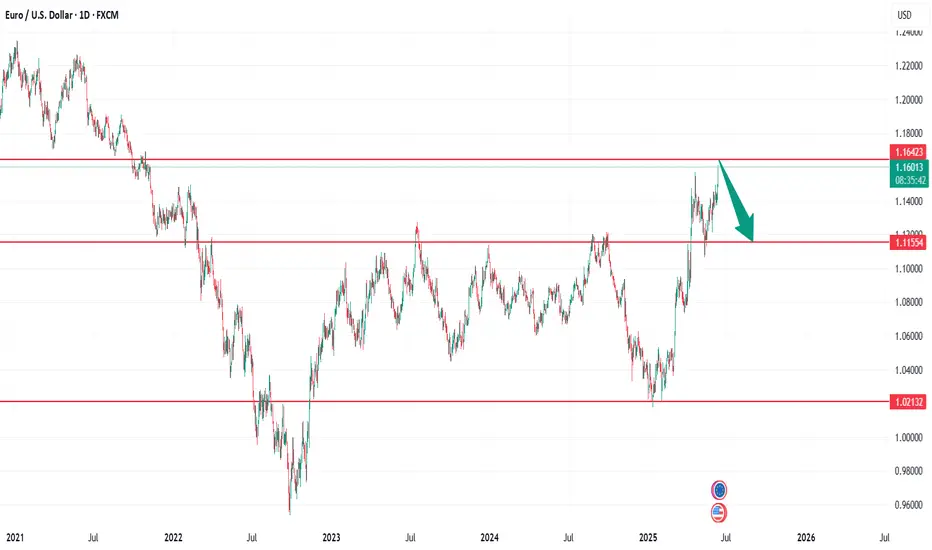
Get Ready – A Pullback May Be ImminentEUR/USD has rallied impressively, gaining nearly 1,400 pips from its February 2025 low. The pair recently surged to revisit a price level last seen in November 2021. However, after such a strong bullish move, a correction appears likely.
I’m anticipating a potential drop of at least 500 pips from the current level after hitting a strong resistance on multiple time frame.
Check the chart for more details.
Stay safe and trade smart.
Judas Swing Monday Recap – Sticking to the Plan Pays 09/06/2025In case you're new to the Judas Swing Strategy, here’s the strategy in a nutshell:
It’s a classic price manipulation strategy where the market fakes a move in one direction (the “Judas” move), usually after the 00:00–08:30 EST window, before sharply reversing. This tactic is often used by smart money to trap retail traders around key highs/lows, followed by a reversal into a Fair Value Gap (FVG) for entry confirmation.
We began Monday spotting a textbook Judas Swing on FX:EURUSD which was our first trade of the day. Price took out session lows, grabbing liquidity, then gave us a break of structure to the upside and a clean reversal into the FVG.
We entered long with our stop loss below the manipulation low. The trade moved nicely into profit and came within points of our target but just as we were anticipating a clean 1:2, price stalled and reversed aggressively, stopping us out.
Trade Outcome: Loss
Risk-Reward: -1%
Lesson: Even the most valid setups will sometimes fail
The next Judas swing setup came on $GBPUSD. Price swept the low of the zone, then gave a break of structure, with price retracing into the FVG. We entered long, placing the stop loss 10 pips below entry price.
The trade rallied hard post-entry, hitting our target with minimal drawdown
Trade Outcome: Win
Risk-Reward: +2%
This is why we take every valid setup. The win here offset the earlier FX:EURUSD loss, keeping us net even on the day at this point
The final Judas swing setup on Monday was on OANDA:AUDUSD , and it couldn’t have been cleaner. After a strong sweep of previous lows, price reversed and broke structure convincingly. An FVG formed and price retraced into it beautifully.
We entered long, placing the stop below the liquidity sweep. Price then rallied steadily throughout the session, and retraced almost hitting our stop loss but turned around and hit our 1:2 target.
Trade Outcome: Win
Risk-Reward: +2%
Despite starting the day with a loss, staying disciplined and trading all valid Judas setups left us with:
1 loss ( FX:EURUSD -1%)
2 wins ( FX:GBPUSD +2%, OANDA:AUDUSD +2%)
Net Gain: +3R
This is why a rules-based approach beats emotional trading. Stick to the process, and the edge takes care of the rest.

Euro can reach 1.70 areaDXY is weak. Risk will thrive. 17 year downtrend in jeopardy. Foreign entities are net sellers of US Bonds and Treasuries since 2015.

#EURUSD Buy 1.15265#EURUSD Buy 1.15265
SL 1.14665
TP 1.15465
TP 1.16265
TP 1.17665
Trade at your own risk
Protect your capital
The Wizard 🧙♂️ SWFX

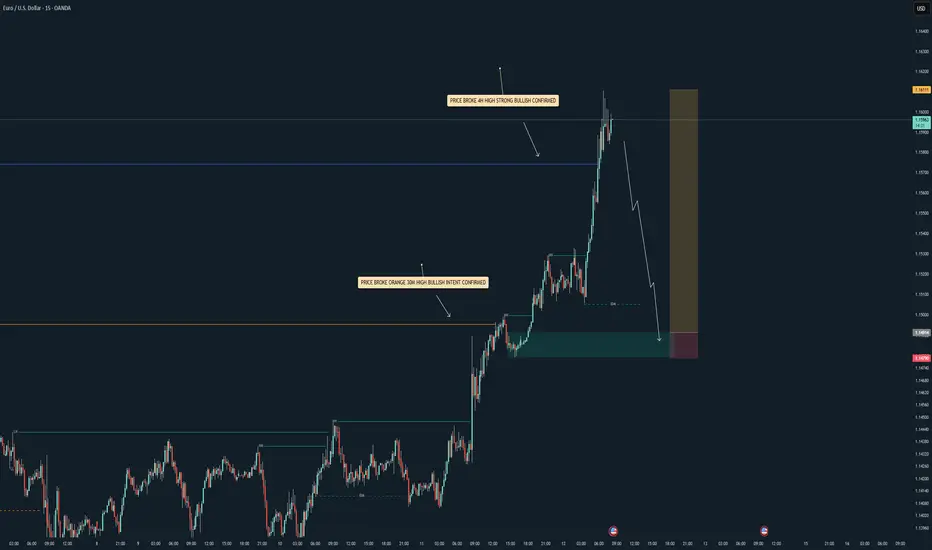
EU| Workflow - End of Week but Still in SyncPrice still pushing with strong bullish conviction, so I’m just flowing with it and waiting on that precision entry — nothing forced, just discipline and patience.
Even though we’re nearing the end of the week, the workflow and higher timeframe analysis still align, so I’m staying ready. I’ve got my zones mapped out and I’m watching for price to pull back into that green zone POI. Once that mitigation happens, I’ll drop to the 1M for the structure shift and look for that 5M LH break to confirm my entry.
Just letting the setup mature and keeping emotions out of the way. 📊
Always open to hearing how others are viewing EU right now — let’s elevate the convo while we wait on the market to give us the greenlight. 🎯
#SMC #EU #SmartMoney #TopDownPrecision #InducementKing #JuicemannnStyle #ForexFlow #EndOfWeekExecution
Bless Trading!

EURUSD Outlook – Long, Medium & Short-Term Analysis🔹 Weekly Chart:
The broader structure remains technically bearish. We've recently seen a trend reset, which could mark the beginning of a fresh downside leg.
🔹 Daily Chart:
A clear bearish trend reversal pattern has formed, accompanied by a manipulation phase. A confirmed break structure is now in place. As long as price remains below 1.15734, short positions remain valid.
🔹 4H Chart:
Currently in a range-bound phase. A confirmed break below 1.1371 will be a key bearish trigger for potential selling opportunities.
🔹 1H Chart:
Still ranging, but a valid Lower Low (LL) has already printed. A second LL below 1.1371 would confirm a short-term bearish continuation.
On the flip side, a break above 1.1495 would open the door for a bullish move in the short term.
📌 Key Levels to Watch:
Bullish above: 1.1495
Bearish below: 1.1371
Critical invalidation: 1.15734
Trade safe and stay disciplined.

EU 6/11/25 NYPre-Analysis
1) Session Break (NY& L took out A)
2) Expecting? (Trend)
3) High Volume located at (Breach)
4) Leg being traded? (2)
5) Market digestion? (15min)
6) Edge? (S1) higher TF is (1hr)
7) Edge Specifics? (S1)
8) Continuation
9) Micro Timeframe (5min)
10) Class (A )

EURUSD LongHere is our EUR USD Signal that we posted
As you can see it's running nicely at 258 Pips.
EURUSD Buy
📊Entry: 1.13538
⚠️SL: 1.12594
✔️TP1: 1.14732
✔️TP2: 1.16256
✔️TP3: 1.18194
We have 5 big swing trades running at present, all of which comes from our trading strategy that is solely based on pure maths. So far in 2025 we have hit 1 stop loss from over 100 trades.
My point to this post is to encourage you all to keep trying, don't give up. It took us over 2 years to perfect this strategy, and we know it works.
If you want any help just ask me, and I will help you.

EURUSD 11/06/2025 - 4HR Buyside LiquidityEURUSD 11/06/2025 - 4HR Buyside Liquidity
Bearish on DXY, same story as USDJPY, looks very promising for 4HR buyside to be taken.


EURUSD BEAR - H1I have given out everything you see here for free.... Plus everything can be verified easily (TradingView Profile / Bio is all I am allowed to say).
I do have a higher bear if you saw the rules... keep an eye on the solid swing (levels)
Plus I do have a breakout BULL waiting if the bear structure fails.
I have made this very simple. I trade the wicks every time. That's why I can roll stops to entry after TP 1 (Fixed at 1:1 +35P)
All my levels have a tolerance of 15 PIPS... just like the banks. BUT I will not be adding more day trade levels (white bordered)
(Intraday levels are dashed)

EUR/USD: Weekly PAT + VPA 5/11/2025Trading Analysis EUR/USD - Price Action and Volume Price Analysis
Weekly Structure Analysis: At present, we find ourselves within a bullish weekly range. The lower boundary of this range is 1.07330, established during the week of March 24, 2025, while the upper boundary is at 1.15734, reached the week of April 21, 2025. The price movement from 1.073 to 1.157 has surpassed a swing high, which we will identify as our initial resistance point as we aim to return to 1.15734.
Weekly Price Action Analysis: Analyzing structure and price action reveals similarities. Our confidence in a bullish trend is the anchored weekly bar. The weekly candle from the week of April 7, 2025 serves as this anchor. Following the inside bar, we observed a bearish pin bar, which acts as a Bullish Reacher since its wick exceeded the high of the anchor bar's wick (Wick on Wick). The market shows signs of wanting to rise, but it must first hit a demand zone that weekly traders are keen to engage with.
Volume Price Analysis: The last four weekly candles have demonstrated limited strength in driving the market lower, with support holding at 1.11927 (1.12). As the price declines, trading volume is decreasing, following a sharp upward movement, likely due to profit-taking or repositioning. Volume analysis indicated we should retest 1.15734.
Good luck and happy trading!
OANDA:EURUSD TVC:DXY

EURUSD SELL OPPORTUNITY!!Price just tapped in the H4 supply zone. I anticipate a sell off around that price point. Also considering the nature of aggressive sell off around that price range, a sell opportunity is envisaged

#AN006 Forex: Dollar, Yen and Emerging Currencies Collapse
Hello, I'm Forex trader Andrea Russo, creator of the SwipeUP Elite FX Method that analyzes the market like a Hedge Fund. Today I want to talk to you about the most important economic news of the last few hours and how these are influencing, in real time, the global currency market.
## 🔜 US inflation: is the Fed heading for a cut?
The CPI data released yesterday surprised the markets: annual core inflation stopped at +2.8% while the general figure stood at +2.4%, below expectations. This inflationary cooling immediately triggered speculation about a possible rate cut by the Federal Reserve as early as September. The Dollar Index (DXY) reacted negatively, losing ground and touching the lowest levels since April.
### Forex Impact:
* The dollar weakens across the board.
* EUR/USD tested the 1.15 area
* GBP, JPY and CHF strengthened in counter-balance.
## 🌐 US-China trade tensions: half-way deals
Over the past 24 hours, President Trump spoke of "partial progress" in talks with China on tariffs and rare metals. However, the lack of a definitive deal keeps global uncertainty high. Investors are weighing the risk of a new escalation, especially in strategic sectors such as technology and raw materials.
### Forex impact:
* AUD and NZD show high volatility.
* JPY benefits as a safe haven currency.
* Commodity currencies remain reactive to geopolitical developments.
## 📉 ECB: rate cut and expansionary forward guidance
The European Central Bank has cut interest rates to 2%, marking the eighth consecutive cut. The governor opened up to further expansionary measures in the third quarter, should inflation fail to rebound towards the 2% target.
### FX Impact:
* The euro remains under pressure, despite the dollar weakness.
* EUR/CHF in congestion.
* EUR/USD in a sideways phase after the initial rally.
## 🚗 Emerging Markets: New Cycle of Strength
According to the World Bank, growth in emerging markets will slow to 3.8% in 2025. However, currencies such as the Brazilian real (BRL) and the Mexican peso (MXN) have gained momentum thanks to the dollar weakness and speculative inflows on carry trades.
### FX Impact:
* BRL and MXN strengthen.
* Long-term opportunities on USD/EM crosses.
* Beware of political risks and local inflation.
## ⛽ Oil rally: domino effect on currencies
Oil prices rose this week: WTI hit +6%, while Brent marked +4%. The rally was triggered by improvements in US-China relations and geopolitical tensions in the Middle East.
### Forex Impact:
* Strengthening CAD and NOK.
* EUR and JPY penalized as net importers.
* Correlation opportunities on USD/CAD.
## 🔄 Forex Outlook: what to expect now
The market has entered a phase of **macro realignment**:
* The dollar is in structural correction.
* The euro is struggling between ECB stimulus and USD weakness.
* Safe haven currencies (JPY, CHF) remain strong.
* Emerging markets and commodity currencies show momentum.
In the short term, the key will be the evolution of US data (PPI, retail sales) and new statements from the Fed.
Keep following me for updates and operational analysis always based on real data and institutional methodology.
