Eurusd Buyprice is bullish on the Daily and 4hr tf. on the 1hr it is exiting the Daily demand zone and recently bounced off the 1hr trendline. price is currently around 4hr poi which may help give us fuel to move to the 1hr poi and above targeting next Daily key level.
USDEUX trade ideas

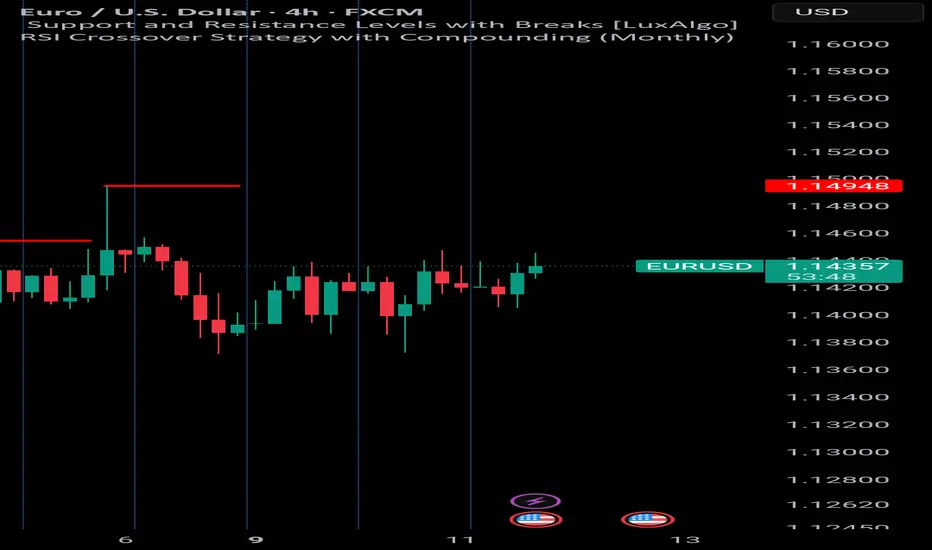
Bullish momentum to extend?EUR/USD has reacted off the resistance level which is a pullback resistance and could rise from this level to our take profit.
Entry: 1.1451
Why we like it:
There is a pullback support level.
Stop loss: 1.1386
Why we like it:
There is a pullback support level.
Take profit: 1.1558
Why we like it:
There is a pullback resistance level.
Enjoying your TradingView experience? Review us!
Please be advised that the information presented on TradingView is provided to Vantage (‘Vantage Global Limited’, ‘we’) by a third-party provider (‘Everest Fortune Group’). Please be reminded that you are solely responsible for the trading decisions on your account. There is a very high degree of risk involved in trading. Any information and/or content is intended entirely for research, educational and informational purposes only and does not constitute investment or consultation advice or investment strategy. The information is not tailored to the investment needs of any specific person and therefore does not involve a consideration of any of the investment objectives, financial situation or needs of any viewer that may receive it. Kindly also note that past performance is not a reliable indicator of future results. Actual results may differ materially from those anticipated in forward-looking or past performance statements. We assume no liability as to the accuracy or completeness of any of the information and/or content provided herein and the Company cannot be held responsible for any omission, mistake nor for any loss or damage including without limitation to any loss of profit which may arise from reliance on any information supplied by Everest Fortune Group.

EURUSD: Perfect spot to short.EURUSD is bullish on its 1D technical outlook (RSI = 62.082, MACD = 0.004, ADX = 31.112) as it is trading inside a Channel Up since the May 12th low. The 4H RSI sequence suggests that based on the Channel's first bullish wave, the market is now on the 4th count, which was previously the top (as close to the 1.786 Fibonacci extension as possible). We turn bearish here, targeting the 0.786 Fib level at the bottom of the Channel Up (TP = 1.13550).
See how our prior idea has worked out:
## If you like our free content follow our profile to get more daily ideas. ##
## Comments and likes are greatly appreciated. ##

EURUSD - Mark up for the rest of the weekAfter the CPI data was released today we had a lovely upside move. The move has caused us to trade into the previous weak higher timeframe high which I am hoping we can break and close above before the day is out.
I am now focusing on what kind of pullback we may get into out POI's. Because there is no buy side liquidity on the first POI I will need to see a structural shift on the 15min TF to confirm that internal structure swing to move back towards the upside.
If the 1st POI fails to hold I will be more aggressive with my secondary POI as that will be the premium discount price in order for us to move higher.
If that POI fails and we break the 4H structure swing then this could signal we are about to move lower.
If I can be of any assistance to anyone don't be shy to give me a message

Nice textbook Gartley Pattern setupThis is a very nice looking Gartley pattern setup for a continuation to the downside in the Euro...
we must hit at least a 11740-50 area to count complete

EURUSD - Waiting for the Breakdown After 4H SweepEURUSD has just completed a sweep of the 4H highs, tagging liquidity resting above the consolidation range. That move looks like a classic inducement, with price now reacting lower and showing signs of weakness. This type of sweep, especially when it happens inside a range, often leads to a reversal back through the range, provided the internal low breaks cleanly. Right now, price is still hovering above that key point, but we can see signs of slowing momentum already.
Liquidity Context and Sweep Logic
This recent push above the highs fits well within ICT-style logic: a sweep of internal range liquidity that serves to fuel the opposite move. The chart shows a textbook example of a consolidation phase being manipulated to the upside first, where buy stops get triggered and liquidity is taken. The real move tends to unfold after that, once we get confirmation through structure breaks and displacement to the downside.
Structure Break and Bearish Confirmation
The internal low within the range is acting as a key trigger level. A clean break below that would serve as confirmation of a bearish market structure shift. That’s the point where the market goes from internal liquidity hunt to actual displacement. If that low gives way, the probability of continuation lower increases significantly, and that’s where I’ll be expecting price to seek the next pocket of liquidity.
Support and Key Area of Interest
There’s also a well-respected support level not too far below, one that price has bounced from several times. That area could either act as a temporary reaction zone or, if broken impulsively, could open the path toward deeper inefficiencies. Ideally, I want to see price break below both the internal low and this support area, then continue toward my next level of interest where I expect either a reaction or a higher probability setup to form.
Conclusion
For now, this setup is a waiting game. The liquidity has been swept on the upside, and now it’s all about whether the structure confirms to the downside. I’m not interested in chasing the first move. What I want to see is displacement below the internal low and support level, followed by continuation or a clean reaction from the next zone of interest.
Disclosure: I am part of Trade Nation's Influencer program and receive a monthly fee for using their TradingView charts in my analysis.
___________________________________
Thanks for your support!
If you found this idea helpful or learned something new, drop a like 👍 and leave a comment, I’d love to hear your thoughts! 🚀

EURUSD: Will Go Up! Long!
My dear friends,
Today we will analyse EURUSD together☺️
The in-trend continuation seems likely as the current long-term trend appears to be strong, and price is holding above a key level of 1.14821 So a bullish continuation seems plausible, targeting the next high. We should enter on confirmation, and place a stop-loss beyond the recent swing level.
❤️Sending you lots of Love and Hugs❤️

EU DEEP CRAB PATTERN C-D LEGPrice seems to be reaching the 88.8 FIB Level, this would cause major resistance to bullish trend, could possible start to see price retest lower support levels.

"EUR/USD 15-Min | Inverse Head & Shoulders Breakout EUR/USD 15-Min Chart — Inverse Head & Shoulders Pattern.
✅ Entry: 1.14336 (Neckline Break Confirmation)
✅ Target: 1.16161 (Based on Pattern Projection)
✅ Stop Loss: 1.1400 (Below Right Shoulder)
🎯 Potential Move: 50-80 pips
📊 Risk:Reward = 1:3
Educational Purpose Only. Not Financial Advice.

EUR/USD Weekly Outlook | Harmonic Butterfly PatternHere is a professional TradingView publish description for your EUR/USD Weekly Butterfly Pattern Analysis:
---
🦋 EUR/USD Weekly Outlook | Harmonic Butterfly Pattern
Pair: EUR/USD
Timeframe: 1W (Weekly)
Strategy: Harmonic Pattern Recognition – Butterfly Pattern
Bias: Bearish Reversal Setup
---
🔍 Pattern Analysis:
Butterfly Harmonic Pattern completed with precision at the 1.272–1.414 extension zone, forming the critical D-point near 1.14700.
Price has reacted sharply from the PRZ (Potential Reversal Zone), aligning with a historical supply zone.
Confluence from Fibonacci extensions:
AB = 0.786 retracement
BC = 0.382 to 0.886 retracement
CD = 1.618 to 2.618 extension
📉 Bearish rejection expected from this high-probability reversal zone.
---
📌 Key Levels:
PRZ (Potential Reversal Zone): 1.14500 – 1.15000
First Target Zone (Support Block): 1.11500 – 1.10500
Invalidation (Pattern Failure): Close above 1.15500
---
📅 Projection: This weekly harmonic butterfly suggests a potential trend reversal or deep pullback. We may see EUR/USD targeting lower support as D-point gets respected. Watch for signs of weakness such as long-wick rejections, bearish engulfing patterns, or RSI divergence confirmation.
---
💡 Conclusion: EUR/USD is at a critical juncture. If the butterfly holds, this could be a high RR short opportunity for swing traders. Patience is key—confirmation on lower timeframes will validate entry.
---
📊 #EURUSD #ButterflyPattern #HarmonicTrading #ForexAnalysis #TechnicalAnalysis #SwingTradeSetup

POST NEWS📰 CPI News-Based Trade | EUR/USD Buy
We entered a long position on EUR/USD following the release of the US CPI data, which showed a significant deviation from expectations:
Actual CPI m/m: 0.2% below forecast
This meets our market-moving threshold of ±0.2%, indicating potential USD weakness
Weak CPI data reduces Fed rate hike expectations, leading to dollar depreciation
📈 Trade Setup:
Direction: Buy EUR/USD
Entry Reason: CPI m/m came in lower than forecast, signaling USD weakness
Strategy: News-based momentum trade
Stop Loss: 1.5 × 15-min ATR
Take Profit: 2 × ATR (risk-reward ~1:1.33)
🎯 Objective: Catch the post-news directional move based on fundamental weakness in USD. ATR-based risk management ensures volatility-adjusted levels.

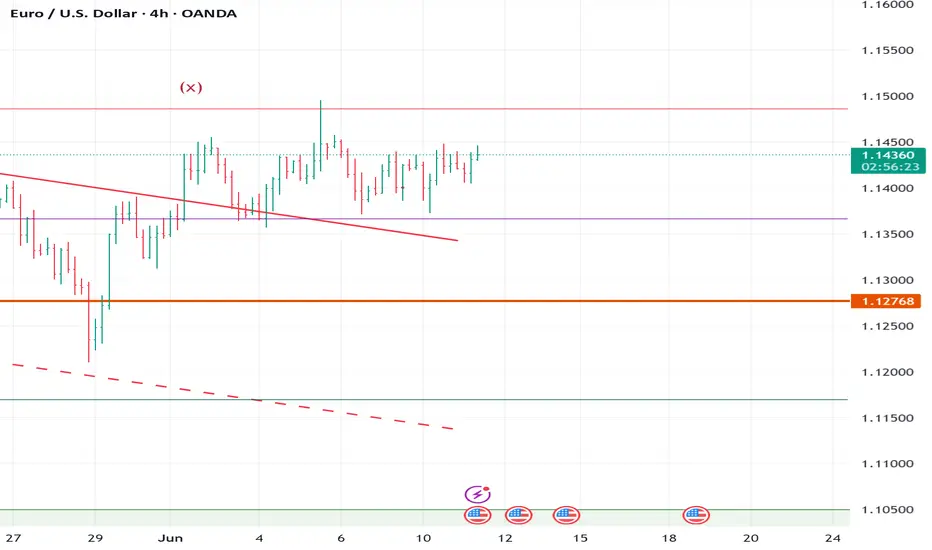
Today's EUR/USD Trend Analysis and Trading RecommendationsThe EUR/USD is trading at the upper end of its recent range, having hit an intraday high of around 1.1440 and remaining near that level. The US Dollar strengthened in the early session due to optimism about the easing of Sino-US trade tensions, but later declined as European stocks fluctuated. Technically, the daily chart shows bulls remain in control, with the 20-day SMA rising gently at 1.1330. In the short term, the pair is range-bound around the 20-day SMA, yet to confirm a bullish breakout, while the 100-day and 200-day SMAs support the overall upward trend.
EUR/USD
buy@1.14200-1.14300
tp:1.14600-1.14900

Euro may reach seller zone and then continue to declineHello traders, I want share with you my opinion about Euro. In this chart, the price started to grow, bouncing from the support line, and soon reached the support level, which coincided with the buyer zone. Then it declined to support line, making the correction and then made an impulse up from this line to the resistance level, breaking the 1.1070 level. After this movement, the Euro made a correction and then continued to grow and broke the resistance level, which coincided with the seller zone, and even rose higher than the seller zone. But soon Euro turned around and started to decline and broke the 1.1455 level again, after which it declined to the support line inside the range. Price little grew near this line, but later broke the support line and continued to decline. It fell to the support level, which is the bottom part of the range, and then started to grow. Euro later reached the top part of the range, which is the resistance level, and not long time ago turned around and started to decline. So, after looking for this chart, I think that the Euro may enter to seller zone and then continue to decline inside the range. For this case, I set my TP at 1.1250 points. Please share this idea with your friends and click Boost 🚀
Disclaimer: As part of ThinkMarkets’ Influencer Program, I am sponsored to share and publish their charts in my analysis.

EURUSD SNIPER Smart Money
🎯 EUR/USD – Sniper Smart Money Setup | June 11, 2025
By Talion-Promosale
Pair: EUR/USD
Timeframe: 1H / 4H
Bias: Bullish (Smart Money Shift in Play)
Current Price: ~1.1435
🔍 Smart Money Breakdown:
Market Structure:
Internal structure has shifted bullish after a break of structure (BOS) at 1.1415.
Last significant swing low at 1.1380 has been liquidity swept (sell-side taken).
Now in a reaccumulation phase with bullish intent.
Liquidity Pools:
Resting buy-side liquidity above equal highs at 1.1460–1.1470
Clean sell-side liquidity was taken below 1.1380 (classic manipulation sweep)
Order Blocks (OB):
1H Bullish OB at 1.1405–1.1420
Price is currently reacting from this OB with displacement and market structure shift
Fair Value Gaps (FVG):
Imbalance (FVG) from 1.1430 to 1.1450
Potential short retracement into OB zone, before filling imbalance and expansion
🎯 Sniper Entry Plan:
📌 Long Setup:
Entry: 1.1420 (inside 1H OB)
Stop Loss: 1.1395 (below OB)
TP1: 1.1460 (liquidity grab)
TP2: 1.1500–1.1520 (premium array zone)
Risk: 1:2 to 1:3
Entry confirmation tools:
Displacement candle from OB
BOS after mitigation
RSI divergence confirmation optional
---
,🏂 Smart Note from Talion-Promosale:
This is a classic Sniper-style setup:
✅ Liquidity sweep
✅ OB mitigation
✅ Break of structure
✅ FVG to be filled
I'm anticipating EUR/USD to run the highs above 1.1460 once 1.1420 is confirmed as a valid mitigation point.
---
📈 Remember: Wait for confirmation. Let price come to your level. The sniper doesn’t chase — he waits. 🥷
#SmartMoney #EURUSD #SniperTrading #OrderBlock #LiquiditySweep #FVG #PriceAction #Forex #TalionPromosale #ICTStyle #TradingView
Talion-promosale
EURUSD: Bears Will Push
The recent price action on the EURUSD pair was keeping me on the fence, however, my bias is slowly but surely changing into the bearish one and I think we will see the price go down.
Disclosure: I am part of Trade Nation's Influencer program and receive a monthly fee for using their TradingView charts in my analysis.
❤️ Please, support our work with like & comment! ❤️


EURUSD | Bearish Bias Below 1.1450, Eyes on 1.1372EURUSD | OVERVIEW
The pair maintains a bearish momentum as long as it trades below the pivot level at 1.1450, targeting the support at 1.1372. A clear break below this level would reinforce the downtrend, potentially extending the decline toward 1.1270.
Alternative Scenario:
A confirmed 1-hour candle close above 1.1450 would indicate a potential shift to a bullish trend, with upside targets at 1.1535, and possibly 1.1625.
Support Levels: 1.1372, 1.1270
Resistance Levels: 1.1535, 1.1625

ELLIOTT WAVE EURUSD H4 update
EW Trade Set Up H4
minute wave (ii) running
is not already clear wheter it will develope in a sideway or sharp correction usually wave 2 is sharp in a zigzag to 0.618 retracement value.
short term key levels (area)
1.1445
1.1425
1.1365 POC
1.1320
1.1220
EURUSD in bullish trend EURUSD in bullish trend expected trend reversal as RSI diversion can be seen.

EURUSD - Longs Today
📉 How This Trade Could Have Played Out – EURUSD, 15min Chart
This chart demonstrates a textbook example of how to use the ELFIEDT RSI + 3SD Reversion Strategy with additional RSI divergence to identify a high-probability reversal setup.
🟢 What Happened Here:
✅ Buy Signal Triggered
The script printed a green "UP" signal as price dipped sharply — closing beyond the lower volatility band with momentum in oversold territory and a spike in volume. This marked the initial mean reversion opportunity.
📉 RSI Divergence Formed
Just after the price made a lower low, the RSI formed a higher low — classic bullish divergence, showing underlying strength even as price dropped. This added confluence to the signal.
💡 Divergence-Based Entry Zone
With price recovering above the signal bar and RSI breaking upward, traders could use this divergence as a secondary confirmation entry — improving timing and confidence.
📈 Momentum Followed Through
After the signal and confirmation, price reversed strongly upward with a clear multi-candle move, offering multiple reward opportunities depending on your exit style.
✅ How to Trade It (Step-by-Step)
Wait for a signal label (green/red) from the script — this marks a statistically stretched price condition with volume support.
Add the RSI indicator to your chart.
Watch for divergence (price making a new low, but RSI not confirming) near the signal — this gives you a stronger reason to enter.
Look for a reversal candle (like a bullish engulfing, pin bar, or inside bar) for clean entry timing.
Use the previous low as a stop and target a 1:2 or better reward-risk ratio based on price structure.
🔁 Pro Tip: Top-Down Boost
This exact signal is even more powerful if a similar setup appears on the 1-hour and 5-minute charts around the same area.
✅ When multiple timeframes agree, it’s a higher-probability zone to enter.
🧠 This approach blends statistics, momentum, and price action — giving you structure and flexibility as a trader.

Eurusd D Updatei buy eurusd 3 time{yellow line]
now we hit first take profit so we put stop loss on entry price and we keep eurusd for next take profit

EURUSD shortThe Setup:
1. A-B: Strong impulsive drop on increasing volume → clear evidence of real selling pressure.
2. B-C: Pullback forms on decreasing volume → classic corrective behavior, not buyer aggression.
3. C-D: Entry just below point C as new volume confirms sellers stepping back in.
4. Targeting >3R with stop tucked above C — logical structure, clean invalidation.
✅ Volume confirms the trend
✅ Structure is tight, no randomness
✅ Timing aligns with volatility spike (news at the bottom?)
✅ Clear bearish continuation pattern
what do you think of this a head of cpi?
