EURUSD Asia Trade Executed June 10EURUSD Trade Executed
June 10
Parent range Premium
Previous session Premium
Suspected Sell off Asia/London
Asia Framework
*Price took equal lows liquidity in NY AM session
*Retraced in NY PM to a session premium
*Consolidated to close NY in a premium
Idea for June 10
*Asia opens to take minor buy side into a FVG- recognizing Asia hunts for minor liquidity before its expansion and with bias identified I am gaining confidence to be patient like today to wait for Price to align to my ideas
*Price bodies tap the CE of the FVG-tippings its hand it will roll over
*Because I was impatient yesterday I waited for 20:00 delivery to play out before reacting
*20:45 small consolidation/minor retracement
*21:05 swing high to CE of 20:35 candle and first presented FVG
*21:06 entry
*Targets speculated that Price was in a session premium with the anticipation to come down to the 50 level-1.14125 level and the FVG targets noted
*21:50 Exit trade second target hit-I actually set the target and got stopped out!
*Employed the Standard Deviation tool that aligned with the 1.14000 price I exited on-pretty cool!
Greed kept me closing the trade and being very happy even though my sentiment was price could reach for equal lows which it did.
For reference I use DXY to frame this trade speculating DXY would run to its buy stops and it did!
Great delivery. Great analysis. So happy with this Asia trade.
USDEUX trade ideas

EURUSD - Bulls LoadingEURUSD has printed solid divergence on RSI. A volume supported pin bar and order block at support suggests bullish reversal has taken place. Fundamentally too fiscal stimulus package in euro zone might prevent EUR from falling further.

Long position on the EURUSDRecent news state that "Moody’s strips US of top-notch triple-A credit rating". What does this mean for the dollar?
Could this zig-zag on the EURUSD egde the bears to push the price to 1.2?
EURUSD | Clean Price Flow Recap Target Hit with ARX StructureQuick breakdown of the recent EURUSD move we analyzed structure held, and price followed through to target.
This video reviews how the setup formed, the confluences behind the entry, and why patience paid off.
🎯 For educational purposes only.

EURUSD SHORT FORECAST Q2 W24 D10 Y25EURUSD SHORT FORECAST Q2 W24 D10 Y25
Professional Risk Managers👋
Welcome back to another FRGNT chart update📈
Diving into some Forex setups using predominantly higher time frame order blocks alongside confirmation breaks of structure.
Let’s see what price action is telling us today!
💡Here are some trade confluences📝
✅Weekly order block
✅15' order block
✅4 hour order block
✅Tokyo ranges to be filled
🔑 Remember, to participate in trading comes always with a degree of risk, therefore as professional risk managers it remains vital that we stick to our risk management plan as well as our trading strategies.
📈The rest, we leave to the balance of probabilities.
💡Fail to plan. Plan to fail.
🏆It has always been that simple.
❤️Good luck with your trading journey, I shall see you at the very top.
🎯Trade consistent, FRGNT X

EURUSD INTRADAY Bullish continuation pattern developing Trend Overview:
EUR/USD continues to exhibit a bullish price structure, supported by a rising trendline and higher lows. Recent intraday action reflects a corrective pullback, suggesting a temporary pause within the broader uptrend.
Key Technical Levels:
Support: 1.1300 (primary), followed by 1.1235 and 1.1180
Resistance: 1.1430 (initial), then 1.1470 and 1.1500
Technical Outlook:
A pullback toward 1.1300, which coincides with the previous consolidation zone, may present a bullish continuation setup. A confirmed bounce from this level could open the path toward 1.1430, with 1.1470 and 1.1500 as potential longer-term targets.
However, a daily close below 1.1300 would indicate a breakdown of near-term bullish momentum. This scenario would increase the likelihood of a deeper correction toward 1.1235, and possibly 1.1180.
Conclusion:
The outlook for EUR/USD remains constructively bullish, contingent on the 1.1300 support holding. A bounce from this level would reinforce the uptrend. Conversely, a decisive break below 1.1300 would shift the short-term bias to bearish, suggesting further downside toward the 1.1200 area.
This communication is for informational purposes only and should not be viewed as any form of recommendation as to a particular course of action or as investment advice. It is not intended as an offer or solicitation for the purchase or sale of any financial instrument or as an official confirmation of any transaction. Opinions, estimates and assumptions expressed herein are made as of the date of this communication and are subject to change without notice. This communication has been prepared based upon information, including market prices, data and other information, believed to be reliable; however, Trade Nation does not warrant its completeness or accuracy. All market prices and market data contained in or attached to this communication are indicative and subject to change without notice.

The Day Ahead Market Watch – Tuesday, June 10 (Technical Focus)
Key Data Releases (Potential Volatility Triggers):
US
NFIB Small Business Optimism (May) – Watch for shifts in sentiment that could influence the USD and S&P 500 direction.
3-Year Note Auction – Yields could impact Treasury curve dynamics; monitor for demand strength or weakness.
UK
Average Weekly Earnings (Apr)
Unemployment Rate (Apr)
Jobless Claims Change (May)
These labor data points are pivotal for GBP crosses. Stronger wage data may support GBP/USD, especially near key resistance around 1.2800.
Japan
M2 & M3 Money Supply (May)
Machine Tool Orders (May)
Typically low volatility, but may offer insights for JPY if surprise deviation occurs.
Italy
Industrial Production (Apr) – Weakness could pressure FTSE MIB if it breaks below short-term support near 34,000.
Sweden
GDP Indicator (Apr) – May impact SEK, especially against EUR if growth deviates significantly.
Norway & Denmark
CPI (May) – Inflation data could move NOK and DKK, especially if it challenges central bank guidance.
Central Bank Speakers (Volatility Risk):
ECB: Villeroy, Holzmann, Rehn
Hawkish or dovish signals may drive short-term EUR/USD moves; key resistance to watch: 1.0900. Watch German bund yields for confirmation.
This communication is for informational purposes only and should not be viewed as any form of recommendation as to a particular course of action or as investment advice. It is not intended as an offer or solicitation for the purchase or sale of any financial instrument or as an official confirmation of any transaction. Opinions, estimates and assumptions expressed herein are made as of the date of this communication and are subject to change without notice. This communication has been prepared based upon information, including market prices, data and other information, believed to be reliable; however, Trade Nation does not warrant its completeness or accuracy. All market prices and market data contained in or attached to this communication are indicative and subject to change without notice.

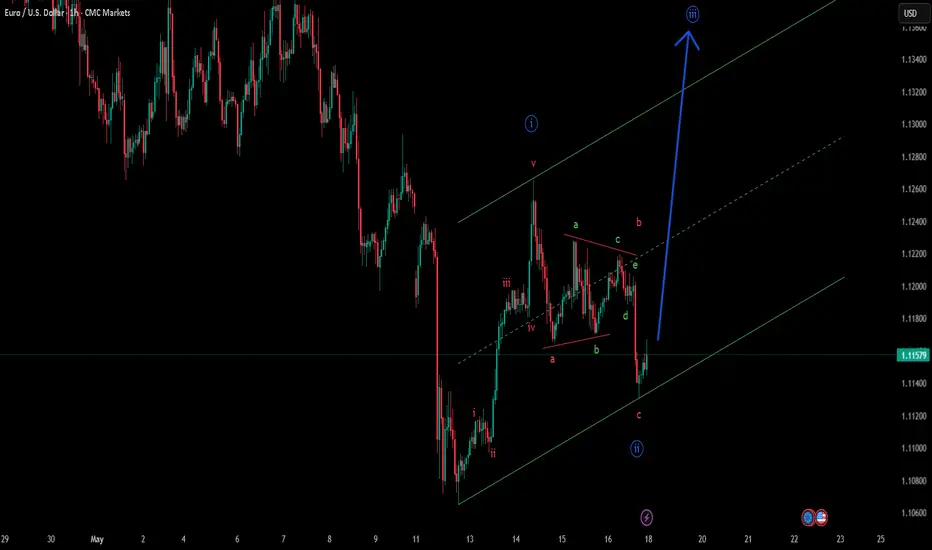
EURUSD_1DEurodollar Analysis
Daily Time Frame Medium and Long Term
Elliott Wave Analysis Style
The market is in 5 waves of ascent, which is expected to be in wave 5, which can move towards the target of 1.1717 by maintaining the price above 1.1280 and after completing 5 Elliott waves, enter a decline towards 1.0660
Important short-term number and for this week 1.1414

EURUSD SHORTeurusd short bearish price action.price rejected from the resistance thrice and continue pushing bearish.expecing more continuation of the bearish movement

EURUSDPrice has recently retraced to a key support zone and is showing bullish structure on the lower timeframes. A long position is anticipated based on the confluence of the Fibonacci retracement and recent bullish momentum.
Entry: Buy EUR/USD at current market price or upon confirmation of bullish candlestick pattern near the 50%-61.8% Fibonacci retracement zone.
Partial Take Profit: Secure partial profits at the 50% Fibonacci retracement level of the previous swing move.
Final Take Profit: Trail remaining position toward the 100% extension or next significant resistance.
Stop Loss: Below the 61.8% retracement or just under recent swing low for risk management.
Rationale: Bullish order flow combined with Fibonacci confluence suggests a potential continuation move to the upside. Taking partial profits at the 50% level ensures capital protection while allowing room for extended gains.

EUR/USD BUY LIMIT / FOREX POSITIONHERE IS eurusd SIGNAL
for you guys on live trade on 15 time frame
by chart analasis and OB + fibonacci

EURUSD Analysis (MMC Strategy) : Structure Mapping + Target🧠 Overview
This analysis is based on the MMC (Market Mapping Concept), combining smart money principles, structure mapping, and price behavior analysis. EUR/USD has been showing strong bullish activity over the past few months, but we are now approaching a critical decision zone. Let’s break it all down.
🔹 1. Arc Structure – Accumulation Phase (Dec 2024 – Feb 2025)
The chart starts with a well-defined Arc formation, signaling accumulation by large players.
Price showed a series of higher lows within the arc, compressing volatility.
This is where smart money quietly loads positions before pushing price.
Key Insight: This arc often precedes an impulsive breakout, as seen next.
🔹 2. Central Zone Breakout (Feb – Mar 2025)
The price exploded out of the arc, breaking through the central compression area.
Marked as the Central Zone, this acted as both support and a launchpad.
This phase included imbalance filling, reaccumulation, and clean price action.
Observation: Notice the aggressive bullish candles—clear indication of institutional interest.
🔹 3. Structure Mapping & QFL Zone (April 2025)
A classic QFL (Quick Flip Level) was formed after the initial rally.
Price pulled back into a structure support zone, respected it cleanly, and bounced back.
This gave a textbook smart money entry.
Structure Mapping highlights how each leg of the trend is forming based on supply/demand reaction.
🔹 4. Major BOS – Break of Structure (May 2025)
Price broke the previous swing high, giving us a Major Break of Structure.
This BOS confirms a change in character (CHOCH) from ranging to trending.
After BOS, the market retested the breakout zone—providing a second ideal long entry for continuation traders.
🔹 5. Minor Resistance Zone (Current Price)
Currently, price is testing a Minor Resistance zone around 1.1400–1.1450.
This level acted as resistance earlier and may slow price down temporarily.
However, there’s still room for bullish continuation unless reversal patterns emerge.
Key Watch Point: If price shows weakness here (e.g., rejection wicks, bearish engulfing), short-term retracement may follow.
🔹 6. Next Reversal Zone (Projected Target: 1.1700–1.1800)
The green box above marks the Next Reversal Zone, based on historical supply, Fibonacci extension levels, and structure analysis.
Expect this area to act as strong resistance unless momentum is very strong.
This is a potential TP zone for long traders or an area to scout for short opportunities if reversal signals appear (divergence, order block rejection, liquidity grab).
📌 Key Levels
Zone Price Range Role
Central Zone 1.0800–1.1000 Support/Accumulation
Minor Resistance 1.1400–1.1450 Immediate Hurdle
Next Reversal Zone 1.1700–1.1800 Target / Short Setup
QFL Zone 1.1100–1.1200 Smart Money Entry Point
🧠 Strategy Outlook
✅ Bullish Bias: Structure is clearly bullish. Buyers are in control.
🕵️♂️ Watch for Reaction at Minor Resistance – a clean break = continuation, rejection = short-term pullback.

EUR/USD – Bearish Setup with Potential Drop Toward 1.1285 and 1.EUR/USD is showing signs of exhaustion near the 1.1475 Fibonacci extension level (127.2%), with a completed five-wave impulse pattern likely followed by an ABC correction.
🔻 Bearish Scenario:
A clear 5-wave Elliott structure suggests a top might be in.
Price is now losing momentum, indicating the start of a corrective move.
If selling continues, 1.12850 will be the first key level to watch.
A break below that could open the door for a deeper correction toward 1.12286.
📉 Momentum Support:
The Detrended Oscillator shows a loss of bullish momentum, aligning with the corrective structure expectation.
🔴 Invalidation:
A break back above 1.1475 would invalidate the bearish count and suggest trend continuation.
This setup favors short opportunities on breakdown confirmation with targets at the next major supports.

EURUSD REVERSALTechnically:
EURUSD printed bearish divergence
EURUSD printed Head & Shoulder pattern

EIRISD H1 I Bearish Reversal Based on the H1 chart, the price is rising toward our sell entry level at 1.1418, a pullback resistance.
Our take profit is set at 1.1379, a swing low support.
The stop loss is set at 1.1456, a swing high resistance.
High Risk Investment Warning
Trading Forex/CFDs on margin carries a high level of risk and may not be suitable for all investors. Leverage can work against you.
Stratos Markets Limited (tradu.com ):
CFDs are complex instruments and come with a high risk of losing money rapidly due to leverage. 63% of retail investor accounts lose money when trading CFDs with this provider. You should consider whether you understand how CFDs work and whether you can afford to take the high risk of losing your money.
Stratos Europe Ltd (tradu.com ):
CFDs are complex instruments and come with a high risk of losing money rapidly due to leverage. 63% of retail investor accounts lose money when trading CFDs with this provider. You should consider whether you understand how CFDs work and whether you can afford to take the high risk of losing your money.
Stratos Global LLC (tradu.com ):
Losses can exceed deposits.
Please be advised that the information presented on TradingView is provided to Tradu (‘Company’, ‘we’) by a third-party provider (‘TFA Global Pte Ltd’). Please be reminded that you are solely responsible for the trading decisions on your account. There is a very high degree of risk involved in trading. Any information and/or content is intended entirely for research, educational and informational purposes only and does not constitute investment or consultation advice or investment strategy. The information is not tailored to the investment needs of any specific person and therefore does not involve a consideration of any of the investment objectives, financial situation or needs of any viewer that may receive it. Kindly also note that past performance is not a reliable indicator of future results. Actual results may differ materially from those anticipated in forward-looking or past performance statements. We assume no liability as to the accuracy or completeness of any of the information and/or content provided herein and the Company cannot be held responsible for any omission, mistake nor for any loss or damage including without limitation to any loss of profit which may arise from reliance on any information supplied by TFA Global Pte Ltd.
The speaker(s) is neither an employee, agent nor representative of Tradu and is therefore acting independently. The opinions given are their own, constitute general market commentary, and do not constitute the opinion or advice of Tradu or any form of personal or investment advice. Tradu neither endorses nor guarantees offerings of third-party speakers, nor is Tradu responsible for the content, veracity or opinions of third-party speakers, presenters or participants.

Fundamental Market Analysis for June 10, 2025 EURUSDAn Event to pay attention today:
13:00 EET. USD - NFIB Small Business Optimism Index
EURUSD:
The EUR/USD pair is struggling to capitalise on the previous day's gains and is attracting new sellers around 1.1435 during Tuesday's Asian session. The intraday decline is driven by solid demand for the US dollar (USD) and has pushed spot prices below 1.1400 in the last hour.
Friday's US non-farm payrolls (NFP) report, which showed higher-than-expected data, dampened hopes for an early interest rate cut by the Federal Reserve (Fed) this year. This, along with optimism about the resumption of trade talks between the US and China, is prompting traders to ease their bearish bets on the US dollar, which is proving to be a key factor putting pressure on the EUR/USD pair. However, as negotiations continued into a second day in London, traders may refrain from aggressive directional bets.
In addition, traders still see a rate cut by the US central bank in September as more likely. This, along with concerns about the financial health of the US government, may limit further strengthening of the US dollar and provide support for the EUR/USD pair. In contrast, the European Central Bank (ECB) hinted at the end of its rate-cutting cycle at its meeting last week. This could further benefit the single currency and help limit losses for the currency pair.
Traders may also refrain from aggressive betting ahead of this week's US inflation data release.
Trading recommendation: SELL 1.1390, SL 1.1410, TP 1.1300

EURUSD LONGI’ve been seeing some accumulation now below and above and there’s a lot of sellers above waiting for price to drop which it should but maybe not right now as I don’t see the pressure for it . So I’m long for today then most likely short for the rest of the week and this month .

eurusd 1:35 short todayshorty entry today june10.
short swing trade
expect the entry above the noted highs

Sideways movement on EURUSDEURUSD continues to trade within the range set by Friday’s news.
Tomorrow’s upcoming news is likely to trigger bigger moves.
Until then, there’s no clear reason to enter new positions.
Keep an eye out for potential trend continuation opportunities once the current correction ends.

EURUSD – Still a chance to rebound if support holdsEURUSD has recently pulled back slightly after approaching resistance near the rising trendline. Currently, price is heading back to retest the support zone around 1.13200 – a key confluence area with the EMA89 and previous swing lows. This is a crucial level. If it holds, there’s a strong possibility for a rebound toward the 1.14280 resistance area.
On the H4 timeframe, the price structure remains within an ascending channel with no clear signs of trend reversal. The formation of higher lows suggests that buying pressure is still present. Notably, if this week’s CPI, PPI, and NFP data come in weaker than expected, market sentiment may shift further toward the idea of an early Fed rate cut – potentially providing a lift for EURUSD.
Additionally, rising geopolitical tensions could increase risk aversion, weakening the USD and further supporting the euro.

Patience needed for this pair - EURUSDI like this pair for a simple reason - it is relatively slow moving and it suits traders who have a lower risk appetite and helps to sleep better at night. A 50 points SL is sufficient to let this pair runs for days/weeks without getting stopped out in my case.
Weekly and daily time frame, it is registering a bullish stance so down to 4H, we just need to be patient.

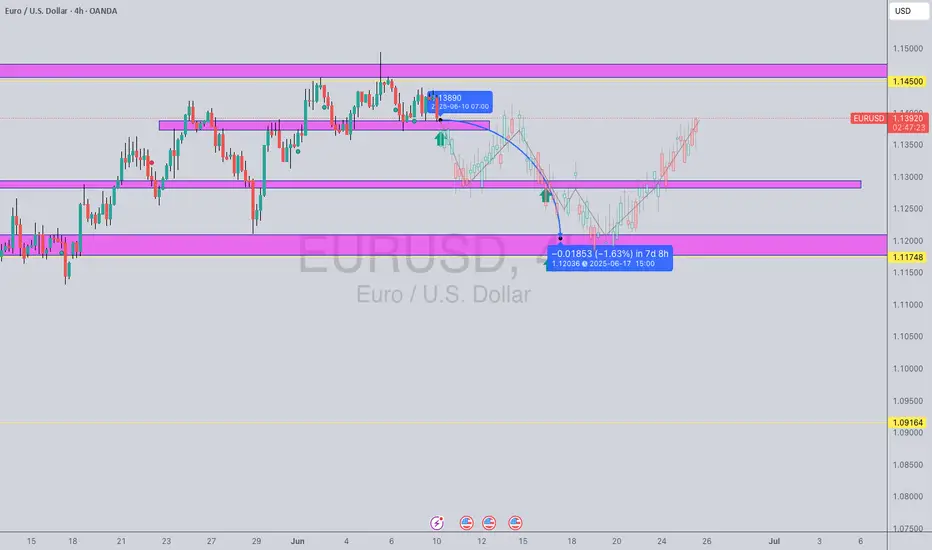
Based on the provided EURUSD 4-hour chart, here's a simple tradeCurrent Situation:
The price is currently at 1.13869, trading within a resistance zone (indicated by the pink shaded area around 1.13700 - 1.14000).
Previously, the price reacted strongly to this area, leading to a significant drop.
There's a clear upward trend leading into this resistance zone.
Potential Trade Scenarios:
1. Short Entry (Bearish Reversal):
Rationale : The price is at a significant resistance level that has caused a strong bearish reaction in the past. If this resistance holds, we could see a repeat of the previous downtrend.
Entry Signal: Look for clear bearish candlestick patterns (e.g., engulfing pattern, pin bar, or rejection candle) forming within or just below the resistance zone (around 1.13700 - 1.14000) . A break and retest of the lower boundary of this resistance could also be an entry.
Target: The next major support zone appears to be around 1.11748 - 1.12000.
Stop Loss: Place the stop loss just above the current resistance zone, perhaps around 1.14200 - 1.14500 , to account for potential false breakouts.
2. Long Entry (Bullish Breakout Continuation):
Rationale: If the current bullish momentum is strong enough to break through this resistance, it could signal a continuation of the upward trend.
Entry Signal: Wait for a confirmed breakout above the resistance zone (e.g., a 4-hour candle closing clearly above 1.14000 - 1.14200). A retest of the broken resistance as new support would offer a higher-probability entry.
Target: The next major resistance level is not immediately visible on this chart, but you would look for the next supply zone or previous swing highs.
Stop Loss: Place the stop loss below the broken resistance, which would now act as support, perhaps around 1.13500.
Key Considerations Before Entry:
Confirmation: Do not enter solely based on the price reaching the zone. Always wait for a clear candlestick confirmation or a break and retest.
Volume (if available): Higher volume on a breakout or rejection can add conviction to the move.
News Events: Be aware of any upcoming high-impact news events that could affect EURUSD.
Risk Management: Always define your stop loss and position size before entering any trade.
eur/usd TRADE 5 just a quick one to have a look at the market on where eur/usd will go i belive is going short to a level of support, to then reach a new high we see where it goes
