EURUSD Technical Outlook Bearish TrendEURUSD Technical Outlook – 4H Timeframe
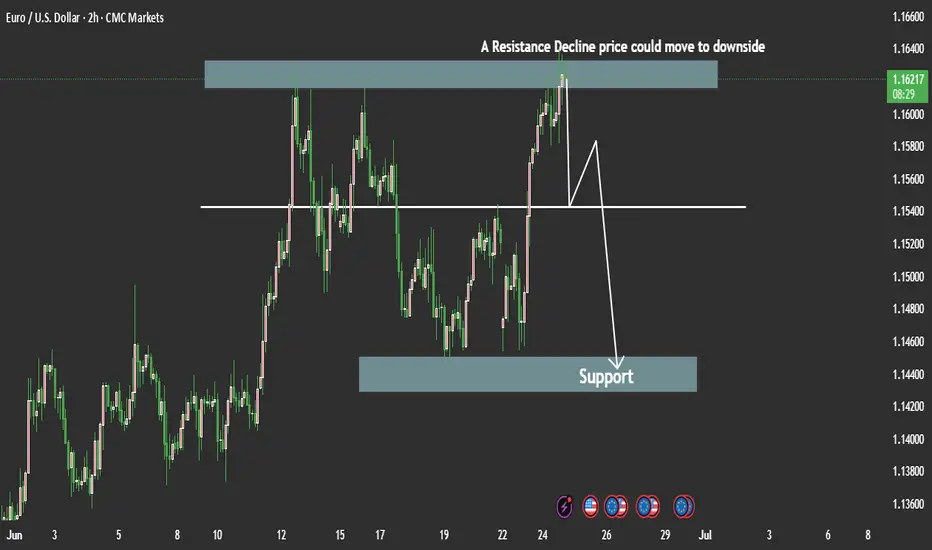
EURUSD has been pushing higher over the past few sessions, reaching a key liquidity zone. On the 4-hour chart, we’ve observed a clean sweep of previous highs, indicating a potential liquidity grab.
From this zone, there's a high probability of a downside move, especially if the price fails to sustain above this level. Any bounce from this zone that lacks momentum may signal bullish exhaustion, opening the door for sellers to step in.
Resistance zone 1.16500
Support zone 1.14500
You may find more details in the chart Ps Support with like and comments for more analysis Thanks.
USDEUX trade ideas
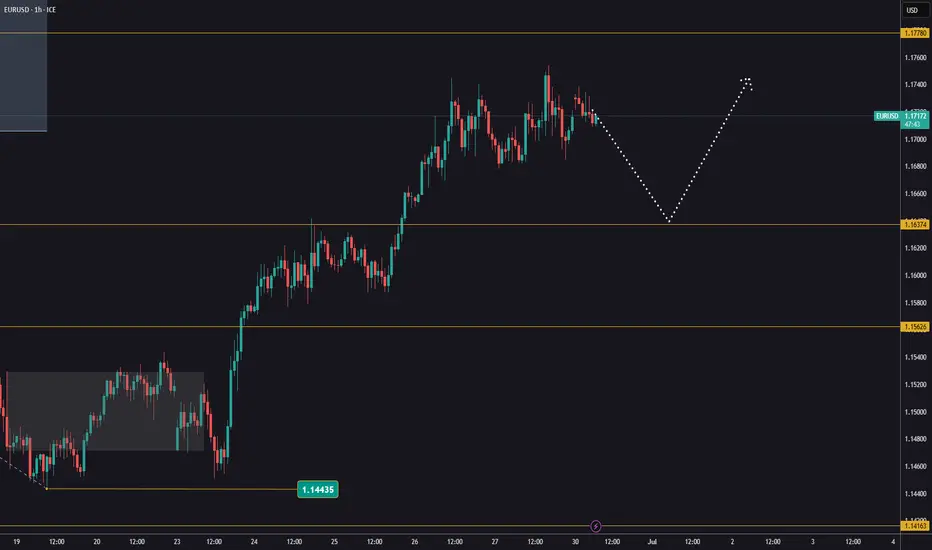
EURUSD pullbackEURUSD remains above 1,1700 on the final day of the quarter.
This week, all eyes are on the upcoming U.S. jobs data, set to be released on Thursday due to the market holiday on Friday.
Watch for a potential pullback, which could offer a new buying opportunity.
Key support levels are at 1,1635 and 1,1562.
The goal: continuation of the trend and a new high.
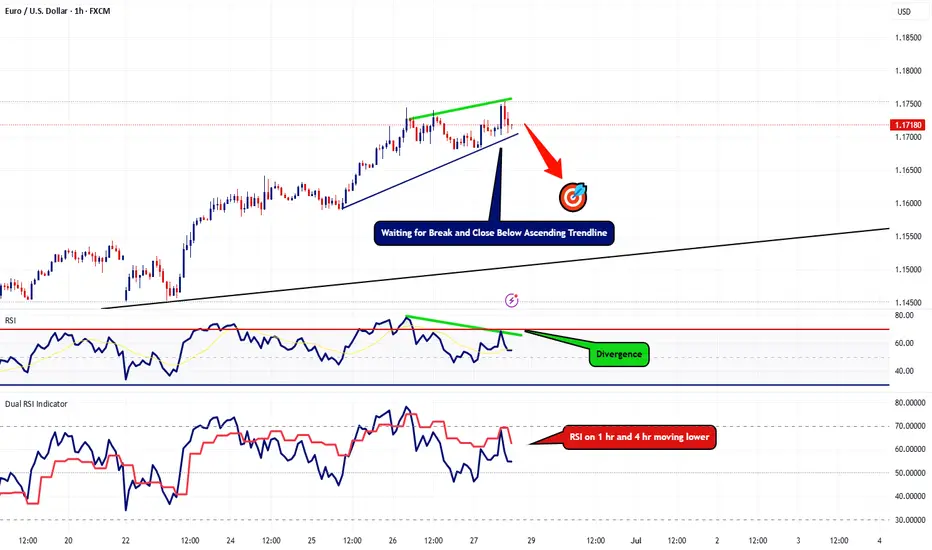
EURUSD Lots of Bearish Clues Popping UpThis is an update to my last post, I'm still waiting for that 4hr candle to close below the last. However, now I'm starting to spot more bearish indications on the 1hr timeframe.
First thing I'm noticing is the RSI divergence show that the bullish strength is weakening. RSI on the 4hr + the 1hr are heading lower. Now I'm still waiting for that 4 hour to close below the last but I also want to see this ascending trendline break and hold below as well.
In the event we break below this trendline, I'll be looking to go short with my target plotted on the chart.
EURUSD SELL SIGNALThe EURUSD is currently trading within an ascending angle channel. Price currently approaches the edge of the channel.
STOP LOSS - 1.18261
TP - 1.16000( Major support line)
Swing trade - Possible trade completion time { 5 -10days}
Risk wisely.

EUR/USD likely movementI wonder how during a historic recession and possible collapse of the European Union, the euro continues to rise. One thing is for sure, something dark is coming.
EURUSD Sell Channel Strong Selling From Key Resistance 1.15200EURUSD Technical Update
Pair is respecting the descending channel and showing strong selling pressure from key resistance at 1.15200.
1H Time Frame Outlook
🔻 Target 1: 1.14700
🔻 Target 2: 1.14000
Momentum favors the bears as long as price remains below resistance.
💬 Drop your thoughts below,
📈 Like, follow, and join us for more real-time updates and insights!
— Livia 😜

Euro can drop from wedge, breaking support levelHello traders, I want share with you my opinion about Euro. The price previously started a confident upward movement, breaking out from the buyer zone around 1.1075 and forming an upward wedge pattern. As the trend continued, EUR pushed through the support area and traded inside the wedge, showing multiple bounces from the support line. Eventually, the pair reached the resistance line at the top of the wedge and then reversed. After a short correction, it tried to rebound again but failed to create a new high. The market then pulled back into the support area 1.1455 - 1.1410 and is now testing that level once more. Currently, the Euro is trading just above the support area, and we may see a short-term rebound from here. However, given the overall structure, I expect the price to break the support level and exit the wedge pattern to the downside. In my opinion, this breakout will initiate a strong bearish wave, targeting the 1.1250 points, which is where I’ve set my TP 1. Given the pattern structure, recent lower highs, and the weakening bullish momentum, I remain bearish and anticipate further decline once support is broken. Please share this idea with your friends and click Boost 🚀
Disclaimer: As part of ThinkMarkets’ Influencer Program, I am sponsored to share and publish their charts in my analysis.

EURUSD: at key resistance: Will price rebound to 11300?Quick recap on EURUSD, seriously déjà vu of my previous analysis on EURUSD - once again we see the price coming towards the same resistance level. This is a level where it has struggled to break through and reversed nicely to the downside as expected. For me it's definitely one to monitor, especially for anyone considering short trades.
If we start seeing signs that the price is getting rejected here: like long wicks, bearish candles, or buyers starting to lose momentum, I think we could see a move down toward the 1.11300 level. I am targeting a slight bounce like before, nothing major. But if price cleanly breaks out, that would rule out the bearish outlook and suggest even further upside will follow.
This area is pretty important and could give us a better idea of where price is headed next.
Just sharing my thoughts on support and resistance, this isn’t financial advice. Always confirm your setups and manage your risk properly.

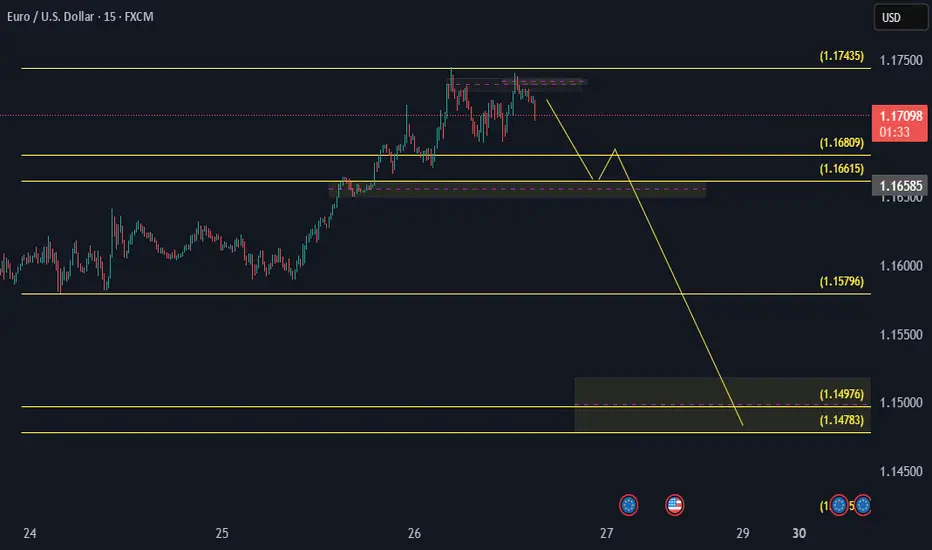
EURUSD – Short-Term Top Signal, Sellers Getting ReadyEURUSD has reached the upper boundary of the ascending channel around 1.17190 and immediately faced selling pressure. This zone previously acted as a strong reversal area, and with a rejection candlestick and a forming FVG, the risk of a downward correction is increasing.
Currently, the price is moving sideways just below the high, forming lower highs — suggesting a possible distribution pattern before breaking the bullish structure. If price breaks below the FVG zone near 1.165–1.166, the move could extend toward the technical target at 1.15900 — aligning with the channel bottom and a historical liquidity area.
Recent fundamental drivers:
U.S. economic data remains strong (Jobless Claims, Core PCE) → supports USD strength
The ECB remains cautious and hasn’t committed to further rate hikes → slightly weakens the euro


EURUSD INTRADAY TRADE 30PIPS SHORT LIVE TRADE EUR/USD eases below 1.1800 ahead of Eurozone inflation data
EUR/USD is retreating below 1.1800 in the European morning on Tuesday. The pair faces headwinds from a pause in the US Dollar downtrend. Traders move on the sidelines ahead of the Eurozone prelim inflation data and central bank talks due later in the day.

EUR/USD Rally Continues – 1.18000 in SightHi Everyone,
As outlined in our analysis last week, we anticipated a continued move higher toward the 1.16564 and 1.18325 levels, provided price held above 1.14483.
Price respected this level, and EUR/USD extended its rally, reaching our first key target at 1.16564 and pushing above 1.17400 — marking the highest level since February 2022.
A successful bounce from above 1.16680 or slightly lower at 1.15998 would offer near-term support for a potential retest of the 1.17400 zone. A confirmed break above this resistance could pave the way for a move toward 1.18000, where we anticipate encountering dynamic resistance.
We will provide further updates on the projected path for EUR/USD should price reach this level.
The longer-term outlook remains bullish, with expectations for the rally to extend toward the 1.2000 level, provided the price holds above the key support at 1.10649.
We will continue to update you throughout the week with how we’re managing our active ideas and positions. Thanks again for all the likes/boosts, comments and follows — we appreciate the support!
All the best for a good end to the week. Trade safe.
BluetonaFX

Market next move
🔁 Disruption of the Current Analysis
1. False Breakout Scenario
The chart assumes a bullish move breaking resistance before a bearish reversal.
Disruption: This could be a false breakout, where the price appears to break above resistance but lacks strong volume and momentum. Traders get trapped long, and the price quickly reverses below resistance, invalidating the bullish leg entirely.
2. Stronger Uptrend Continuation
Despite calling for a bearish target, the overall trend appears strong with higher highs and higher lows.
Disruption: Instead of a retracement, EUR/USD could break through the resistance zone convincingly, possibly reaching 1.1750–1.1800, supported by:
Increasing volume
Bullish candles closing above resistance
No signs of bearish divergence on RSI/MACD (if added)
3. Fundamental Factors
The chart ignores macro data.
Disruption: If upcoming EU economic data is stronger than expected, or if US data disappoints, the euro could strengthen further.
Upcoming events with the euro and US flags suggest possible volatility.
4. Volume Contradiction
Recent bullish candles are supported by strong volume, suggesting accumulation.
Disruption: If smart money is accumulating positions, this would support further bullish continuation, not reversal.

Bullish rise?The Fiber (EUR/USD) has reacted off the pivot and could rise to the 1st resistance.
Pivot: 1.1578
1st Support: 1.1278
1st Resistance: 1.1909
Risk Warning:
Trading Forex and CFDs carries a high level of risk to your capital and you should only trade with money you can afford to lose. Trading Forex and CFDs may not be suitable for all investors, so please ensure that you fully understand the risks involved and seek independent advice if necessary.
Disclaimer:
The above opinions given constitute general market commentary, and do not constitute the opinion or advice of IC Markets or any form of personal or investment advice.
Any opinions, news, research, analyses, prices, other information, or links to third-party sites contained on this website are provided on an "as-is" basis, are intended only to be informative, is not an advice nor a recommendation, nor research, or a record of our trading prices, or an offer of, or solicitation for a transaction in any financial instrument and thus should not be treated as such. The information provided does not involve any specific investment objectives, financial situation and needs of any specific person who may receive it. Please be aware, that past performance is not a reliable indicator of future performance and/or results. Past Performance or Forward-looking scenarios based upon the reasonable beliefs of the third-party provider are not a guarantee of future performance. Actual results may differ materially from those anticipated in forward-looking or past performance statements. IC Markets makes no representation or warranty and assumes no liability as to the accuracy or completeness of the information provided, nor any loss arising from any investment based on a recommendation, forecast or any information supplied by any third-party.

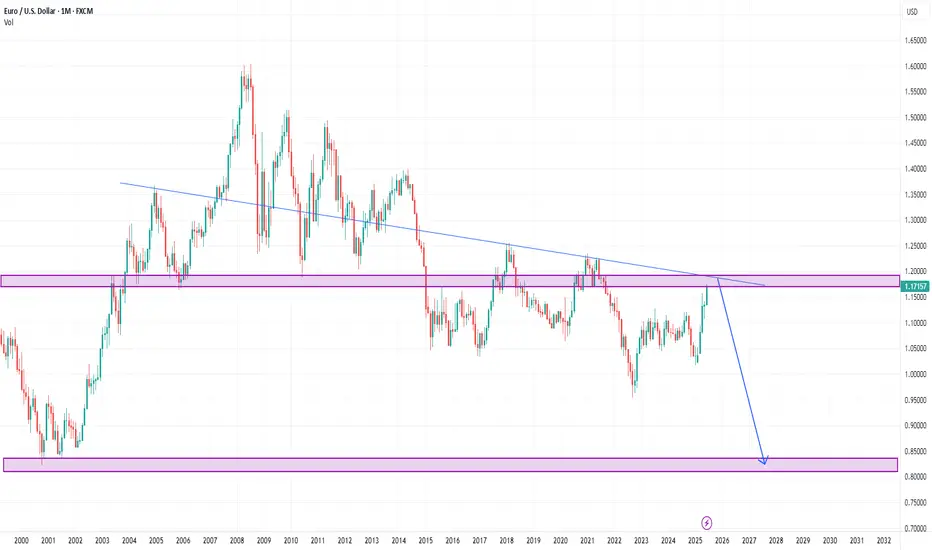
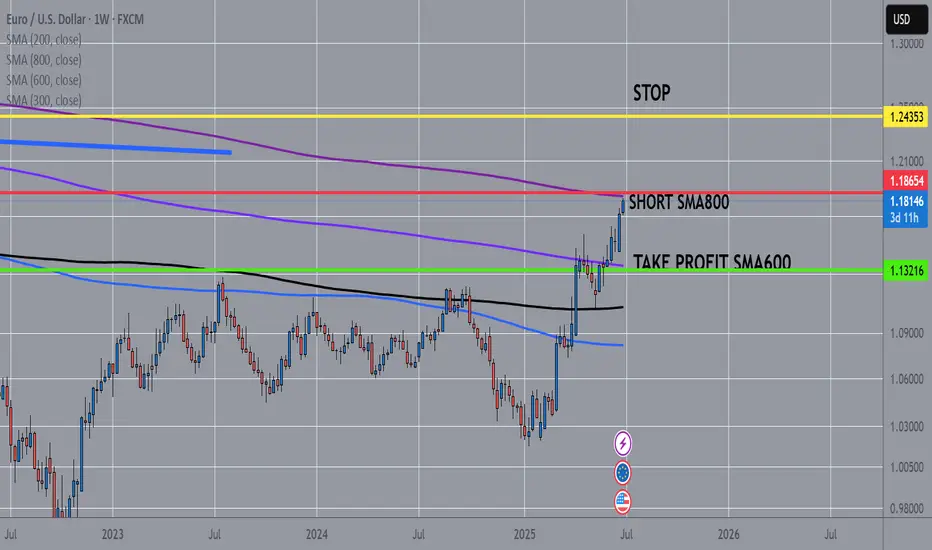
EURUSD Major event Short Weekly ChartWe may be on the verge of a major event in the forex market.
The EUR/USD is approaching its 800-week moving average, a level that historically marks significant turning points.
A sharp reversal is likely, with an initial target at the 600-week moving average, and potentially a much deeper decline beyond that.
Bullish continuation for the Fiber?The price is falling towards the pivot point, which is a pullback support, and could bounce to the 1st resistance, which is also a pullback resistance.
Pivot: 1.1630
1st Support: 1.1591
1st Resistance: 1.1692
Risk Warning:
Trading Forex and CFDs carries a high level of risk to your capital and you should only trade with money you can afford to lose. Trading Forex and CFDs may not be suitable for all investors, so please ensure that you fully understand the risks involved and seek independent advice if necessary.
Disclaimer:
The above opinions given constitute general market commentary, and do not constitute the opinion or advice of IC Markets or any form of personal or investment advice.
Any opinions, news, research, analyses, prices, other information, or links to third-party sites contained on this website are provided on an "as-is" basis, are intended only to be informative, is not an advice nor a recommendation, nor research, or a record of our trading prices, or an offer of, or solicitation for a transaction in any financial instrument and thus should not be treated as such. The information provided does not involve any specific investment objectives, financial situation and needs of any specific person who may receive it. Please be aware, that past performance is not a reliable indicator of future performance and/or results. Past Performance or Forward-looking scenarios based upon the reasonable beliefs of the third-party provider are not a guarantee of future performance. Actual results may differ materially from those anticipated in forward-looking or past performance statements. IC Markets makes no representation or warranty and assumes no liability as to the accuracy or completeness of the information provided, nor any loss arising from any investment based on a recommendation, forecast or any information supplied by any third-party.

EURO - Price can continue to decline inside wedge patternHi guys, this is my overview for EURUSD, feel free to check it and write your feedback in comments👊
Some days ago, price tried to grow, but failed and dropped below $1.1220 support level, after which started to grow in channel.
In rising channel, price broke $1.1220 level one more time and then rose to resistance line and then corrected.
Next, Euro rose to $1.1455 level and some time traded inside this level, until it broke it and continued to move up.
Price exited from rising channel and later started to decline inside wedge pattern, where it declined to $1.1455 level.
Recently, price bounced from this level and in a short time rose to resistance line of wedge pattern.
In my mind, Euro can continue to decline to $1.1400 support line of wedge, breaking support level.
If this post is useful to you, you can support me with like/boost and advice in comments❤️
Disclaimer: As part of ThinkMarkets’ Influencer Program, I am sponsored to share and publish their charts in my analysis.


MarketBreakdown | EURUSD, GBPUSD, USDJPY, USDCHF
Here are the updates & outlook for multiple instruments in my watch list.
1️⃣ #EURUSD weekly time frame 🇪🇺🇺🇸
The pair is unstoppable.
The market violated a significant weekly resistance cluster last week.
It opens more growth potential after a pullback.
2️⃣ #GBPUSD weekly time frame 🇬🇧🇺🇸
In comparison to EURUSD, GBPUSD is now approaching a major
resistance area. I think that we can expect a retracement from that.
3️⃣ #USDJPY daily time frame 🇺🇸🇯🇵
The market continues a correctional movement lower.
The closest strong support that I see is based on a rising trend line.
I think that buying interest may spark again after its text.
4️⃣ #USDCHF daily time frame 🇺🇸🇨🇭
The price updated a historic low on Friday.
The next strong support that I see is based on a falling trend line.
We can expect a pullback from that.
Do you agree with my market breakdown?
❤️Please, support my work with like, thank you!❤️
I am part of Trade Nation's Influencer program and receive a monthly fee for using their TradingView charts in my analysis.

EURUSD Sell- Go for sell
- Refine entry with smaller SL for better RR, if you know how
- keep looking for sell even if price goes one more up
A Message To Traders:
I’ll be sharing high-quality trade setups for a period time. No bullshit, no fluff, no complicated nonsense — just real, actionable forecast the algorithm is executing. If you’re struggling with trading and desperate for better results, follow my posts closely.
Check out my previously posted setups and forecasts — you’ll be amazed by the high accuracy of the results.
"I Found the Code. I Trust the Algo. Believe Me, That’s It."

EUR/USD BEARS WILL DOMINATE THE MARKET|SHORT
EUR/USD SIGNAL
Trade Direction: short
Entry Level: 1.161
Target Level: 1.141
Stop Loss: 1.174
RISK PROFILE
Risk level: medium
Suggested risk: 1%
Timeframe: 10h
Disclosure: I am part of Trade Nation's Influencer program and receive a monthly fee for using their TradingView charts in my analysis.
✅LIKE AND COMMENT MY IDEAS✅

EURUSD SHORT TIME O LOSS TIMEI opened a long position on the EURUSD pair at 1.17195 with 10 lots.
Target: 1.174 – If the target is reached, I will take profit and open a short position.
At the same time, expecting USD weakness, I also opened a short position at 1.17200 with 20 lots.
1.168 to 1.166 is a strong support zone.
If price reaches 1.174 and I have an active short, I will close the 1.17200 short and keep the other one.
Targets and support levels are marked on the chart – I plan to close the positions gradually.
I will close 75% of the position at the 1.149 support level.
This is a demo account – I’m practicing in order to qualify for a funded trading account.
Depending on my success rate, I plan to start trading live on Forex.
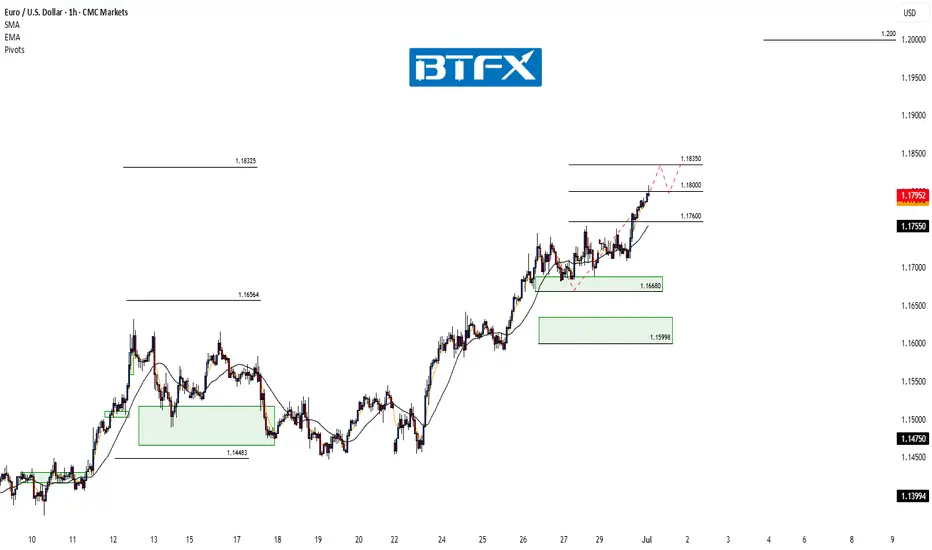
EUR/USD Extends Rally – Watching Resistance at 1.18000Hi Everyone,
We anticipated a retest of the 1.17400 level coming into this week, setting the stage for further upside toward our highlighted targets at 1.17600 and 1.18000. Monday delivered, with a sharp move higher that saw EUR/USD break cleanly above 1.17400 and extend to 1.17600, bringing the 1.18000 level into focus.
As previously noted, we expect dynamic resistance around the 1.18000 area and will provide further updates on the projected path for EUR/USD should price test or breach this level.
The longer-term outlook remains bullish, with expectations for the rally to extend towards the 1.2000 level, provided the price holds above the key support at 1.10649.
We will continue to update you throughout the week with how we’re managing our active ideas and positions. Thanks again for all the likes/boosts, comments and follows — we appreciate the support!
All the best for a good end to the week. Trade safe.
BluetonaFX