EURUSD bullish swing setup on 1HWe have bullish bias on EURUSD, daily and all TF bellow are bullish. Currently we sitting at low point and good idea to pick buy trade. We have 15 min bullish divergence. We already on breakeven.
USDEUX trade ideas

EURUSD Sell SetupBy: MJTrading:
EUR/USD has rallied into a significant resistance zone, approaching the upper boundary of a rising wedge/channel pattern. The price is now hovering around a key confluence zone, where trendline resistance and horizontal supply intersect ( 1.16300 —1.16500 )
There are to possible scenarios:
1) If the price Rejects directly from previous High
🔹 Position 1: Sell Stop @ 1.15915
🛑 Stop Loss: 1.6375
🎯 Take Profit: 1.5454
R/R:1
isk Level: Medium
2) If price tries to reach the boundary of the wedge or make a Fake breakout:
🔹🔹 Position 2: Sell Limit @ 1.16300
🛑 Stop Loss: 1.6930
🎯 Take Profit: 1.5000
R/R:2
Risk Level: Low
📌 This zone offers a high-probability reversal setup
📉 Why it Matters:
Price action shows signs of exhaustion after a parabolic move.
EMA structure is stretched, hinting at a potential pullback.
Lets ZOOM OUT:
Daily Chart:
ZOOM IN:
Stay disciplined, let price come to you, and manage risk.
—
#EURUSD #ForexSetup #TradingStrategy #TechnicalAnalysis #ChartPattern #FXTrading #ShortTrade #MJTrading #BearishReversal #PriceAction #SwingTrade #ForexIdeas #Trendlines #BreakoutOrFakeout #RiskReward

Eurusd Fall ContinuesThe EURUSD extended its recent uptrend yesterday, briefly pushing to the highest level since October 2021, but the move stalled just above 1.16297, the June high and the high for the year. Today’s price action again approached that high but was unable to break above, turning the market lower and back toward a familiar swing area that has defined recent resistance.

EURUSD Under Pressure Amid Geopolitical TensionsEURUSD – Technical Overview
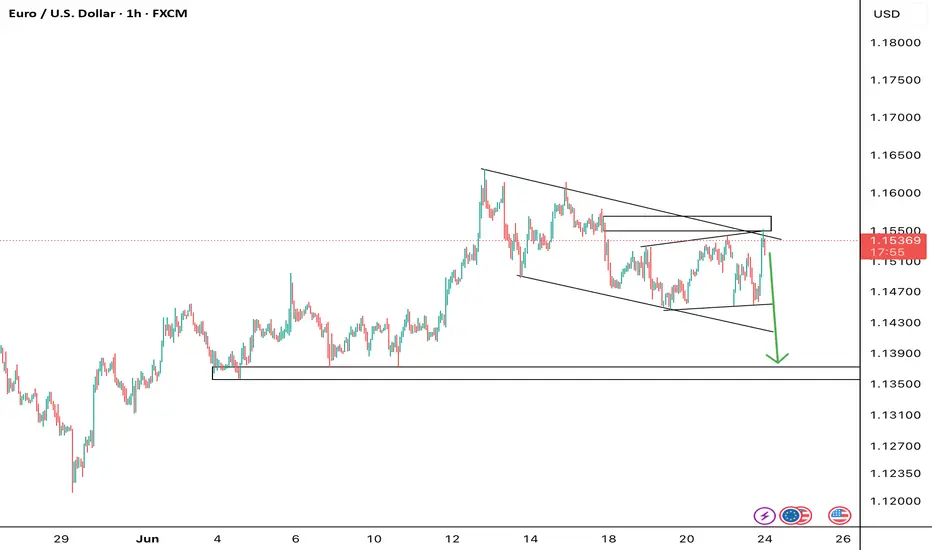
EUR/USD is currently trading below the pivot zone at 1.1530, indicating a continuation of the bearish trend.
If the price remains below 1.1450, we may see an extension of the downtrend toward 1.1373, and potentially 1.1270.
However, if the pair holds above 1.1450, it may regain bullish momentum toward 1.1558 and 1.1625.
Geopolitical tensions in the Middle East could impact EUR/USD if the situation escalates, increasing risk-off sentiment and USD demand.
Key Levels:
• Pivot: 1.1530
• Support: 1.1450 / 1.1373 / 1.1270
• Resistance: 1.1558 / 1.1625 / 1.1675


#AN009: US attacks IRAN, what will happen?
On June 22, 2025, the United States launched air strikes on three Iranian nuclear sites (Fordow, Natanz, Isfahan), using bunker-buster bombs and Tomahawk missiles, some dropped by B-2 stealth bombers
President Trump declared that the facilities were “completely and totally obliterated”
📈 Tensions and geopolitical context
Tehran responded with missiles aimed at Israel and promised “tough responses”
The UN and key figures such as Guterres and Medvedev have defined the action as a dangerous escalation with the risk of a new conflict on a regional scale.
Israel supported the attacks, while Iran convened the UN Security Council to condemn the aggression.
💥 Market Impact
⚡ Energy Sector
Oil prices jump towards $90–100 per barrel on fears of flows from Iran and potential closures of the Strait of Hormuz.
Investors reacted with a move towards safe haven assets such as the Dollar, Gold and Treasuries.
📊 Equities and sensitive sectors
Starts on an uncertain tone: S&P500 and Nasdaq futures “volatile open”, with penalties on travel and tech, and increases on energy and defense.
Gulf markets open slightly higher (Saudi, Qatar, Bahrain, Kuwait), thanks to the attenuation of initial sell-offs.
🌍 Global economic impact
Weakening predictions from the World Bank, IMF and OECD predict an economic slowdown due to energy shocks and increased global tensions.
📌 Currency and Forex Scenario
USD has gained ground as a safe haven asset, benefiting from Safety flows.
Commodity-linked pairs, such as AUD/USD, NZD/USD and CAD/USD, will be pressured by rallying oil.
Potential increase in volatility on EUR/USD and GBP/USD: they rotate towards safe haven and US/China political risk.
📣 What to watch out for
Daily and H4 candlesticks in EUR/USD and GBP/USD to understand if support holds under geopolitical stress.
Volatility indicators (VIX | MOVE) are rising, it is useful to calibrate the size and prefer structured trades.
In the coming days it will be essential to monitor:
Reuters/Bloomberg for updates on possible sanctions or public retaliation.
ASEAN and Asia for regional reactions on energy supplies.
Central banks on inflation expectations due to high oil.
💡 Conclusions – Market and Forex Impact
This military action represents a classic geopolitical shock: rising dollar and defensive assets, pressure on oil and high volatility on stock markets and exchange rates. Unlike Israeli attacks, the direct entry of the US increases the degree of macro uncertainty.
For Forex traders:
USD Index: potential rebound within the bullish trend channel
Pairs with commodities: activate strategies on breakout key levels (e.g. AUD/USD, CAD/USD)
Anti-USD FX (EUR, GBP, JPY): under pressure and to be used in range rebound.
For the equity sector:
Rotation towards defensive sectors, defense, energy.
Possible entry into government bonds as a high inflation/political hedge.
Overall, the impact is clear: increased geopolitical risk → high volatility → shift towards USD/safe haven asset → penalization of sensitive assets.

Uptrend on EURUSDEURUSD has moved higher and is now testing the previous high.
This confirms the analysis and opens up additional buying opportunities.
Reduce the risk on all active buy positions as the analysis plays out.
Additional entries can be considered after a pullback or a breakout followed by a retest.
The next target is 1,1706!

EURUSD LONG FORECAST Q2 W26 D23 Y25EURUSD LONG FORECAST Q2 W26 D23 Y25
Professional Risk Managers👋
Welcome back to another FRGNT chart update📈
Diving into some Forex setups using predominantly higher time frame order blocks alongside confirmation breaks of structure.
Let’s see what price action is telling us today!
💡Here are some trade confluences📝
✅Daily order block
✅15' order block
✅Intraday breaks of structure
✅4H Order block
🔑 Remember, to participate in trading comes always with a degree of risk, therefore as professional risk managers it remains vital that we stick to our risk management plan as well as our trading strategies.
📈The rest, we leave to the balance of probabilities.
💡Fail to plan. Plan to fail.
🏆It has always been that simple.
❤️Good luck with your trading journey, I shall see you at the very top.
🎯Trade consistent, FRGNT X

EURUSD: Market of Buyers
The charts are full of distraction, disturbance and are a graveyard of fear and greed which shall not cloud our judgement on the current state of affairs in the EURUSD pair price action which suggests a high likelihood of a coming move up.
Disclosure: I am part of Trade Nation's Influencer program and receive a monthly fee for using their TradingView charts in my analysis.
❤️ Please, support our work with like & comment! ❤️

EURUSD Eyes Higher HighsHi there,
The EUR/USD is showing a bullish setup on the 30-minute chart, with two key price targets in focus and an upside bias toward 1.16867.
I’ve seen a completed ABC corrective pattern, followed by a significant low at point D. This suggests that the recent correction may be over. If momentum continues, the pair could rally from current levels, potentially breaking above the previous swing high at point C to form a new higher high.
Immediate resistance levels to watch are 1.16016 and 1.16311, with the main bullish target at the 0.618 Fibonacci extension near 1.16867. If price holds above the recent low and maintains upward momentum, we can anticipate that these targets remain in play.
Happy Trading,
K.
Not trading advice.


EUR/USD 3-Year Highs Nears Fibo ResistanceThe Fibonacci retracement drawn from the 2021-2022 move in EUR/USD has continued to produce inflections in the pair. It caught the high in 2023 at the 61.8% retracement of 1.1275. And then last year, it set the low in April that led into a vigorous bounce into the end of Q3. Along the way, the 50% marker of that major move was a sticking point producing multiple inflections on both sides of the pair.
And then as EUR/USD came into 2025 sliding lower, it was the 23.6% retracement that came into play to catch the lows at the 1.0200 handle in January. In February, bulls held a higher-low just above that price and by March, prices were ready to jump-higher.
More recently it was the 61.8% retracement at 1.1275 that was back in the picture and with EUR/USD breaking out now to fresh three-year-highs, the look goes up to the next level in the Fibonacci sequence at 1.1686, which is the 76.4% retracement from that same major move.
Notably, EUR/USD is back into overbought territory on weekly RSI and there's also a rising wedge here, often approached with aim of bearish reversal. All that said, bulls are still making the push but if we do see a USD turn stage around quarter-end or the start of Q3, I think EUR/USD remains one of the more attractive venues to seek that out. Meanwhile, both GBP/USD and USD/CAD remain of attraction for USD-weakness to continue. - js


EUR/USD BEARS WILL DOMINATE THE MARKET|SHORT
EUR/USD SIGNAL
Trade Direction: short
Entry Level: 1.161
Target Level: 1.141
Stop Loss: 1.174
RISK PROFILE
Risk level: medium
Suggested risk: 1%
Timeframe: 10h
Disclosure: I am part of Trade Nation's Influencer program and receive a monthly fee for using their TradingView charts in my analysis.
✅LIKE AND COMMENT MY IDEAS✅

EURUSD ShortLive Analysis – EURUSD
Market Structure: Price has tapped into the Daily Market Structure zone.
Price Action: Current structure and price action suggest a potential reversal is in play.
Strategy: This is a Structure-to-Structure trade setup.
Targets:
Lower liquidity pools beneath current price
Main Target: Weekly structured liquidity resting at the dotted line
EURUSD M15 Forecast - Check related IdeaAs explained in previous post we are expecting a pull back down to our order block (H4) then a bullish reversal to retest last weeks highs (1.16) region. If price breaks and closes above the M15 supply zone will have to re-evaluate and potentially take a long position from a retest into a FVG.


EURUSD POSSIBLE FINAL STAGE FOR BULL AND BEAR TAKING OVERIn this 15m chart we have MAJOR WEEKLY/DAILY RESISTANCE SUPPORT area around 1.1653
I wait to see if we close below that and get out of this UP-WARD CHANEL
If all this mate i will take sell below 1.1642 and Main target will be 1.113 but as usual will close some along the way
I will update once im in
Thanks

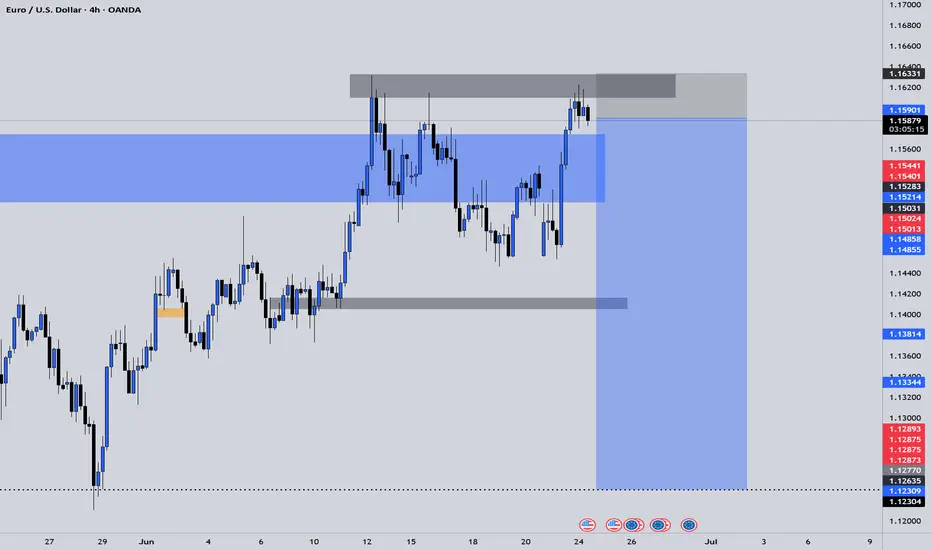
EURUSD – Breakout Confirmed, Now Watching for Retest or 4hr ClosEURUSD has officially broken above the key 1.16020 resistance level on the 4hr chart, but price action has since gone stagnant. No strong bullish momentum has followed the break so far — a sign we may be due for a deeper pullback.
I remain bullish overall, but I'm watching for two potential scenarios:
✅ Safe Buy: Clean 4hr bullish close above 1.16020
🎯 HRHR Buy: Pullback to the former level of interest at 1.14149 if structure holds
Until one of those triggers, I’ll be patient. Let the setup come to you. Overall target remains the 1.18791 zone before reassessing.


Fed speak - Not broken, not cutting “Don’t fix what isn’t broken” seems to be the Fed’s current stance. Two Fed officials made that clear over the last 24 hours.
Vice Chair for Supervision Michael Barr warned that tariffs could fuel inflation by lifting short-term expectations, triggering second-round effects, and making inflation more persistent.
New York Fed President John Williams echoed that view, noting that tariff-driven inflation is “likely to get stronger in the months ahead.” He also called policy “well positioned” and said the Fed needs more data before making any move.
EUR/USD has formed a rising wedge pattern on the daily chart—typically a bearish structure that warns of a potential reversal. Price action has narrowed, building two clear tops. The downside target from the wedge could potentially be 1.1066 initially, and possibly down to 1.0732 if bearish momentum accelerates.