Price action Looks like these trade have changed as I'm looking at eurusd I see trand is still bullish the last break of structure is on upside
USDEUX trade ideas


EUR/USD 2-Hour Chart Analysis2-hour candlestick chart for the Euro/U.S. Dollar (EUR/USD) currency pair, sourced from OANDA, as of June 23, 2025. The current exchange rate is 1.14705, reflecting a 0.45% decrease (-0.00517). The chart highlights recent price movements, with a marked resistance zone around 1.15218 and a support zone near 1.14483. An upward trend is indicated with an arrow, suggesting potential price action toward the resistance level.

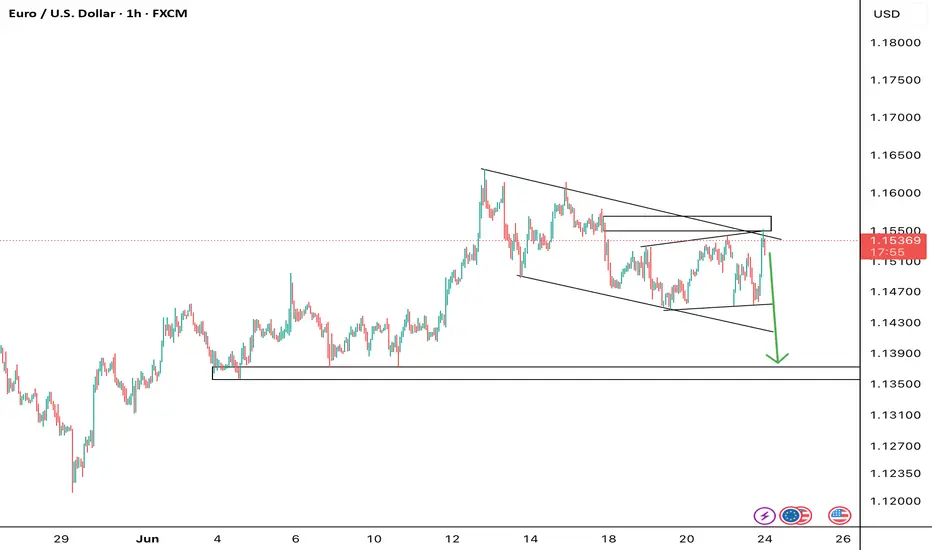
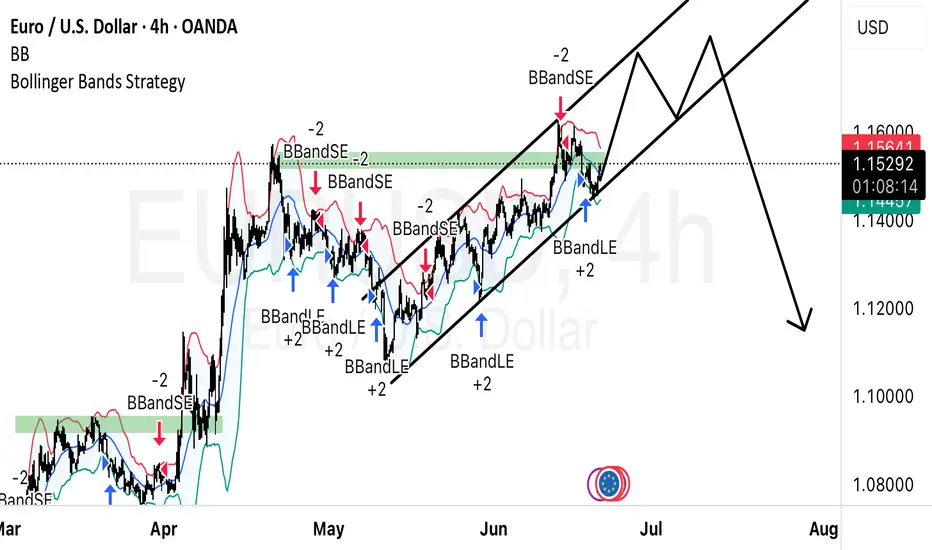
Up down up and downWe are in a bullish channel and have just retested the support and got our confirmation. We will likely see one more retest at resistance before dropping significantly, on the way down I anticipate a fakeout before dropping more. So basically just going to bounce between some lines then drop
EURUSD,GBPUSD and USDJPY Analysis todayHello traders, this is a complete multiple timeframe analysis of this pair. We see could find significant trading opportunities as per analysis upon price action confirmation we may take this trade. Smash the like button if you find value in this analysis and drop a comment if you have any questions or let me know which pair to cover in my next analysis.


euro/usdtrade 5 as u can see from our last trade 5 its where we want it and the entry level is where my take profit is once it hits this mark asre be looking for a reaction agaist the red daily surport/resitance line and let it be used as a surport line to retrace and possibly make a new high but are aim would be just to test the highest high on the charts

EURUSD: FOMC meeting ahead Previous week on the US market was focused on inflation data. The inflation rate in May was standing at 0,1% for the month, below market expectations of 0,2%. At the same time the US core inflation was also below market estimate at the level of 0,1%, while the market forecasted 0,3% for the month. Inflation rate on a yearly basis in May was standing at 2,3% and core inflation was 2,8%. The Producers Price Index in May was at the level of 0,1% for the month, same as core PPI. Both figures were modestly below market estimates. University of Michigan Consumer Sentiment preliminary for June showed some modest relaxation in the inflation expectations. The indicator reached the level of 60,5 which was better from the market estimate of 53,5. The inflation expectations for this year at the beginning of June were standing at 5,1%, and were decreased from 6,6% posted previously. The five year inflation expectations modestly decreased from 4,2% to 4,1%.
During the previous week there has not been too much currently significant data posted for the Euro Zone and Germany, its largest economy. The wholesale prices in Germany in May dropped by -0,3% for the month, bringing the indicator to the level of 0,4% on a yearly basis. Both figures were in line with market forecasts. The balance of trade in the Euro Zone in April ended the month with a surplus of euro 9,9B, which was significantly below market estimate of euro 18,2B. The Industrial Production in the Euro Zone surprisingly dropped in April by -2,4% for the month, which was higher from estimated -1,7%. The IP on a yearly basis stands at 0,8% in April, again below market consensus of 1,4%.
Although the inflation in the US is evidently slowing down, as well as long term inflation expectations, still, newly emerged tensions in the Middle East made investors prefer long positions in gold rather than USD. In this sense, USD weakened as of the end of the previous week to the lowest weekly level against euro at 1,1624. Still, the currency pair closed the week at 1,1553. The RSI has not reached the clear overbought market side, reaching the highest level at 66. This leaves some space for eurusd to move further to the higher grounds until the clear overbought market side is reached. The MA50 continues to strongly diverge from MA200, without an indication that the potential cross is near in the future.
Usually after a strong push of financial assets toward one side, follows the time when the market is searching the equilibrium level. Depending on further developments on the Middle East crisis, there is a potential that eurusd will start the week ahead with a modest consolidation. The 1,15 resistance line was clearly breached during the previous week, indicating probability that the currency pair will revert a bit back to test for one more time this level. On the opposite side, the 1,16 was shortly tested, but the potential for further upside will depend on weekly fundamentals. The most important event for the week ahead is scheduled for Wednesday, June 16th, when the FOMC meeting is scheduled, as well as US economic projections. This day will most certainly bring some higher volatility on markets. Currently, it is widely expected that the Fed will hold interest rates unchanged at this meeting, and leave the planned rate cut for September. However, what the market is expecting to hear are projections for the future period, especially how the Fed perceives the impact of implemented trade tariffs on the US economy.
Important news to watch during the week ahead are:
EUR: ZEW Economic Sentiment Index for Germany in June, Inflation rate final in May for the Euro Zone, PPI in Germany in May, HCOB Manufacturing PMI flash in June, in both Germany and the Euro Zone,
USD: Retail Sales in May, Industrial Production in May, Building Permits preliminary in May, Housing starts in May, the FOMC meeting and interest rate decision will be held on Wednesday, June 18th, the FOMC economic projections will be posted the same day, Fed press conference after the FOMC meeting on Wednesday. The week ends with data regarding Existing Home Sales in May on Friday.

Path Toward 1.20 Still in Play but there's a catch....The pair has recently completed a major technical breakout by moving above a long standing trendline that dates back to the 2008 high. For more than 15 yearsthis trendline acted as strong resistance, repeatedly rejecting bullish attempts. The latest move did not just break through this resistance. It returned to retest the level around the 1.1450 to 1.1500 area and held with near perfect precision. This successful retest signaled a structural shift, turning former resistance into solid support. Since then, the pair has remained within a steep upward channel, forming higher lows and maintaining strong upside momentum. This momentum appears to be backed by real macro flows rather than just short-term speculation.
The euro’s recent strength is not being driven by strong economic performance in the Eurozone. Instead, it reflects a broader shift in global capital allocation and diverging monetary policy expectations. The Federal Reserve began easing policy in late 2024 with a series of rate cuts aimed at responding to softening inflation and slowing labor market conditions. By early 2025, the Fed had completed a handful of cuts before entering a pause. That pause remains in effect for now but markets are increasingly expecting the Fed to resume cutting later this year, with 2 to 3 additional cuts projected for the second half of 2025. These expectations have weakened the dollar as traders anticipate a return to more accommodative policy. (This is known as pricing in or speculative markets)
On the European side, the European Central Bank began cutting rates in late 2024 (Duh we all know this by now) and is now widely seen as operating in neutral territory. The ECB has taken a careful and measured approach to easing, avoiding any aggressive dovish turn and instead emphasizing a data dependent path. With limited room to cut further and no urgent economic pressure to do so, the euro has maintained a relative yield advantage compared to the dollar, even in a context of muted growth.
Another important driver of euro strength has been the rotation of capital into U.S. equities, particularly in the technology and large cap sectors. As investors allocate more capital into risk assets, the dollar tends to weaken in FX terms, as funding shifts out of USD and into growth exposures (aka emerging markets) This type of flow indirectly benefits the euro. At the same time the dollar is no longer acting as a dominant safe haven for now. Despite the presence of global uncertainty, low market volatility and return focused positioning have reduced the appeal of defensive USD flows. This has allowed the euro to benefit from repositioning, not because of its own economic strength, but because the dollar is no longer absorbing global liquidity the way it once did.
From a technical standpoint, the breakout above the 2008 trendline marks a significant structural change. As long as the 1.1500 area holds as support, the trend remains intact. The next major upside target is around 1.20, which aligns with the top of the rising price channel and represents a likely area for medium term profit taking by larger market participants.
However , risks to the upside scenario remain. Because this rally is being driven by capital flows and positioning rather than Eurozone fundamentals, it is highly sensitive to shifts in sentiment and data. A stronger than expected U.S economic report, such as an upside surprise in CPI, employment or consumer spending, could quickly change the market’s view on the Fed’s rate path and trigger a resurgence in dollar strength. Similarly, any signal from the ECB that suggests renewed dovishness or further deterioration in European economic data, could weigh heavily on the euro. In addition, if a geopolitical shock or a sharp decline in risk appetite occurs, safe haven flows could return to the dollar and result in a fast reversal in EUR/USD. We saw a warning of this past weekend with Israel and Iran attacking each other.
all in all, the euro has made a technically sound and macro supported breakout, driven by diverging rate cycles, capital rotation and the evolving role of the U.S dollar in global flows. The move toward 1.20 remains a valid target as long as 1.1500 holds as support. But this is not a fundamentally bullish euro story. It is a positioning driven move based on relative rate expectations and macro sentiment. If those expectations shift, the rally could unwind quickly. Active risk management remains essential. I hope this helps you all, Cheers!
Chart
White dashed line - 2008 Resistance
Red and Blue Ascending channel (Bullish on Daily)
Red is 1.19-1.20 AOI TP


EURUSD Outlook at Risk of Changing in the Short and Medium TermEURUSD is feeling the bearish pressure as geopolitical tensions in the Middle East escalate. These risks are driving traders toward safe havens, particularly the US dollar and US government debt, which still serve as the backbone of global reserves. The sharp decline in the dollar in recent months has added to this dynamic, but it’s not over yet for euro bulls in all the short, medium, and long term.
However, the options market is flashing a rare bearish signal for EURUSD that traders should not ignore. Risk reversals across all maturities from 1 week to 1 year are falling. The 1-week risk reversal dropped sharply from 0.1075 to -1.10 since last Monday, one of the steepest moves seen recently, even though EURUSD itself has remained relatively flat.
The breakout and successful retest of the long-term downtrend from 2008 to 2025 was a key turning point. As long as EURUSD stays above this trendline, dips are likely to be seen as buying opportunities by long-term investors.
For the medium term, however, a bearish signal (for EURUSD) has emerged from the dollar index. The index broke out of the wedge formation (update the post above to see), retested it, and has since resumed its upward move, creating a strong bullish technical setup.
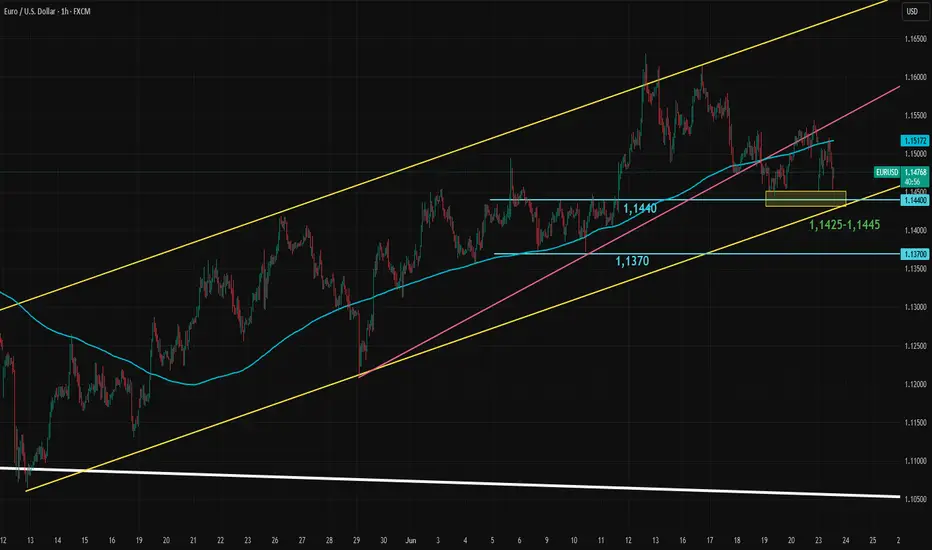
Now, everything comes down to short-term support. EURUSD has been in an upward trend channel since the retest of the long-term trendline and had also formed a shorter-term trend within that channel. This shorter trendline has now broken and been retested. The next critical level is the 1.1425–1.1440 support zone. If this area fails to hold, it could shift both the short- and medium-term direction to the downside.
Note: In this post, "short term" refers to up to one week, "medium term" to one to several weeks, and "long term" to several months to a few years.
EURUSD pushing away from 2025 highsAfter creating a new 2025 high last week, MARKETSCOM:EURUSD is now in a slight correction mode. Will the bears take control from here? Let's have a look.
FX_IDC:EURUSD
Let us know what you think in the comments below.
Thank you.
77.3% of retail investor accounts lose money when trading CFDs with this provider. You should consider whether you understand how CFDs work and whether you can afford to take the high risk of losing your money. Past performance is not necessarily indicative of future results. The value of investments may fall as well as rise and the investor may not get back the amount initially invested. This content is not intended for nor applicable to residents of the UK. Cryptocurrency CFDs and spread bets are restricted in the UK for all retail clients.


Bullish bounce?EUR/USD is falling towards the support level which is a pullback support that is slightly above the 61.8% Fibonacci retracement and could bounce from this level to our take profit.
Entry: 1.1546
Why we like it:
There is a pullback support level that is slightly above the 61.8% Fibonacci retracement.
Stop loss: 1.1497
Why we like it:
There is an overlap support level.
Take profit: 1.1611
Why we like it:
There is a pullback resistance.
Enjoying your TradingView experience? Review us!
Please be advised that the information presented on TradingView is provided to Vantage (‘Vantage Global Limited’, ‘we’) by a third-party provider (‘Everest Fortune Group’). Please be reminded that you are solely responsible for the trading decisions on your account. There is a very high degree of risk involved in trading. Any information and/or content is intended entirely for research, educational and informational purposes only and does not constitute investment or consultation advice or investment strategy. The information is not tailored to the investment needs of any specific person and therefore does not involve a consideration of any of the investment objectives, financial situation or needs of any viewer that may receive it. Kindly also note that past performance is not a reliable indicator of future results. Actual results may differ materially from those anticipated in forward-looking or past performance statements. We assume no liability as to the accuracy or completeness of any of the information and/or content provided herein and the Company cannot be held responsible for any omission, mistake nor for any loss or damage including without limitation to any loss of profit which may arise from reliance on any information supplied by Everest Fortune Group.

ABC Bullish Hello awesome traders, hope you're having a great week!
We’ve got a clean ABC bullish setup unfolding beautifully on EURUSD 4H:
🔶 Pattern: ABC Bullish
🕓 Timeframe: 4H
⚡️ Structure: AB=CD completion at 61.8% with PRZ confluence
📍 Entry Level: 1.15058 (confirmed breakout + retest)
🎯 Target 1: 1.16006 (AB=CD)
🎯 Target 2: 1.16561 (extended projection)
🛑 Invalidation: Below 1.13717 (D-point)
Technical Highlights:
✅ 61.8% retracement support at D
✅ 78.6% BC retracement
✅ Price bounced cleanly and is consolidating above EL
✅ Momentum build above structure, higher lows in play
📊 Watching for continuation toward 1.1600 and beyond if structure holds.
Trade smart, protect capital, and let the pattern do the work!

EURUSD: Move Up Ahead?! 🇪🇺🇺🇸
EURUSD nicely respected the underlined key horizontal support.
A strong rejection from that and a formation of a bullish imbalance candle
indicate a highly probably bullish continuation next week.
Goal - 1.1608
❤️Please, support my work with like, thank you!❤️
I am part of Trade Nation's Influencer program and receive a monthly fee for using their TradingView charts in my analysis.

OTEUM EXPERT CALL: EUR/USD – June Finale Setup We’re eyeing the last intramonth swing of June, expected to bleed into early July. Our playbook: let the market cough up one final risk-off spike on the Iran headlines 🌪️📰, then scoop up positions in the value zone (red box) for the next bullish leg 🚀.
Patience first, trigger later 🕰️🎯—wait for price to hit the sweet spot, load up, and ride the firework into summer. Stay nimble; geo-shock headlines can flip the board fast ⚠️.
#EURUSD #Intramonth #RiskOff #ValueHunt #OTEUM

EUR/USD - Potential Targets ( Correction ? )Dear Friends in Trading,
How I see it,
Key Confluence - NOW SUPPORT @ 1.15700
Potential correction below key support
"SHORT" Targets:
1] 1.15130
2] 1.14900
3] 1.14700
I sincerely hope my point of view offers a valued insight.
Thank you for taking the time to study my analysis.

HelenP. I Euro may break suppot level and drop to trend lineHi folks today I'm prepared for you Euro analytics. Observing this chart, we can see how the price strongly declined and reached the trend line, where it found solid support and reversed. From that point, EUR began to grow, forming a clear upward pennant structure. This movement included a break above the local support level at 1.1485, indicating temporary bullish strength. However, despite this breakout, the price failed to secure a strong push through the resistance zone between 1.1485 and 1.1530, instead consolidating just below it. Now the chart shows clear signs of slowing upward momentum. The price remains inside the pennant, but current movement suggests potential weakness near the top boundary. Given the structure and previous reaction points, I expect EURUSD to break below the support level and move toward the trend line again. This would be a natural retest of the lower boundary of the pennant. That’s why I’ve set my target at 1.1365, a level that coincides perfectly with the trend line, offering a realistic area for price to react once more. If you like my analytics you may support me with your like/comment ❤️
Disclaimer: As part of ThinkMarkets’ Influencer Program, I am sponsored to share and publish their charts in my analysis.

EURUSD Under Pressure! SELL!
My dear friends,
Please, find my technical outlook for EURUSD below:
The instrument tests an important psychological level 1.1551
Bias - Bearish
Technical Indicators: Supper Trend gives a precise Bearish signal, while Pivot Point HL predicts price changes and potential reversals in the market.
Target - 1.1458
Recommended Stop Loss - 1.1608
About Used Indicators:
Super-trend indicator is more useful in trending markets where there are clear uptrends and downtrends in price.
Disclosure: I am part of Trade Nation's Influencer program and receive a monthly fee for using their TradingView charts in my analysis.
———————————
WISH YOU ALL LUCK
