EURUSD SELL TRADEOpportunity to sell on EURUSD
Entry: 1.18000
Stop loss: 1.18200
Take profit 📈 1.17400
Comment your opinion
For fund management. Contact me on X @shajudeakinoba1
USDEUX trade ideas

EUR/USD Long Setup — Breakout Retest Play
We’re seeing a classic breakout-retest scenario on EUR/USD. After breaking above the previous consolidation zone, price has pulled back to retest the broken structure near 1.1495, which also aligns with a higher time frame support zone.
🟦 Entry Zone: 1.1495–1.1490
🔴 Stop Loss: Below 1.1420 (clearly outside the structure)
🟩 Targets (Partial TPs):
1.1655
1.1775
1.1888–1.1894 (final)
📌 Plan:
This is a trend continuation idea after a clean structural breakout. If you plan to enter this, consider:
✅ Scaling in at or near current price
✅ Partial TP at each resistance level
❌ Avoid holding full position till final target — secure profits along the way
✅ Use proper risk management and size
⚠️ Important Note
This is not a signal, just an idea.
I am not selling signals or subscriptions.
If you're new, you may think:
“Let me just follow someone with 100K followers and I’ll profit.”
Truth is — follower count means nothing. Many signal sellers don’t even trade. They sell subscriptions, not setups.
🧠 Pro Tip for Beginners
Track 30–40 trade ideas from different users (including old ones — they often hide losers). Ask yourself:
Was the direction right?
Was the entry filled?
Was the setup realistic?
That’s how you’ll grow as a trader.
Trade smart, protect your capital, and stay sharp.
Rendon1

EUR/USD – Weak Expectations, Neutral German CPI📉 EUR/USD – Weak Expectations, Neutral German CPI, and Bearish Momentum Ahead
Bias: Short / Sell Setup
EUR/USD recently surged toward the 1.0750 zone sooner than expected, driven more by market optimism and speculative flows than solid fundamentals.
Now, that optimism is starting to fade as data fails to back it up.
Meanwhile, the potential U.S. tax reform proposal (Trump) and signs of renewed trade negotiations are helping shift sentiment back toward the U.S. dollar in the coming 10 days.
---
🇩🇪 German CPI – Neutral Print, But Bearish Implications
Today's regional inflation figures across German states were mixed:
States like Saxony and Baden-Württemberg showed slightly rising prices
Others like Bavaria and North Rhine-Westphalia showed declining YoY inflation
Final national CPI due later today is unlikely to beat expectations meaningfully
🎯 Summary: A Neutral CPI Print
No upside surprise → No support for EUR
No major downside → No panic either
---
🧠 Why "Neutral" Data Can Still Be Bearish for EUR
The market was hoping for a strong CPI to signal that ECB may pause rate cuts
Neutral inflation = ECB may still lean dovish
EUR rose on hope — but data offered no confirmation
In financial markets, failed expectations often trigger stronger corrections than bad news.
---
🔍 Technical Overview:
Price approaching strong supply zone near 1.0740 – 1.0760
RSI showing divergence on lower timeframes (H1)
Structure on M15 suggests potential for lower highs
Price stalling under resistance, with no bullish momentum follow-through
---
🎯 Trade Plan:
Bias: Short
Entry Zone: 1.0730 – 1.0755
Stop Loss: Above 1.0775
Take Profit 1: 1.0630
Take Profit 2: 1.0600
Trigger: Break of M15 bearish structure or supply reaction
---
📌 Markets punish over-optimism more than fear.
EUR/USD may correct lower as hopes of a strong CPI fade and macro flows tilt toward the USD.

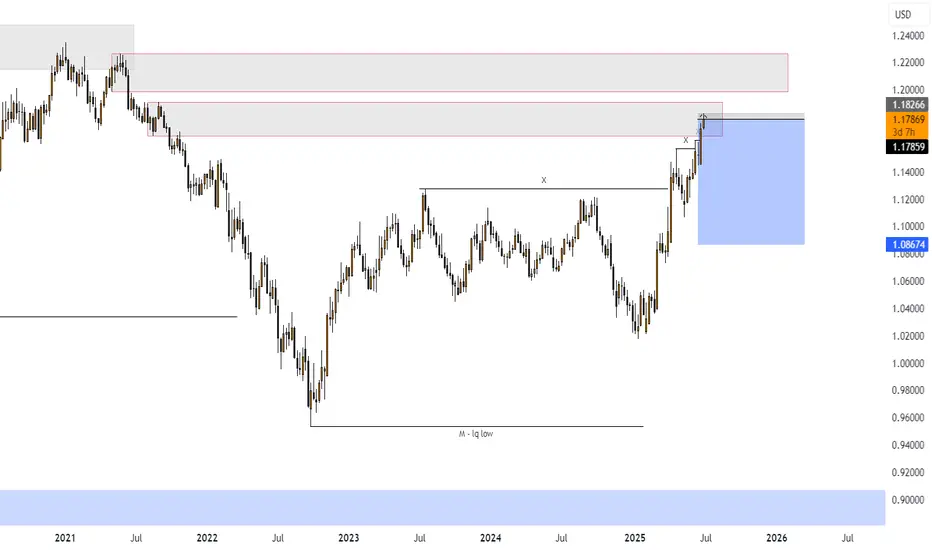
EURUSD Channel Up formed bottom. Heavily bullish.The EURUSD pair has been trading within a Channel Up since the May 12 Low. Today it hit its 4H MA100 (green trend-line) for the first time since May 12 and having just broken also above its 4H MA50 (blue trend-line), it confirmed that the pattern has already priced its bottom.
This is initiating the new Bullish Leg and based on the previous two, it should grow by at least +3.21%. We have a modest short-term Target at 1.1800.
-------------------------------------------------------------------------------
** Please LIKE 👍, FOLLOW ✅, SHARE 🙌 and COMMENT ✍ if you enjoy this idea! Also share your ideas and charts in the comments section below! This is best way to keep it relevant, support us, keep the content here free and allow the idea to reach as many people as possible. **
-------------------------------------------------------------------------------
Disclosure: I am part of Trade Nation's Influencer program and receive a monthly fee for using their TradingView charts in my analysis.
💸💸💸💸💸💸
👇 👇 👇 👇 👇 👇

EUR/USD - Bullish Continuation | Post FED & Job data ReactionEUR/USD remains in a strong short-term uptrend, consistently respecting a rising trendline from June lows. After briefly reacting to a local ChoCh (Change of Character) near 1.1830, the pair pulled back modestly—but held support along the trendline, keeping the bullish structure intact.
Today’s U.S. macro events played a critical role:
• 🗣️ Fed Chair Powell’s speech at the Sintra Forum reaffirmed a cautious, data-driven path toward rate cuts. While not committing to immediate easing, Powell acknowledged inflation uncertainty and emphasized patience.
• 👷♂️ U.S. jobs data pointed to a cooling labor market (slower job growth, 3.9% wage inflation), reinforcing market expectations for a Fed rate cut by September.
• 📉 The U.S. dollar weakened across the board, supporting EUR/USD’s upside momentum.
Technical Highlights:
• Price is trading above a well-defined ascending trendline (support zone ~1.1775–1.1790)
• Resistance remains at 1.1815–1.1830, the previous local top
• Breakout above 1.1830 could extend the rally toward 1.1900 and beyond
Trading Plan:
• Buy Zone: 1.1775–1.1790 (near trendline)
• Stop Loss: Below 1.1740 (trendline break/invalidation)
• Take Profit 1: 1.1830
• Take Profit 2: 1.1900 (next swing target)
As long as the trendline support holds, EUR/USD remains bullish. A breakout above the current resistance zone will likely trigger the next leg up. Keep an eye on follow-through from U.S. macro data and ECB signals for confirmation.

Eurozone Economy and ECB Policy:Eurozone Economy and ECB Policy: Between Price Stability and Currency Tension
The Eurozone’s latest data points to a relatively stable and controlled macroeconomic environment, with a key milestone just reached:
📊 June inflation hit 2.0%, aligning precisely with the ECB’s long-term target.
Growth remains moderate but positive, and unemployment is stable. From a classical policy perspective, this setup would typically justify further interest rate cuts to stimulate demand and support economic expansion.
But there’s a growing complication:
The euro has strengthened significantly in recent weeks, driven not just by economic fundamentals but also by capital inflows and a weakening U.S. dollar. A stronger euro, while often seen as a sign of investor confidence, can hurt exports, reduce competitiveness, and dampen inflation further — potentially becoming a drag on recovery.
As a result, the ECB finds itself in a policy dilemma:
Cutting rates could stimulate growth, but risk driving the euro even higher.
Slowing down or pausing rate cuts could stabilize the currency, but may stall economic momentum.
---
🔁 Reflexivity at Work
This dynamic highlights George Soros' theory of reflexivity — where market perceptions shape fundamentals, and those fundamentals in turn reshape perceptions.
> “Market prices are always distorted by prevailing biases.”
— George Soros
The current rally in the euro may not reflect fundamentals alone. If the move exceeds investor expectations, it could trigger emotional reactions, abrupt capital shifts, or even corrections — despite a solid economic base.
---
⚠️ Key Takeaways
June inflation at 2.0% gives ECB a clean slate to act — but with caution.
Currency appreciation can delay or distort the impact of monetary easing.
Market reflexivity may accelerate reactions beyond what data alone would justify.
Policy credibility now hinges not just on data, but on timing and communication.
---
In today’s market, price and psychology move together. Stability on paper doesn't always mean stability in execution.

EURUSD - ANALYSIS👀 Observation:
Hello friends! I hope you're doing well. I’d like to share my view on EUR-USD with you.
Looking at the EUR-USD chart, I see two potential scenarios ahead:
🔹 Scenario 1 – Bearish:
If EUR-USD breaks below 1.16836 on the 15-minute time frame, I expect a downward move toward the 1.16319 to 1.15850 area.
🔹 Scenario 2 – Bullish then Bearish:
If the price rises from the current level, I expect an initial move up toward 1.17937, followed by a decline back toward the 1.16319 to 1.15850 zone.
💡 Key Levels to Watch:
📌 Support: 1.16836 / 1.16319 / 1.15850
📌 Resistance: 1.17937
💬 What are your thoughts on EUR-USD? Let me know in the comments below.
Trade safe

eurusd Sell Time now or 7:00 o clockEURUSD, now its time for new mareket structur shift and entry
because in hightimeframe its market structur ,
1:5 ose 1:3
price market structur shift or keep ob bearish and sell

EURUSD - trade - market structureDXY - trade - market structure , easy setup, clean setup , good probability, if this happen is a big win, use risk and trade managment

PO3 (Manipulation spike into Premium → Distribution)Price swept liquidity above the recent high → tapped into FVG at a premium
BOS and CHOCH are already present earlier → confirming the reversal structure
Expecting a bearish reaction from this imbalance zone
📉 EUR/USD Short Setup – June 27
🔹 Entry: 1.17380
🔹 SL: 1.17510
🔹 TP1: 1.17080 | TP2: 1.16800
🔻 PO3 bearish reaction from FVG at Premium zone + prior liquidity sweep
pls let me know your opinion am open to let from anyone and everyone, pls

EURUSD BuyExternal structure is bullish and the continuation structure failed to make the high. Price came lower and during Asia session it took out the low(inducement) and mitigated an Order Block. Price taking out the internal low that failed to create the higher high is the fuel to push upward. we need to wait and see how Frankfurt and London open play out. It is Friday so I'm not going to be surprised if it does some weird moves.

Profit TakingYesterday, EURUSD continued its bullish move and reached 1,1747.
Currently, we focus more on reducing risk and taking profits rather than entering new positions.
We’re approaching the final days of the quarter, and next week brings key economic events.
New entries will be considered only if a favorable risk-reward setup presents itself.
The next resistance remains at 1,1778!


The Day Ahead Major Economic Data:
US:
ISM Manufacturing (June) and JOLTS job openings (May) – Key for Fed rate cut outlook.
Construction spending and vehicle sales – Insight into economic strength.
Dallas Fed services – Regional business sentiment check.
China:
Caixin Manufacturing PMI (June) – Watch for signs of continued slowdown.
Japan:
Tankan Survey (Q2) – Key business sentiment data; may influence BoJ policy.
Eurozone:
June CPI (inflation) – Crucial for ECB’s rate path.
Germany unemployment, Italy PMI, budget, and car sales – Regional economic health indicators.
Central Bank Highlights:
ECB Sintra Forum Panel:
Features Powell (Fed), Lagarde (ECB), Ueda (BoJ), Bailey (BoE).
Markets will watch for any policy shift signals or divergence in rate outlooks.
Other ECB Speakers:
Guindos, Schnabel, Elderson – may give more hints on inflation and rate moves.
ECB Consumer Survey:
Offers insight into household inflation expectations.
Market View:
US data may push Fed closer to rate cuts if weak.
Eurozone inflation will guide ECB stance.
China’s PMI is a global growth signal.
Central bank talks at Sintra are key for global rate outlook.
Overall:
Markets are on edge awaiting clarity on growth, inflation, and rate paths. Expect possible moves in FX, yields, and equities depending on the data and central bank tone.
This communication is for informational purposes only and should not be viewed as any form of recommendation as to a particular course of action or as investment advice. It is not intended as an offer or solicitation for the purchase or sale of any financial instrument or as an official confirmation of any transaction. Opinions, estimates and assumptions expressed herein are made as of the date of this communication and are subject to change without notice. This communication has been prepared based upon information, including market prices, data and other information, believed to be reliable; however, Trade Nation does not warrant its completeness or accuracy. All market prices and market data contained in or attached to this communication are indicative and subject to change without notice.

German CPI flatlines, eurozone CPI nextThe euro is up for an eighth consecutive day and has gained 2.4% during that time. In the North American session, EUR/USD is trading at 1.1738, up 0.36% on the day.
German inflation data on Monday pointed to a weakening German economy. The CPI report indicated that the deflationary process slowly continues. The inflation rate for June came in at 0% m/m, down from 0.1% in May and below the consensus of 0.2%. Annually, inflation dropped to 2.0% from 2.1% and below the consensus of 2.1%. The eurozone releases its CPI report on Tuesday.
Inflation has been dropping in small increments and has now fallen to the European Central Bank's inflation target of 2%. The ECB cut the deposit rate to 2.0% earlier in June and meets next in July. Although eurozone inflation is largely contained, there are concerns about the impact that US tariffs and counter-tariffs by US trading partners could have on the inflation picture. The ECB is likely to maintain rates in July but could lower rates in September if disinflation continues.
The US continues to show signs that the economy is slowing down. Last week, GDP was revised downwards to -0.5% in the first quarter. This was followed by US consumer spending for May (PCE) which posted a 0.1% decline, following a 0.2% gain in April and shy of the consensus of 0.1%. This was the first contraction since January. If economic data continues to head lower, pressure will increase on the Federal Reserve to lower interest rates, which isn't expected before the September meeting.
EUR/USD is testing resistance at 1.1755. Above, there is resistance at 1.1791
1.1718 and 1.1682 are the next support levels

EURUSD: Will Go Down! Short!
My dear friends,
Today we will analyse EURUSD together☺️
The recent price action suggests a shift in mid-term momentum. A break below the current local range around 1.17225 will confirm the new direction downwards with the target being the next key level of 1.17114.and a reconvened placement of a stop-loss beyond the range.
❤️Sending you lots of Love and Hugs❤️

MASSIVE EURUSD SHORT We could see a breakdown of 30% on the MIL:EURO
There has been too much printing and liquidity is drying up


EURUSD Expected Growth! BUY!
My dear followers,
This is my opinion on the EURUSD next move:
The asset is approaching an important pivot point 1.1774
Bias -Bullish
Technical Indicators: Supper Trend generates a clear long signal while Pivot Point HL is currently determining the overall Bullish trend of the market.
Goal - 1.1792
About Used Indicators:
For more efficient signals, super-trend is used in combination with other indicators like Pivot Points.
Disclosure: I am part of Trade Nation's Influencer program and receive a monthly fee for using their TradingView charts in my analysis.
———————————
WISH YOU ALL LUCK

Be careful with EURUSDEURUSD is holding its bullish trend and hovering around 1,1800.
Tomorrow, U.S. employment data is due.
It will be released on Thursday instead of Friday, as Friday is a holiday.
At the current levels, there’s no favorable risk-reward for new entries.
Watch for a pullback and wait for the right moment.

EURUSD ASIA Sells I see this head and shoulders pattern on EURUSD M15 timeframe. Entry should be 1,7955 above so this trade will require some patience. EURUSD is currently on an uptrend so exit the trade soon as tp hits.

EURUSD: Target Is Up! Long!
My dear friends,
Today we will analyse EURUSD together☺️
The recent price action suggests a shift in mid-term momentum. A break above the current local range around 1.18033 will confirm the new direction upwards with the target being the next key level of 1.18161 and a reconvened placement of a stop-loss beyond the range.
❤️Sending you lots of Love and Hugs❤️
