GBPUSD I Daily CLS I KL - FVG I Model 1Yo Market Warriors ⚔️
Fresh outlook drop — if you’ve been riding with me, you already know:
🎯My system is 100% mechanical. No emotions. No trend lines. No subjective guessing. Just precision, structure, and sniper entries.
🧠 What’s CLS?
It’s the real smart money. The invisible hand behind $7T/day — banks, algos, central players.
📍Model 1:
HTF bias based on the daily and weekly candles closes,
Wait for CLS candle to be created and manipulated. Switch to correct LTF and spot CIOD. Enter and target 50% of the CLS candle.
For high probability include Dealing Ranges, Weekly Profiles and CLS Timing.
Trading is like a sport. If you consistently practice you can learn it.
“Adapt what is useful. Reject whats useless and add whats is specifically yours.”
David Perk aka Dave FX Hunter
💬 Don't hesitate to ask any questions or share your opinions
USDGBP trade ideas

GBP/USD - H1- Bearish Flag (07.07.2025)The GBP/USD Pair on the M30 timeframe presents a Potential Selling Opportunity due to a recent Formation of a Bearish Flag Pattern. This suggests a shift in momentum towards the downside in the coming hours.
Possible Short Trade:
Entry: Consider Entering A Short Position around Trendline Of The Pattern.
Target Levels:
1st Support – 1.3520
2nd Support – 1.3460
🎁 Please hit the like button and
🎁 Leave a comment to support for My Post !
Your likes and comments are incredibly motivating and will encourage me to share more analysis with you.
Best Regards, KABHI_TA_TRADING
Thank you.
Disclosure: I am part of Trade Nation's Influencer program and receive a monthly fee for using their TradingView charts in my analysis.

GBP/USD - Bearish Channel (07.07.2025)The GBP/USD Pair on the M30 timeframe presents a Potential Selling Opportunity due to a recent Formation of a Bearish Channel Pattern. This suggests a shift in momentum towards the downside in the coming hours.
Possible Short Trade:
Entry: Consider Entering A Short Position around Trendline Of The Pattern.
Target Levels:
1st Support – 1.3545
2nd Support – 1.3485
🎁 Please hit the like button and
🎁 Leave a comment to support for My Post !
Your likes and comments are incredibly motivating and will encourage me to share more analysis with you.
Best Regards, KABHI_TA_TRADING
Thank you.
Disclosure: I am part of Trade Nation's Influencer program and receive a monthly fee for using their TradingView charts in my analysis.

GBPUSD: Two Strong Bullish Area To Buy From ?GU is currently in a bullish trend when examined on a daily time frame. There are two potential areas for purchase. The first area is currently active, as we anticipate a price reversal from this point. There is a significant possibility that price could decline to the second area and subsequently reverse from there directly. The sole reason we believe price could drop to the second area is if the US Dollar experiences corrections, which could cause GU to drop to our second area and subsequently rebound.
If you appreciate our analysis, we kindly request that you consider the following actions:
-Liking the Ideas
-Commenting on the Ideas
-Sharing the Ideas
We extend our sincere gratitude for your continuous support. We trust that our insights have provided even a modicum of assistance.
Team Setupsfx_
❤️🚀

GBP/USD : Get Ready for Another Fall!By analyzing the GBP/USD chart on the 4-hour timeframe, we can see that after reaching 1.36800—filling the targeted FVG as expected—the price faced selling pressure once again and has since dropped to around 1.35690.
The first target at 1.35630 is now within reach. After collecting liquidity below this level and a possible short-term bounce, we can expect another bearish continuation on GBPUSD.
Key supply zones to watch are 1.36180–1.36465 and 1.36940.
Key demand zones are located at 1.35630, 1.35100, and 1.34880.
THE MAIN ANALYSIS :

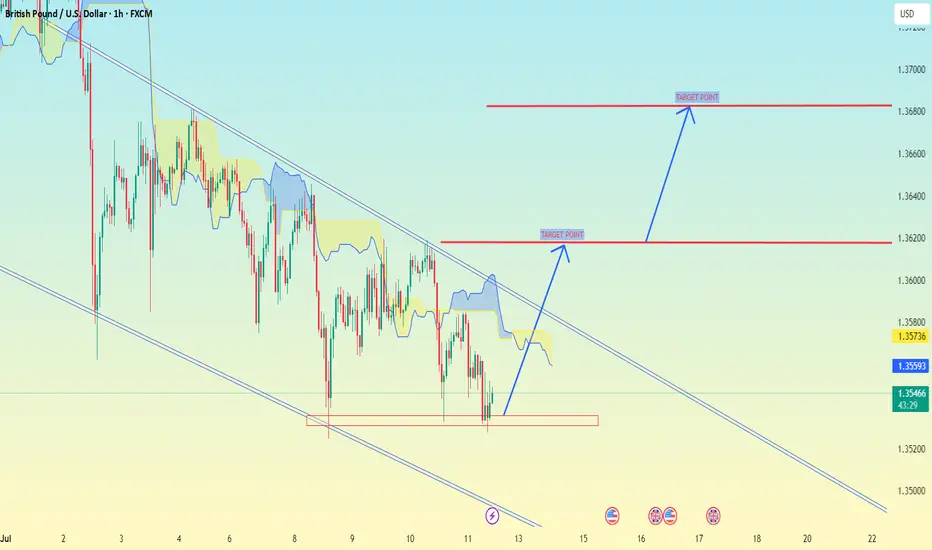
GBP/USD chart (1H timeframe)GBP/USD chart (1H timeframe), potential breakout from a descending channel, supported by the Ichimoku Cloud and marked target levels.
📈 Current Analysis Highlights:
Price is near the lower end of the descending channel.
A bullish reversal setup is forming.
I'm drawn two Target Points indicating a breakout and continuation.
---
🎯 Target Levels (as per your chart):
1. First Target Point:
🔹 1.36200 — This is the initial resistance level or TP1 if price breaks above the Ichimoku cloud and mid-channel resistance.
2. Final Target Point:
🔹 1.36800 — This is the upper resistance zone and aligns with the top of the descending channel, a likely TP2 area if bullish momentum continues.
---
✅ Summary:
Entry idea: After confirmation of a breakout above the cloud (~1.35600).
TP1: 1.36200
TP2: 1.36800
GBPUSD COT and Liquidity AnalysisHey what up traders welcome to the COT data and Liquidity report. It's always good to go with those who move the market here is what I see in their cards. I share my COT - order flow views every weekend.
🎯 Non Commercials has been taking profits on during last 3 weeks. There for I think we need deeper pullback to reload the longs.
📍Please be aware that institutions report data to the SEC on Tuesdays and data are reported on Fridays - so again we as retail traders have disadvantage, but there is possibility to read between the lines. Remember in the report is what they want you to see, that's why mostly price reverse on Wednesday after the report so their cards are hidden as long as possible. However if the trend is running you can read it and use for your advantage.
💊 Tip
if the level has confluence with the high volume on COT it can be strong support / Resistance.
👍 Hit like if you find this analysis helpful, and don't hesitate to comment with your opinions, charts or any questions.
Analysis done on the Tradenation Charts
Disclosure: I am part of Trade Nation's Influencer program and receive a monthly fee for using their TradingView charts in my analysis.
"Adapt what is useful, reject what is useless, and add what is specifically your own."
— David Perk aka Dave FX Hunter ⚔️

GBPUSD: Bullish Move After Liquidity Grab 🇬🇧🇺🇸
GBPUSD formed a bullish high range candle with a long lower wick going
below a key horizontal demand zone on a 4H.
A consequent recovery and a bullish London session opening suggest
a highly probable rise today.
Goal - 1.363
❤️Please, support my work with like, thank you!❤️
I am part of Trade Nation's Influencer program and receive a monthly fee for using their TradingView charts in my analysis.

GBPUSD - Macro Trend Continues!Hello TradingView Family / Fellow Traders. This is Richard, also known as theSignalyst.
📈GBPUSD has been overall bullish trading within the rising channel marked in red. And it is currently retesting the lower bound of the channel.
Moreover, the green zone is a strong structure.
🏹 Thus, the highlighted blue circle is a strong area to look for buy setups as it is the intersection of the lower red trendline and structure.
📚 As per my trading style:
As #GBPUSD approaches the blue circle zone, I will be looking for bullish reversal setups (like a double bottom pattern, trendline break , and so on...)
📚 Always follow your trading plan regarding entry, risk management, and trade management.
Good luck!
All Strategies Are Good; If Managed Properly!
~Rich
Disclosure: I am part of Trade Nation's Influencer program and receive a monthly fee for using their TradingView charts in my analysis.

GBP/USD Pulls Back After Rejection – Buyers Eye Lower LevelsHi everyone,
GBP/USD failed to break above the 1.37500 level and saw a rejection from that resistance, dropping further below the 1.36850 support. Since then, price has consolidated and ranged beneath this level.
Looking ahead, if price remains within this range, we anticipate a move lower to find buying interest between the 1.35300 and 1.34600 levels, which could set the stage for another push higher.
As previously noted, a decisive break above 1.37500 would renew our expectation for further upside, with the next key target around 1.38400. We'll be monitoring price action closely to see how it unfolds.
We’ll continue to provide updates on the projected path for GBP/USD as price approaches this target.
The longer-term outlook remains bullish, and we expect the rally to continue extending further from the 1.20991 January low towards 1.40000 and 1.417000.
We’ll be keeping you updated throughout the week with how we’re managing our active ideas. Thanks again for all the likes/boosts, comments and follows — we appreciate the support!
All the best for the week ahead. Trade safe.
BluetonaFX

GBP/USD Bullish Breakout Setup | Targeting 1.4000+GBP/USD is showing strong bullish structure after respecting the key support zone around 1.3550–1.3570. A potential breakout above the 1.3740–1.3780 resistance zone could fuel further upside momentum.
🟡 Support Area: 1.3550 – 1.3570
🟡 Breakout Area: 1.3740 – 1.3780
🔵 Target Point: 1.4000+
📈 If the price holds above the breakout zone, we expect a clean rally toward 1.4000 psychological level. Watch for confirmation and volume to support the move
#GBPUSD
#Forex
#FXAnalysis
#PriceAction
#BreakoutSetup
#SmartMoney
#LiquidityGrab
#TechnicalAnalysis
#BullishSetup
#ForexForYou
#ForexTradingView
#FXTrader
#MarketStructure
#ForYou
#ForYou #GBPUSD #BreakoutSetup #SmartMoney #Forex

Not All Pin Bars Are Created EqualA Two-Step Filter to Find the Ones That Actually Matter
We’ve all seen them. Long wicks, tight bodies, price rejecting a level. The classic pin bar. Textbook stuff, right?
But here’s the problem. Pin bars show up all over the chart. Some lead to clean reversals. Most do absolutely nothing. The trick isn’t spotting them. It’s knowing which ones to trust.
This is where a simple two-step filter can help. By asking two key questions, you immediately improve the quality of your trades and cut down on the false positives.
Step One: Where Did It Happen?
Before you look at shape or size, ask yourself one thing.
Did this pin bar form at a meaningful level?
Context is everything. A pin bar that forms into thin air, mid-range or in the middle of chop might look good, but it’s rarely reliable. What you’re looking for is reaction from structure. That could mean:
• A clean horizontal support or resistance level
• A prior swing high or low
• A daily VWAP or anchored VWAP from a key event
• The edge of a range or value area
• A trendline tested multiple times
In short, the level gives the pin bar a reason to exist. It becomes a reaction, not a random candle.
Mark the level before the candle forms. This stops you from retrofitting significance where there isn’t any.
Example:
Here we can see how the volume weighted average price (VWAP) can add meaningful context to a pin-bar setup. In this case, USD/CAD retraced against the prevailing downtrend and tested the VWAP anchored to the recent swing highs. At that point, price formed a clear pin-bar reversal, signalling rejection and potential continuation with the broader trend.
USD/CAD Daily Candle Chart
Past performance is not a reliable indicator of future results
Step Two: What’s Happening Under the Hood?
Once you’ve got a pin bar at a meaningful level, it’s time to look deeper. One of the best ways to do that is by dropping down to a lower timeframe, like the 5-minute chart, and replaying the session that created the candle.
Why?
Because daily candles can hide a lot. A clean pin bar might look like a strong rejection, but on the intraday chart, it might just be a low-volume fakeout or one impulsive move during quiet hours. On the other hand, a pin bar backed by real market structure is far more likely to hold.
Here’s what to look for on the lower timeframe:
• Was there a liquidity grab or stop run into the level?
• Did price pause, base or reverse with intent?
• Were there multiple attempts to push beyond the level that failed?
• Did volume spike during the rejection?
When a pin bar reflects a genuine intraday battle, not just a random wick, it often tells you more about the intentions of real participants.
Example:
In this example, GBP/USD forms a bearish pin-bar at a key area of swing resistance on the daily chart. Dropping down to the 5-minute timeframe helps reveal what actually happened inside that candle.
On this lower timeframe we can see that price initially pushed above resistance but failed to hold, triggering a steady wave of intraday selling pressure. This move was followed by a mild pullback during the latter half of the US session and into the New York close, reinforcing the idea of rejection and offering insight into the mechanics behind the pin-bar.
GBP/USD Daily Candle Chart
Past performance is not a reliable indicator of future results
GBP/USD 5min Candle Chart: How the Daily Pin-bar Formed
Past performance is not a reliable indicator of future results
Bonus Filter: What’s the Trend Context?
You could also add a third layer if you want to refine even further. Is the pin bar counter-trend, or is it a pullback within trend?
Counter-trend pin bars at key levels can work, but they’re lower probability and often take more time to play out. Pin bars that form as part of a pullback to structure in the direction of the prevailing trend tend to move more cleanly.
This is where using something like a 20 EMA or anchored VWAP can help frame the setup.
Putting It All Together
Next time you see a pin bar, pause. Don’t rush in. Ask yourself:
• Did this happen at a level that matters?
• Does the intraday story back up the candle?
If the answer is yes to both, now you’ve got something worth trading. Not just another wick in the wind.
Pin bars can be strong signals, but only when they reflect real intent. This two-step filter helps you cut through the clutter and focus on the ones that do.
Disclaimer: This is for information and learning purposes only. The information provided does not constitute investment advice nor take into account the individual financial circumstances or objectives of any investor. Any information that may be provided relating to past performance is not a reliable indicator of future results or performance. Social media channels are not relevant for UK residents.
Spread bets and CFDs are complex instruments and come with a high risk of losing money rapidly due to leverage. 85.24% of retail investor accounts lose money when trading spread bets and CFDs with this provider. You should consider whether you understand how spread bets and CFDs work and whether you can afford to take the high risk of losing your money.

GBPUSD Resistance Ahead!
HI,Traders !
#GBPUSD made a rebound
From the support and went
Up but will now retest a
Local horizontal level
Of 1.36793 from where
We will be expecting
A local bearish reaction !
Comment and subscribe to help us grow !

SHORT GBPUSDshorting gbpusd after the short term long into the higher tf poi and waiting for confirmation to short

GBPUSD Bearish ContinuationEntering a new week, GBPUSD looks to retest support at 1,35. It looks as though price is printing a bearish flag pattern , let us observe what happens on Monday

GBPUSD-4H BUYUptrend in the weekly , break resistant with strong momentum Candle. Divergency is showing and It test the Support and now ready to go up with the main trend.

09.07.25 Morning ForecastPairs on Watch -
FX:GBPUSD
FX:EURAUD
OANDA:JP225USD
FX:USDCAD
A short overview of the instruments I am looking at for today, multi-timeframe analysis down to what I will be looking at for an entry. Enjoy!

#GBPUSD: A strong bullish move incoming, comment your views The price has shown a possible price divergence, which could lead to a long-term move to 1.37. We expect the US dollar to weaken, which will likely push the price of GBPUSD to our target. Key economic data will be released later today and tomorrow, which could shape the price pattern.
Good luck and trade safely!
Team Setupsfx_

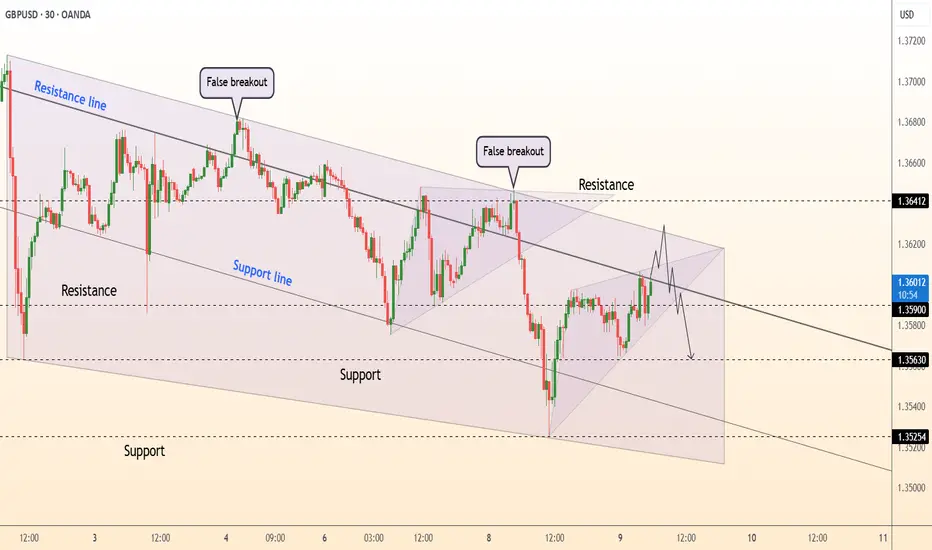
DeGRAM | GBPUSD will continue to correct📊 Technical Analysis
● Two false breakouts at the channel roof (1.3640 ±) underline supply; price is now carving successive lower-highs beneath the blue resistance line inside a 7-day falling channel.
● Fresh bearish rejection of 1.3605 leaves a descending triangle whose base aligns with 1.3563 support; a 30 min close below it exposes the lower rail / June pivot at 1.3525.
💡 Fundamental Analysis
● BoE Chief Economist Pill repeated that “further evidence of disinflation” is needed but rates are “sufficiently restrictive”, reviving August-cut bets, while firm US wage-inflation keeps Fed easing priced farther out—widening the short-rate gap in the dollar’s favour.
✨ Summary
Sell 1.3590-1.3610; break < 1.3563 targets 1.3525. Bear view void on an H1 close above 1.3640.
-------------------
Share your opinion in the comments and support the idea with a like. Thanks for your support!
GBP/USD 4-hour timeframe with a clear bearish trend currently in📍 Key Levels Noted
Resistance Zone: Around 1.35895 – 1.36053
Fair Value Gap Fill Zone: 1.35304 – 1.35575
Demand Area: 1.34928 – 1.35003
Major trendline break would invalidate the bearish structure.

GBPUSD h4 big downhe resistance at 1.36554 may be weak due to:
Multiple taps already
Reduced seller interest
A breakout above this zone could trigger short covering → sharp rally
✅ 2. Higher Low Structure
Recent low at 1.35475 held strong
Current consolidation appears like a bullish flag or accumulation range
Could indicate continuation, not rejection
GBPUSD SELL IDEA Fakeout Reversal Setup
If price dips into the support at 1.35475 again, it might:
Trap breakout traders
Reverse and form a new impulse leg upward
Target = 1.3700–1.3750 zone
Disruption Path: Bullish Breakout
Minor dip or tight range around current price
Break and hold above 1.3655
Acceleration toward 1.3700–1.3750
Disruption Invalidation
A strong close below 1.3540 with volume

GBPUSD BUY TRADEBuy Opportunity on GBPUSD
ENTRY: 1.35900
STOPLOSS: 1.35600
TAKEPROFIT: 1.37000
OUR FUND MANAGEMENT SYSTEM
We only manage (trade) clients fund. It's the responsibility of clients to deposit into their trading account with their preferred broker.
Your Minimum capital must be $100
COMMENT YOUR OPINION
Contact me on X @shajudeakinoba1

Potential Long Setting Up on GBP 4HLong term uptrend. Strong chart.
Need to see short term trend turn around. Close needs to hold.
Entry with 1:1.75 profit and 120 point stop.
Let's see how it plays out.
