GBP/USD Poised for Fifth Daily Decline- Support in ViewThe Sterling rally failed to close above confluent trend resistance at the 2022 high near 1.3749 with GBP/USD now off more than 1.8% from the monthly / yearly high. The July opening-range seems set here at 1.3530-1.3750 and the focus is on a breakout in the days ahead with the broader outlook still constructive while within this formation.
GBP/USD is testing support today at the 61.8% retracement of the late-June advance at 1.3530 with the weekly opening-range preserved just above. Initial resistance eyed along this short-term channel with breach above the objective weekly open at 1.3645 needed to shift the focus back towards the 2022 high at 1.3749- a daily close above this level is still needed to mark uptrend resumption. Subsequent resistance objective eyed at the 100% extension of the January advance at 1.3816 and the 61.8% extension of the broader 2022 advance at 1.4003.
A break lower exposes key support at the 61.8% retracement of the May rally / 2024 high-day close (HDC) at 1.3388-1.3415. A break / close below this slope would suggest a more significant high was registered last week / a larger reversal is underway with initial support seen at the May low-day close (LDC) at 1.3176.
Bottom line: A reversal from trend resistance threatens a larger correction within the broader GBP/USD uptrend. The immediate focus is on a breakout of the weekly opening-range for guidance. From a trading standpoint, losses would need to be limited to 1.3388 IF Sterling is heading higher on this stretch with a close above 1.3749 ultimately needed to mark uptrend resumption.
-MB
USDGBP trade ideas

GBPUSD | ChoCh & FVG Reversal playPrice broke bullish structure and created a Clear Change of Character (CHoCH) after sweeping the lows, indicating a shift in momentum. A valid entry setup formed as price tapped into the refined demand zone + FVG, aligning with an overall bullish reversal idea.
🔹 CHoCH confirmation
🔹 Break of trendline (liquidity sweep)
🔹 FVG + Demand zone alignment
🔹 Targeting the inefficiency fill and supply mitigation above
Expecting a push back toward premium pricing before reevaluation. Let’s see if the algo delivers.
#SMC #GBPUSD #CHoCH #FairValueGap #Orderflow #FXTradingClub #PriceAction

GBPUSD LONG TRADE PLANThe pair is trading in a bullish channel. Following this pattern, I'll be looking for buy opportunities after retest.
Please do your own analysis before placing any trades.
Cheers and Happy Trading.

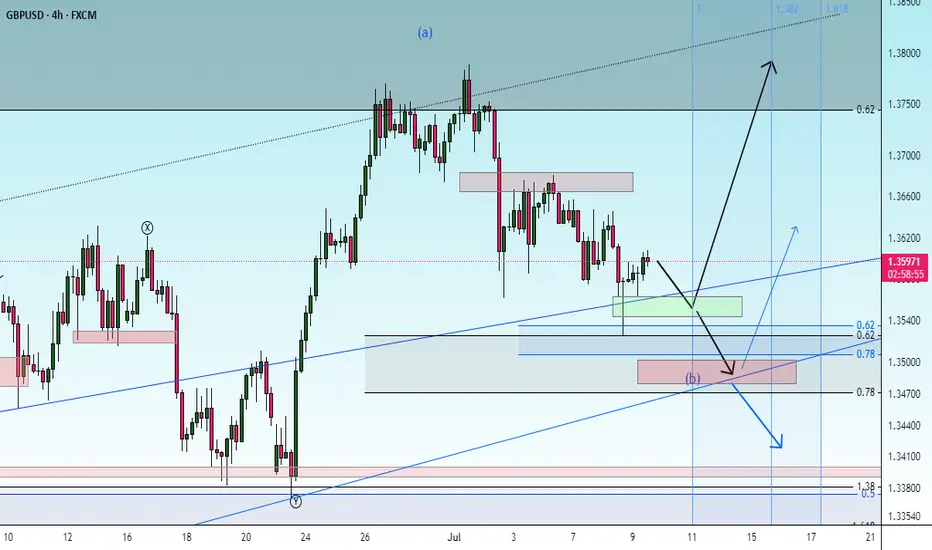
GBPUSD BUILDING TARGET GBP/USD Technical Analysis – 4H Timeframe (July 9, 2025)
This chart shows a technical analysis of the British Pound (GBP) versus the US Dollar (USD) on the 4-hour timeframe. The market is currently trading within a well-defined range, with a strong support zone (highlighted in purple) and a clear resistance level (marked in blue).
Key Levels:
Support Zone: 1.33700 – 1.34400
This zone has been tested multiple times and has acted as a strong demand area, where price has often reversed to the upside.
Current Price: 1.35991
The price is currently above the support zone but showing signs of bearish pressure.
Resistance / Target Point: 1.37921
This level has acted as a strong resistance in the past. If the price reverses from the support zone, this is the likely target point.
Analysis Summary:
The price is expected to drop down toward the support zone around 1.34000.
A bullish reversal is anticipated from this area.
If the reversal happens, the price may rally toward the target level at 1.37921.
Trading Perspective:
Buy Zone: Around 1.34000 (within the purple support box)
Target Zone: Around 1.37921
Suggested Stop-loss: Just below the support zone (e.g., around 1.33500)

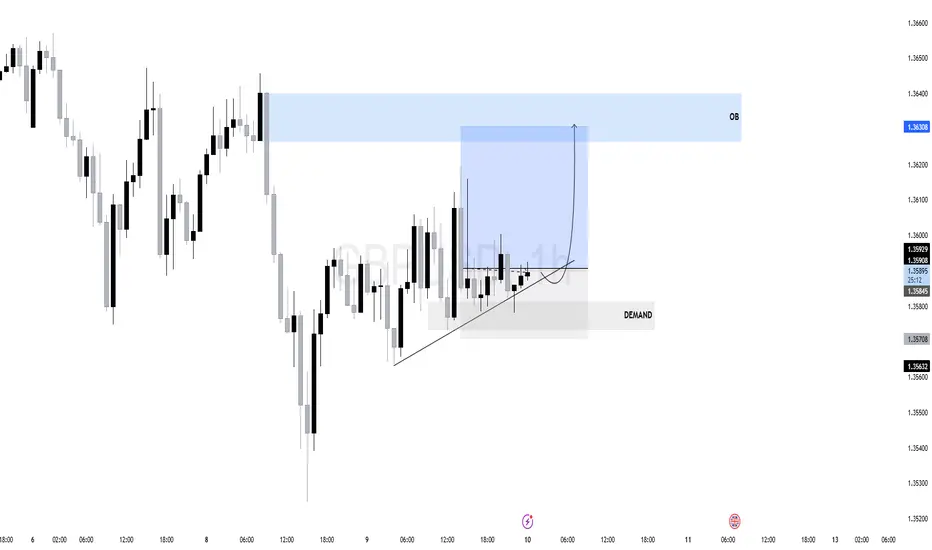
$GU (GBPUSD) 1HPrice has been consolidating after a previous sell-off and is now showing signs of accumulation above a defined demand zone (1.35600–1.35800).
The price has respected the ascending internal trendline, forming higher lows — an early sign of bullish intent.
Strong bullish rejection from this area confirms interest from smart money. Price tested it and immediately rebounded, signaling absorption of sell-side liquidity.
The internal ascending trendline continues to act as dynamic support. As long as price respects this trendline, bullish bias remains intact.
Multiple highs around 1.36300 remain untouched — a magnet for price.That area overlaps with an Order Block (OB), making it a high-probability target for institutional interest.
The tight consolidation before the expansion (highlighted in blue) suggests price is loading for a sharp move.
As long as price remains above the demand zone and trendline A bullish expansion toward the OB zone (1.36300–1.36400) Or A potential liquidity sweep above the highs, aligning with external liquidity targets.
GBPUSDThe market structure on GBPUSD shows a clear liquidity sweep above recent highs, followed by a market structure shift (MSS) to the downside, signaling a potential reversal. After the liquidity grab, price failed to sustain above the swept highs and started to form lower highs.
The RSI indicator also confirms a bearish divergence, strengthening the bearish bias. Currently, price is consolidating below the MSS level, which could act as a supply zone on any retest.
A strong bearish continuation is expected, targeting the SSL (Sell-side Liquidity) level marked below, which aligns with a potential demand zone from late June. The bearish projection suggests a move toward the 1.3350–1.3400 area.
This setup favors short opportunities on lower timeframe pullbacks, maintaining a bearish outlook as long as the price remains below the MSS.

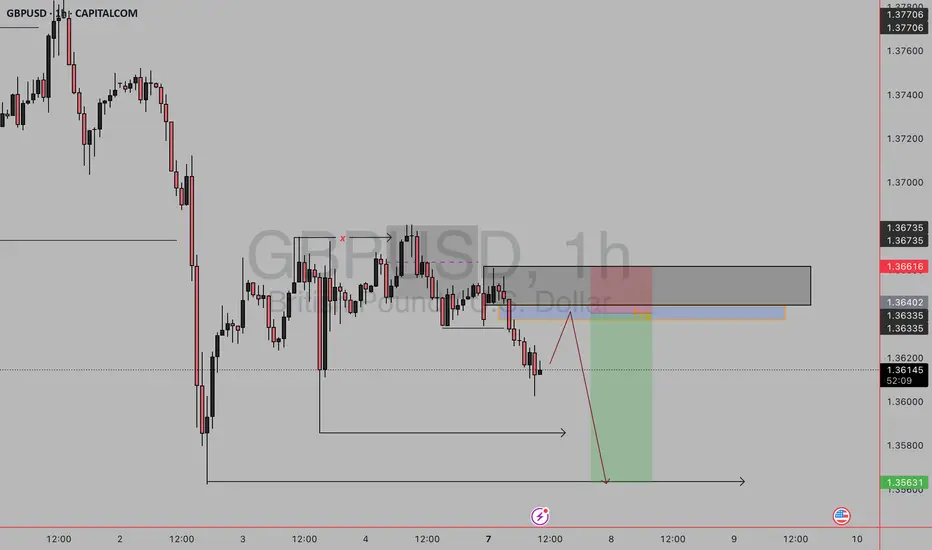
gbpusd sell setup🧠 Setup Summary:
You're anticipating a retracement into a supply zone (marked by the grey box) which contains a Fair Value Gap (FVG) before continuing the bearish move.
🧩 Key Components:
Supply Zone (Grey Box):
A previously mitigated zone where price dropped aggressively.
Likely institutional sell orders remain there.
Fair Value Gap (Orange Zone):
Price moved away fast and left an imbalance.
Your expectation: Price will return here, fill it, and then drop.
Entry Plan:
Sell when price taps into FVG or upper supply zone around 1.36420 – 1.36616.
Confirmation could be a bearish engulfing, liquidity sweep, or BOS on LTF.
Stop Loss: Above the supply zone — around 1.36680.
Take Profit (TP): A major low, likely 1.35631.
Risk-Reward: Strong RR (likely 1:3+), in line with institutional-style trading
short for gbpusdLooking at the daily time frame for gbpusd, I am bearish and belive we will attack that sellside this week or next week. Lets break this down.1st PDAY array- We have a breaker that is failing to hold price, we could see that breaker act an an inversion. The second PD array that is failing is that discount daily fvg, we are hovering on it, but it has provided no bounce, indicating weakness. DXY also looks solid, and out of eurusd pr gbpusd, pound is the one to be shorting right now. If you look at the eurgbp chart, eur has been stronger that gbp.

GBPUSDPrice reached a major weekly resistance and started selling with the daily giving a strong bearish engulfing last week. H4 formed a double top and started creating lower highs. H1 has formed a third bearish wedge. Waiting for clear breakout to look for shorts. Watch out for fundamentals this week.

GBPUSD BUY and SELL LIQUIDITY SETUP GBPUSD : A sweep of this liquidity below will open our Buy entry at $1.35702 with SL at $1.35496 and TP at $1.36576.
Watching for a Sell after Buy trade hits TP.
#GBPUSD

Potential Long Setting Up on GBP 4HLong term uptrend. Strong chart.
Need to see short term trend turn around. Close needs to hold.
Entry with 1:1.75 profit and 120 point stop.
Let's see how it plays out.

GBP/USD BEARS ARE STRONG HERE|SHORT
Hello, Friends!
GBP/USD pair is in the uptrend because previous week’s candle is green, while the price is clearly rising on the 3H timeframe. And after the retest of the resistance line above I believe we will see a move down towards the target below at 1.358 because the pair overbought due to its proximity to the upper BB band and a bearish correction is likely.
Disclosure: I am part of Trade Nation's Influencer program and receive a monthly fee for using their TradingView charts in my analysis.
✅LIKE AND COMMENT MY IDEAS✅

GBPUSD 15/3 Sell1-hr and 15 are all bear. And it is in a sell zone. Will need to drop down to 3-min to confirm market shift in order to sell to the demand zone.

GBPUSD -SHort TGT 1.3464GBPUSD is expected to hit long. However the pair will retrace to 1.3464 before futher long move.
GBPUSD TECHNICAL & ORDER FLOW ANALYSISOur analysis is based on a multi-timeframe top-down approach and fundamental analysis.
Based on our assessment, the price is expected to return to the monthly level.
DISCLAIMER: This analysis may change at any time without notice and is solely intended to assist traders in making independent investment decisions. Please note that this is a prediction, and I have no obligation to act on it, nor should you.
Please support our analysis with a boost or comment!

check the trendIt is expected that a trend change will form within the current support range and we will witness the start of an upward trend.
If the price breaks through the support range, a continuation of the downward trend will be likely.
GBPUSD BUY TRADEBuy Opportunity on GBPUSD
ENTRY: 1.35900
STOPLOSS: 1.35600
TAKEPROFIT: 1.37000
OUR FUND MANAGEMENT SYSTEM
We only manage (trade) clients fund. It's the responsibility of clients to deposit into their trading account with their preferred broker.
Your Minimum capital must be $100
COMMENT YOUR OPINION
Contact me on X @shajudeakinoba1

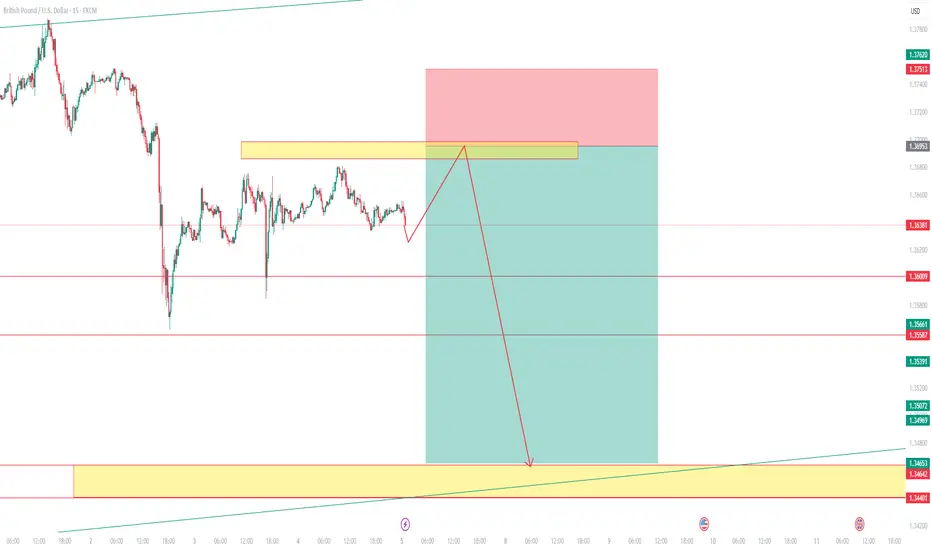
GU breaker block analysisSo as GU broke 1.3600 with strong impulse on 25th June, price left behind an OB at that same 1.3600 level. I see price has come back to that OB with a very strong drop on 2nd July and completely gone through the OB. As that OB or 1.36000 level has acted as support, it has been tested multiple times but price has now broken through couple of times, turning the 25 June OB into a breaker block, which now acts as resistance and I expect price to drop lower towards the next 4h OB at 1.34000 level.
I'm now waiting for price to reach the 4h OB left at 1.36190 on 8th July to short down towards 1.34000 level. For entry I'm going lower to 15min chart to see the Choch for extra entry confirmation.

GBP/USD Pulls Back After Rejection – Buyers Eye Lower LevelsHi everyone,
GBP/USD failed to break above the 1.37500 level and saw a rejection from that resistance, dropping further below the 1.36850 support. Since then, price has consolidated and ranged beneath this level.
Looking ahead, if price remains within this range, we anticipate a move lower to find buying interest between the 1.35300 and 1.34600 levels, which could set the stage for another push higher.
As previously noted, a decisive break above 1.37500 would renew our expectation for further upside, with the next key target around 1.38400. We'll be monitoring price action closely to see how it unfolds.
We’ll continue to provide updates on the projected path for GBP/USD as price approaches this target.
The longer-term outlook remains bullish, and we expect the rally to continue extending further from the 1.20991 January low towards 1.40000 and 1.417000.
We’ll be keeping you updated throughout the week with how we’re managing our active ideas. Thanks again for all the likes/boosts, comments and follows — we appreciate the support!
All the best for the week ahead. Trade safe.
BluetonaFX

GBPUSD Bank of England (BoE) Bank Rate
Current Rate: 4.25% ,the 10 year bond yield GB10Y =4.632%
The BoE reduced its base rate from 4.50% to 4.25% in May 2025 and has maintained it at 4.25% since then (including the June 19, 2025 meeting).
The Monetary Policy Committee (MPC) has signaled a likely gradual easing path with expectations of a 25 basis point cut possibly at the August 7, 2025 meeting, potentially bringing the rate down to around 4.00%.
The BoE’s decision reflects easing inflation pressures as inflation stands at 3.4% but remains cautious due to ongoing economic uncertainties and inflation still above target.
Federal Reserve (Fed) Funds Rate
Current Rate: Approximately 4.50%-4.25% (mid-2025 consensus)
The united state 10 year government bond yield US10Y=4.407%
The Fed has held rates steady at around 4.50% -4.25%, with markets expecting a cautious approach to rate cuts amid inflation concerns and economic data.
The Fed’s policy remains more restrictive compared to the BoE, though some easing is anticipated later in 2025 depending on inflation and growth.
Context
bond yield differential
GB10Y-US10Y=4.632%-4.407%= 0.225% advantage for carry traders in favour GBP.
Interest rate differential
GBP IRT-USD IRT= 4.25%-4.5%=-0.25% ,The Fed rate is about 0.25 percentage points higher than the BoE rate, giving a slight interest rate advantage to the USD over GBP at the short-term policy rate level.
Carry Trade Impact
The carry trade involves borrowing in a currency with a lower interest rate and investing in a currency with a higher rate to earn the spread.
Despite the Fed’s slightly higher policy rate, the BoE’s historically higher rates earlier in 2025 and expectations of a slower pace of Fed cuts have supported GBP carry trades.
The interest rate differential is relatively narrow, so carry trade flows are moderate but still contribute to demand for GBP assets.
The bond yield differential slightly favors GBP at 4.632% gb10y as against USD 4.407% , attracting fixed-income capital to uk treasury giving gbp short term advantage.
#GBPUSD

Intraday Drop into Support Zone — Can GBP/USD Bounce?Hi everyone,
GBP/USD continues to consolidate below the 1.36850 level. Price failed to break above and moved lower into the 1.35300–1.34600 zone, providing us with a clean intraday trade setup.
A drop into this area was highlighted as the more probable short‑term path, and we’re now looking for GBP/USD to find support in this region; and more importantly, to hold above the 1.33800 level to form the base for another push higher.
As previously noted, a decisive break above 1.37500 would renew our expectation for further upside, with the next key target around 1.38400. We'll be monitoring price action closely to see how it unfolds.
We’ll continue to provide updates on the projected path for GBP/USD as price approaches this target.
The longer-term outlook remains bullish, and we expect the rally to continue extending further from the 1.20991 January low towards 1.40000 and 1.417000.
We’ll be keeping you updated throughout the week with how we’re managing our active ideas. Thanks again for all the likes/boosts, comments and follows — we appreciate the support!
All the best for the week ahead. Trade safe.
BluetonaFX

GBPUSD SetupWould take a sell once price gets to my POI, make sure you make your own Research's before entering.

GBPUSD"My current expectation is that the price will continue to move within the descending channel on the 1-hour timeframe. I'm waiting for the price to retest the upper boundary of the channel. If a valid bearish confirmation signal (such as a reversal candlestick pattern) forms at that level, I plan to enter a short position."
